| Param | Original file | Final file |
|---|---|---|
| Filename | modeM0/AS1A07_054T01_9000003486_23602cztM0_level2.evt | modeM0/AS1A07_054T01_9000003486_23602cztM0_level2_quad_clean.evt |
| Size (bytes) | 626,967,360 | 159,281,280 |
| Size | 597.9 MB | 151.9 MB |
| Events in quadrant A | 3,904,479 | 1,094,331 |
| Events in quadrant B | 4,928,734 | 1,071,226 |
| Events in quadrant C | 3,977,105 | 1,037,806 |
| Events in quadrant D | 5,584,621 | 1,013,995 |
| Mode SS | |||
|---|---|---|---|
| Quadrant | BADHDUFLAG | Total packets | Discarded packets |
| A | 0 | 176 | 0 |
| B | 0 | 176 | 0 |
| C | 0 | 176 | 0 |
| D | 0 | 176 | 0 |
| Mode M9 | |||
|---|---|---|---|
| Quadrant | BADHDUFLAG | Total packets | Discarded packets |
| A | 0 | 5 | 0 |
| B | 0 | 5 | 0 |
| C | 0 | 5 | 0 |
| D | 0 | 5 | 0 |
| Mode M0 | |||
|---|---|---|---|
| Quadrant | BADHDUFLAG | Total packets | Discarded packets |
| A | 0 | 17675 | 1 |
| B | 0 | 20452 | 2 |
| C | 0 | 17699 | 1 |
| D | 0 | 22674 | 1 |
| Quadrant | Total seconds | Saturated seconds | Saturation percentage |
|---|---|---|---|
| A | 8749 | 30 | 0.342896% |
| B | 8749 | 336 | 3.840439% |
| C | 8749 | 65 | 0.742942% |
| D | 8749 | 74 | 0.845811% |
Noise dominated data is calculated using 1-second bins in cleaned event files. If a bin has >2000 counts, and if more than 50% of those come from <1% of pixels, then it is considered to be noise-dominated and hence unusable.
| Quadrant | # 1 sec bins | Bins with >0 counts | Bins with >2000 counts | High rate bins dominated by noise | Noise dominated (total time) | Noise dominated (detector-on time) | Marked lightcurve |
|---|---|---|---|---|---|---|---|
| A | 9219 | 8749 | 0 | 0 | 0.00% | 0.00% | 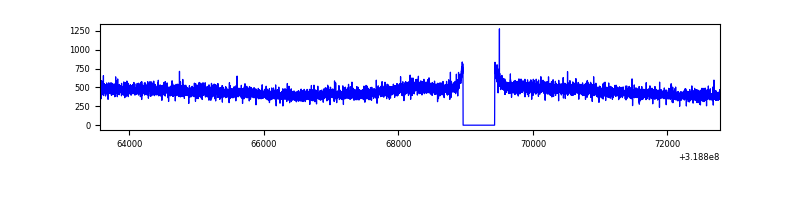 |
| B | 9219 | 8750 | 246 | 246 | 2.67% | 2.81% | 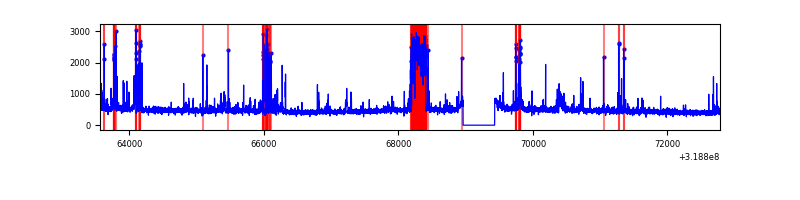 |
| C | 9219 | 8750 | 0 | 0 | 0.00% | 0.00% | 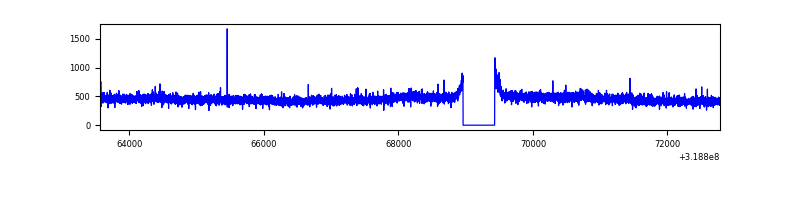 |
| D | 9219 | 8750 | 32 | 32 | 0.35% | 0.37% | 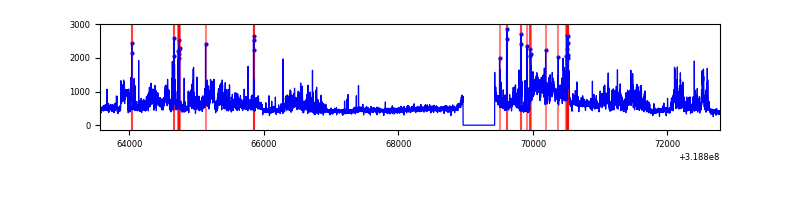 |
Top three noisy pixels from each quadrant. If the there are fewer than three noisy pixels in the level2.evt file, extra rows are filled as -1
| Pixel properties | Quadrant properties | ||||||
|---|---|---|---|---|---|---|---|
| Quadrant | DetID | PixID | Counts | Sigma | Mean | Median | Sigma |
| A | 13 | 254 | 16006 | 73.52 | 1011 | 988 | 204.3 |
| A | 3 | 137 | 8805 | 38.27 | 1011 | 988 | 204.3 |
| A | 0 | 226 | 8573 | 37.13 | 1011 | 988 | 204.3 |
| B | 3 | 64 | 847999 | 4537.75 | 985 | 960 | 186.7 |
| B | 0 | 189 | 94204 | 499.53 | 985 | 960 | 186.7 |
| B | 15 | 33 | 35416 | 184.59 | 985 | 960 | 186.7 |
| C | 14 | 238 | 153436 | 677.78 | 967 | 971 | 224.9 |
| C | 7 | 247 | 24232 | 103.41 | 967 | 971 | 224.9 |
| C | 0 | 10 | 8763 | 34.64 | 967 | 971 | 224.9 |
| D | 1 | 52 | 833112 | 3499.4 | 979 | 948 | 237.8 |
| D | 9 | 85 | 816191 | 3428.25 | 979 | 948 | 237.8 |
| D | 12 | 233 | 121000 | 504.84 | 979 | 948 | 237.8 |
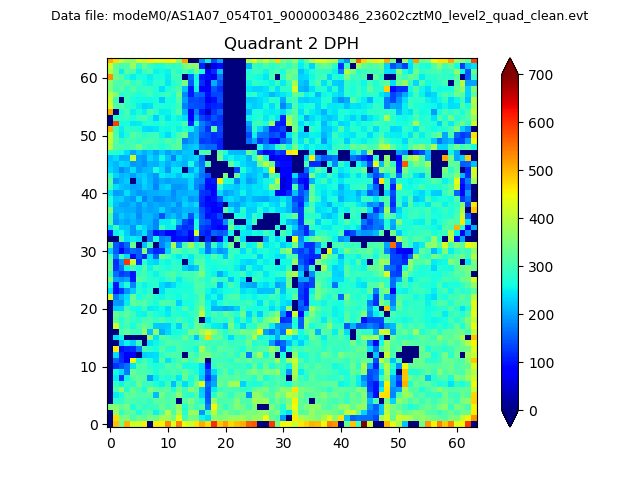
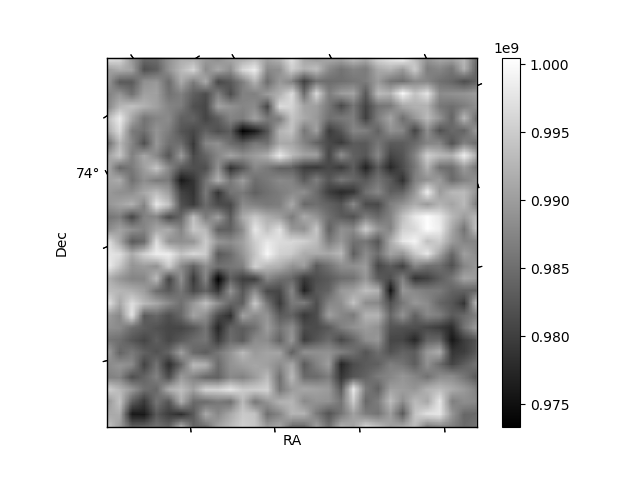
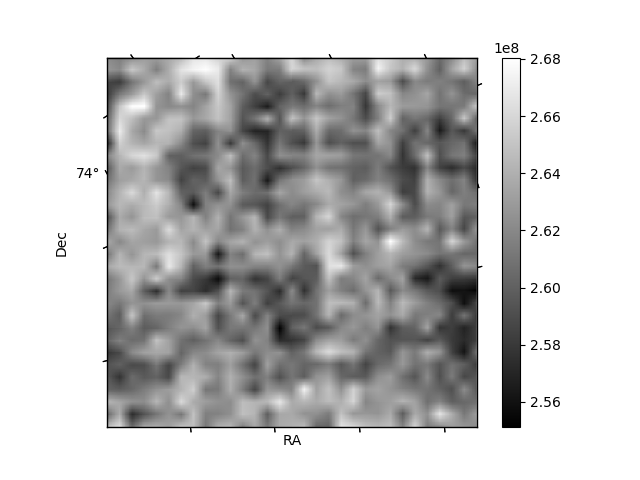
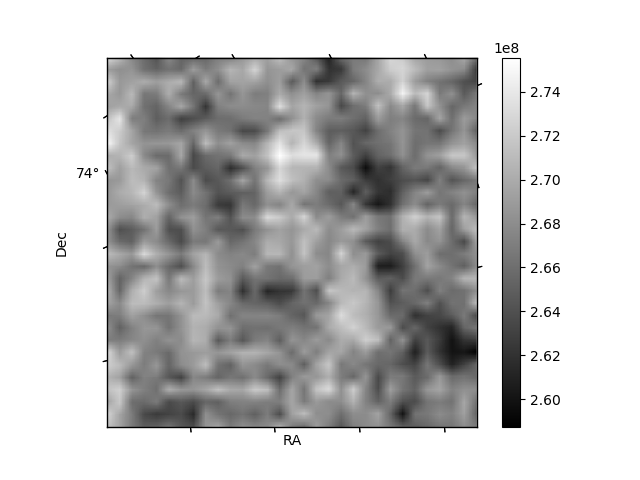
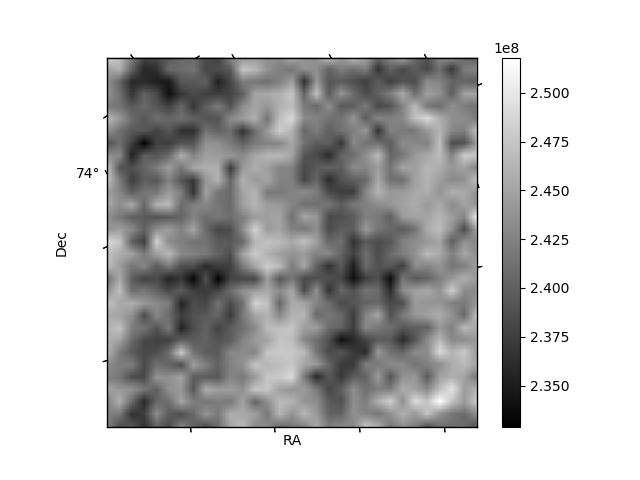
Histogram calculated using DETX and DETY for each event in the final _common_clean file
| Quadrant A | 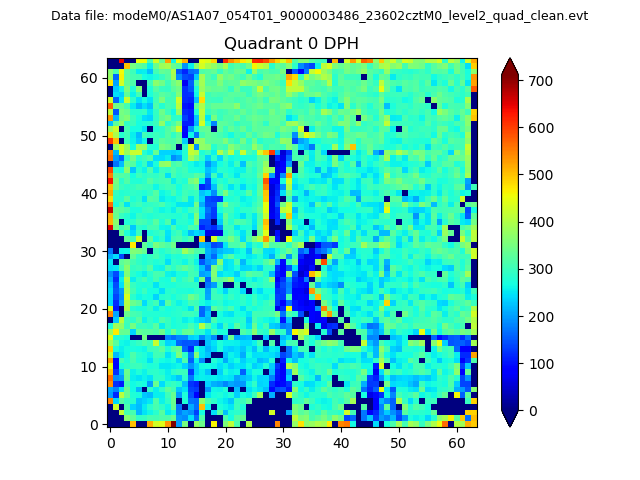 |
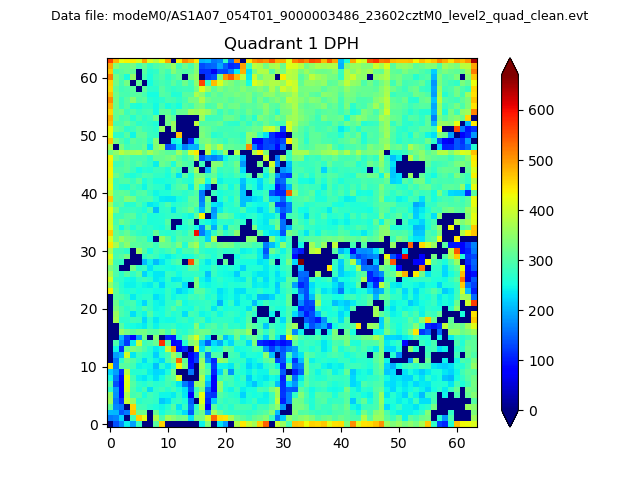 |
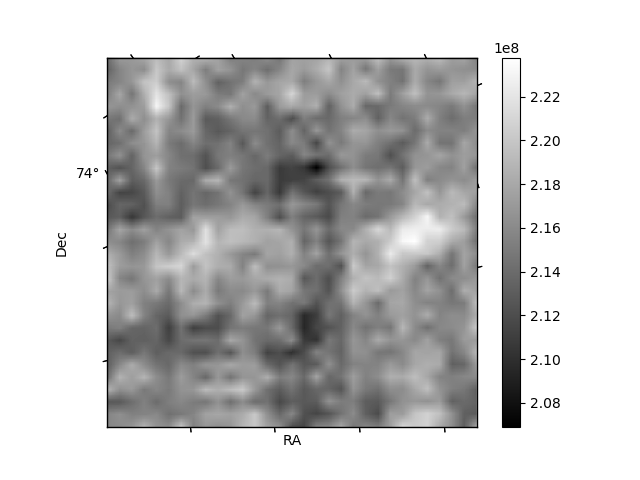
Quadrant B |
|---|---|---|---|
| Quadrant D | 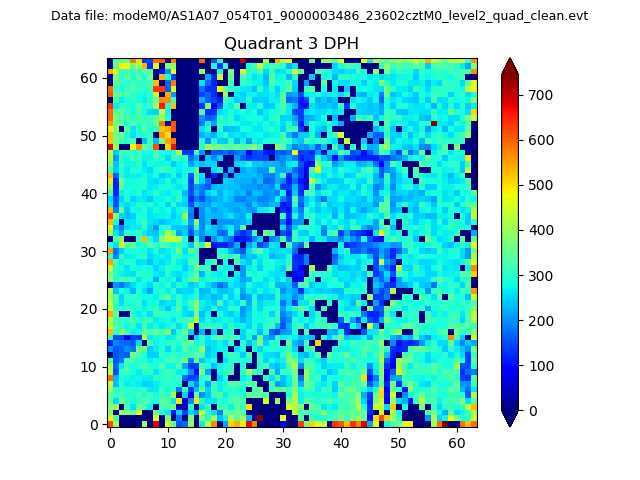 |
 |
Quadrant C |
| Plot type | Count rate plots | Images |
|---|---|---|
| Comparison with Poisson distribution Blue bars denote a histogram of data divided into 1 sec bins. Red curve is a Poisson curve with rate = median count rate of data. |
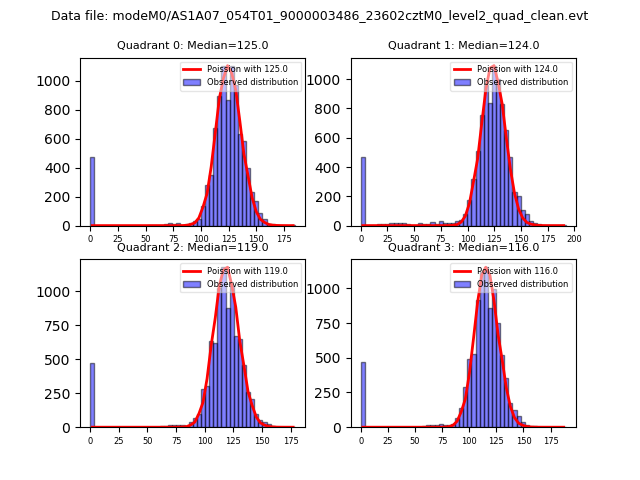 |
 |
| Quadrant-wise count rates Data is divided into 100 sec bins |
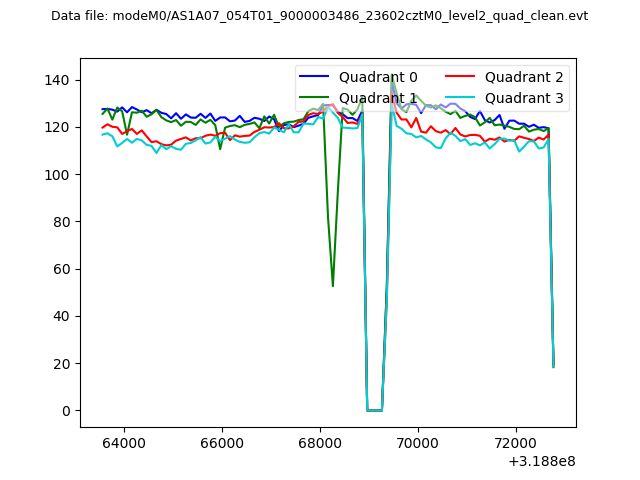 |
|
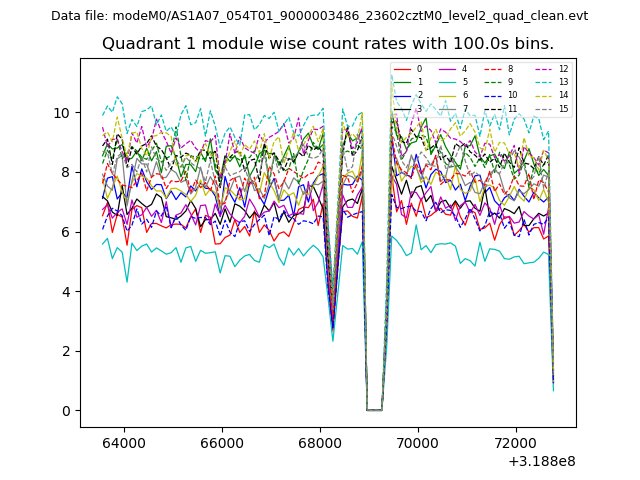
| Module-wise count rates for Quadrant A Data is divided into 100 sec bins |
 |
 |
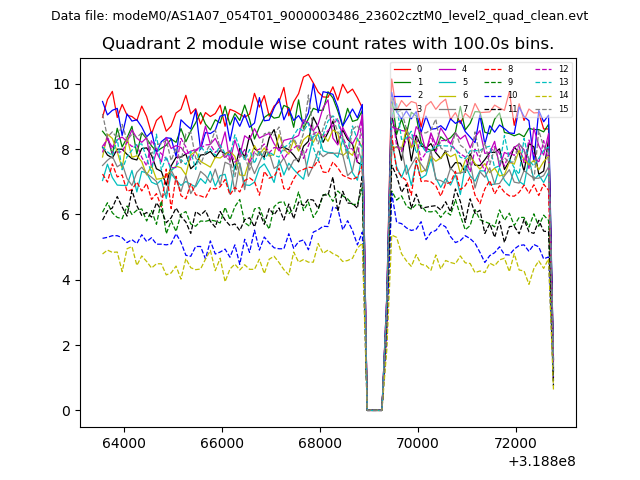
| Module-wise count rates for Quadrant B Data is divided into 100 sec bins |
 |
 |
| Module-wise count rates for Quadrant C Data is divided into 100 sec bins |
 |
 |
| Module-wise count rates for Quadrant D Data is divided into 100 sec bins |
 |
 |
| Parameter | Plot |
|---|---|
| CZT HV Monitor | 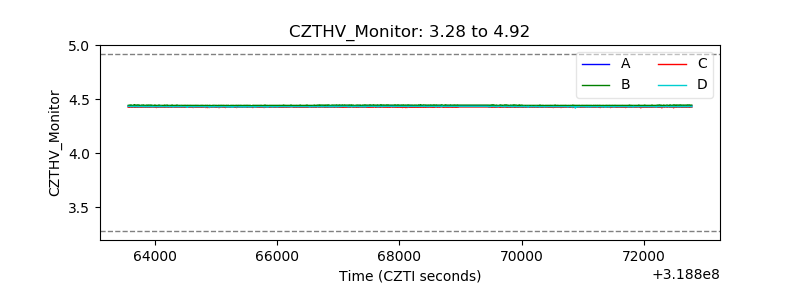 |
| D_VDD | 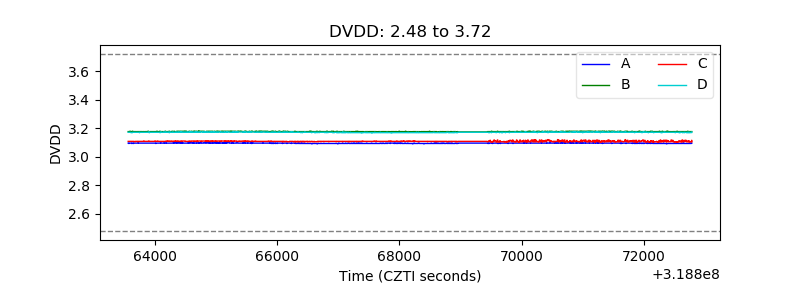 |
| Temperature 1 | 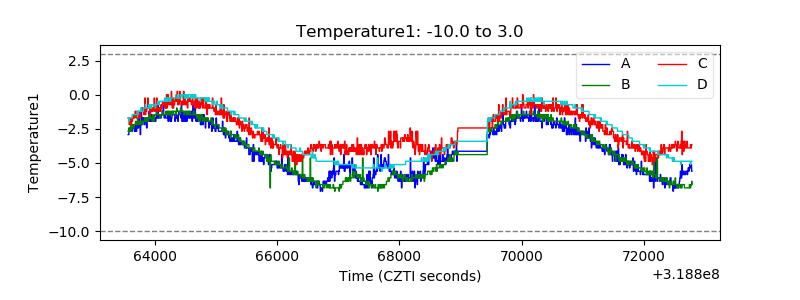 |
| Veto HV Monitor |  |
| Veto LLD | 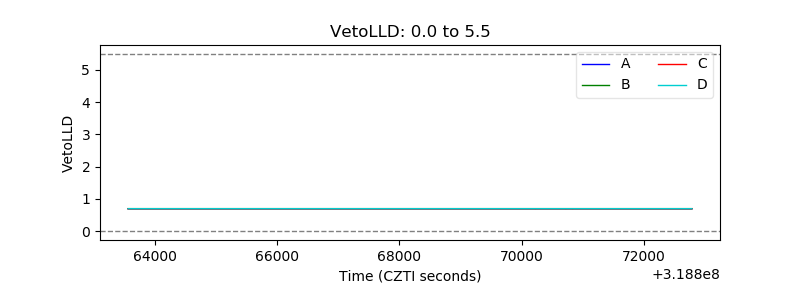 |
| Alpha Counter | 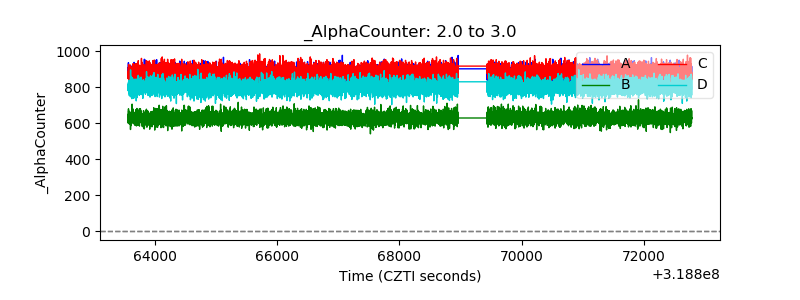 |
| _CPM_Rate | 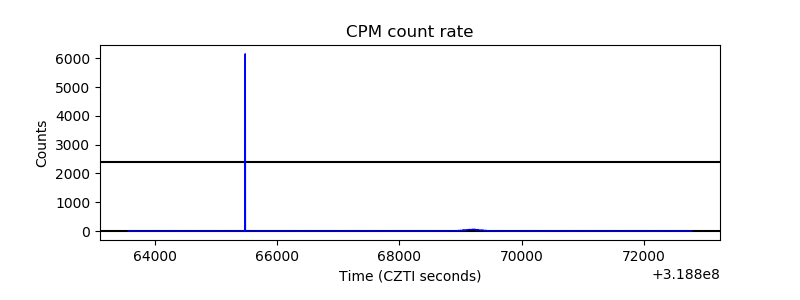 |
| CZT Counter | 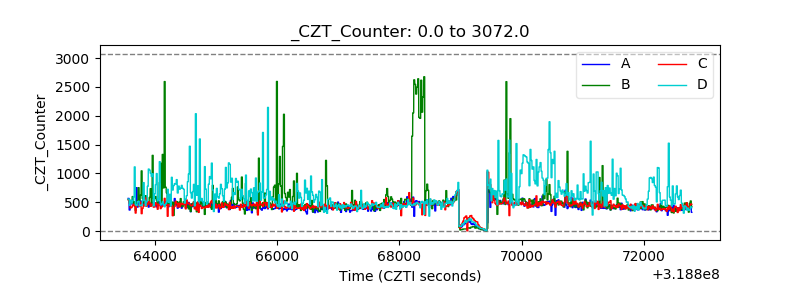 |
| +2.5 Volts monitor |  |
| +5 Volts monitor | 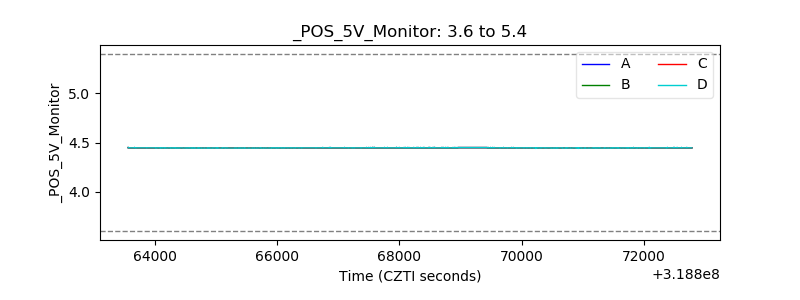 |
| _ROLL_ROT | 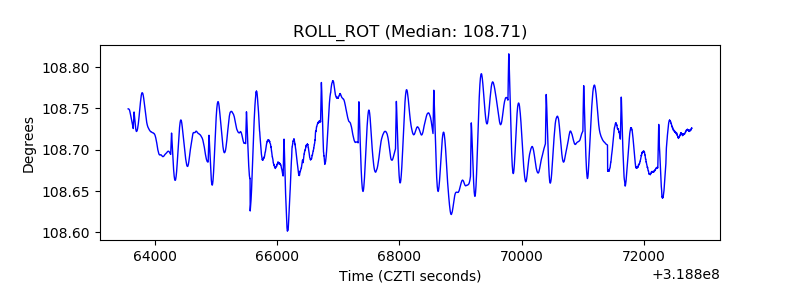 |
| _Roll_DEC | 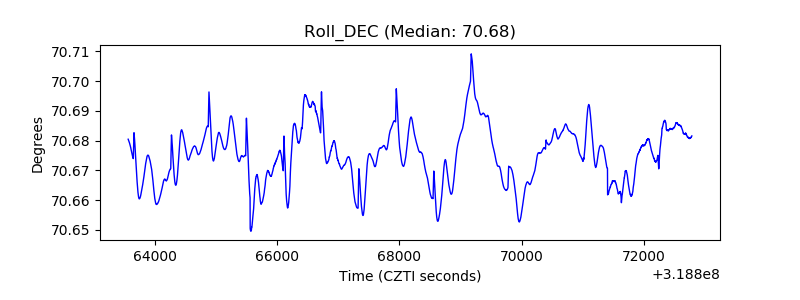 |
| _Roll_RA | 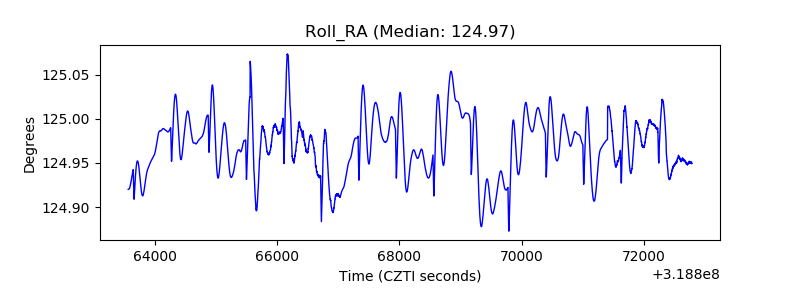 |
| Veto Counter | 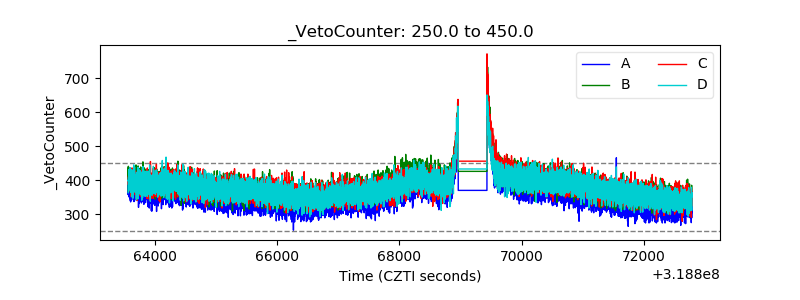 |