| Param | Original file | Final file |
|---|---|---|
| Filename | modeM0/AS1A07_054T01_9000003486_23603cztM0_level2.evt | modeM0/AS1A07_054T01_9000003486_23603cztM0_level2_quad_clean.evt |
| Size (bytes) | 771,312,960 | 195,171,840 |
| Size | 735.6 MB | 186.1 MB |
| Events in quadrant A | 4,778,443 | 1,330,799 |
| Events in quadrant B | 5,862,807 | 1,321,720 |
| Events in quadrant C | 5,511,896 | 1,273,729 |
| Events in quadrant D | 6,488,378 | 1,251,231 |
| Mode SS | |||
|---|---|---|---|
| Quadrant | BADHDUFLAG | Total packets | Discarded packets |
| A | 0 | 218 | 0 |
| B | 0 | 218 | 0 |
| C | 0 | 218 | 0 |
| D | 0 | 218 | 0 |
| Mode M9 | |||
|---|---|---|---|
| Quadrant | BADHDUFLAG | Total packets | Discarded packets |
| A | 0 | 14 | 0 |
| B | 0 | 14 | 0 |
| C | 0 | 14 | 0 |
| D | 0 | 14 | 0 |
| Mode M0 | |||
|---|---|---|---|
| Quadrant | BADHDUFLAG | Total packets | Discarded packets |
| A | 0 | 21520 | 2 |
| B | 0 | 24555 | 2 |
| C | 0 | 23661 | 2 |
| D | 0 | 26431 | 2 |
| Quadrant | Total seconds | Saturated seconds | Saturation percentage |
|---|---|---|---|
| A | 10594 | 46 | 0.434208% |
| B | 10595 | 254 | 2.397357% |
| C | 10595 | 172 | 1.623407% |
| D | 10595 | 188 | 1.774422% |
Noise dominated data is calculated using 1-second bins in cleaned event files. If a bin has >2000 counts, and if more than 50% of those come from <1% of pixels, then it is considered to be noise-dominated and hence unusable.
| Quadrant | # 1 sec bins | Bins with >0 counts | Bins with >2000 counts | High rate bins dominated by noise | Noise dominated (total time) | Noise dominated (detector-on time) | Marked lightcurve |
|---|---|---|---|---|---|---|---|
| A | 12044 | 10596 | 0 | 0 | 0.00% | 0.00% | 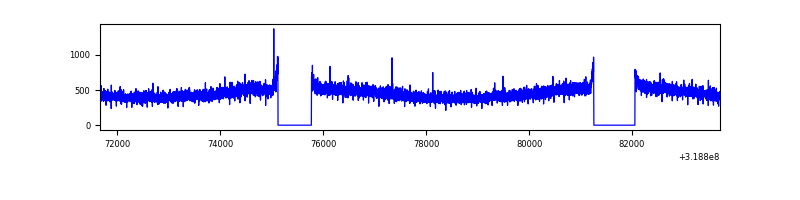 |
| B | 12045 | 10595 | 152 | 152 | 1.26% | 1.43% | 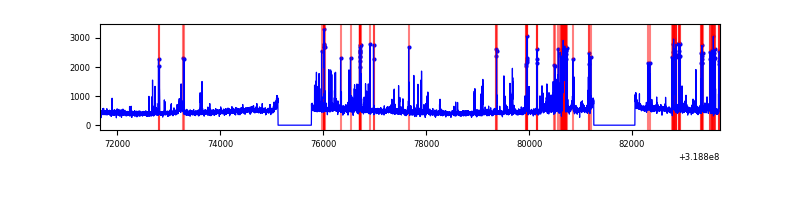 |
| C | 12045 | 10595 | 7 | 7 | 0.06% | 0.07% | 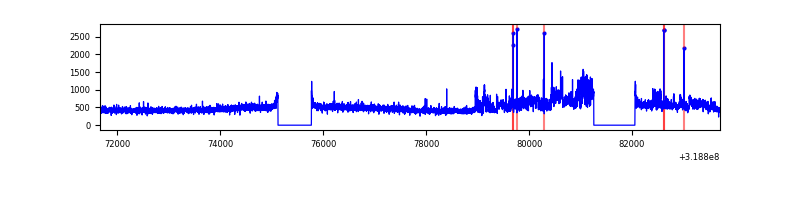 |
| D | 12045 | 10595 | 113 | 113 | 0.94% | 1.07% | 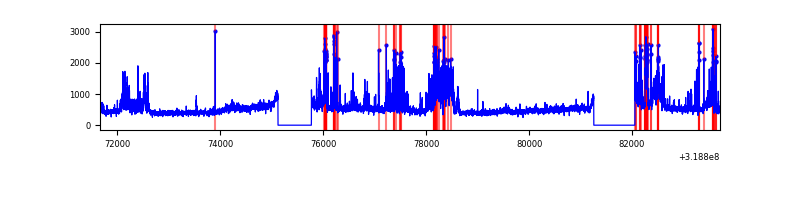 |
Top three noisy pixels from each quadrant. If the there are fewer than three noisy pixels in the level2.evt file, extra rows are filled as -1
| Pixel properties | Quadrant properties | ||||||
|---|---|---|---|---|---|---|---|
| Quadrant | DetID | PixID | Counts | Sigma | Mean | Median | Sigma |
| A | 13 | 254 | 18904 | 71.11 | 1238 | 1213 | 248.8 |
| A | 3 | 137 | 10968 | 39.21 | 1238 | 1213 | 248.8 |
| A | 0 | 226 | 10785 | 38.48 | 1238 | 1213 | 248.8 |
| B | 3 | 64 | 867002 | 3728.38 | 1224 | 1190 | 232.2 |
| B | 0 | 189 | 70530 | 298.59 | 1224 | 1190 | 232.2 |
| B | 0 | 230 | 70356 | 297.84 | 1224 | 1190 | 232.2 |
| C | 10 | 9 | 626889 | 2236.79 | 1191 | 1194 | 279.7 |
| C | 14 | 238 | 188442 | 669.39 | 1191 | 1194 | 279.7 |
| C | 7 | 247 | 24105 | 81.9 | 1191 | 1194 | 279.7 |
| D | 9 | 85 | 1041272 | 3562.5 | 1201 | 1165 | 292.0 |
| D | 1 | 52 | 516731 | 1765.88 | 1201 | 1165 | 292.0 |
| D | 12 | 233 | 204440 | 696.24 | 1201 | 1165 | 292.0 |
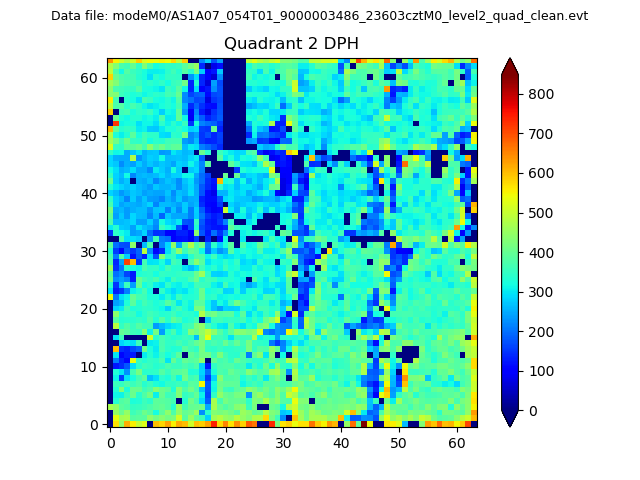
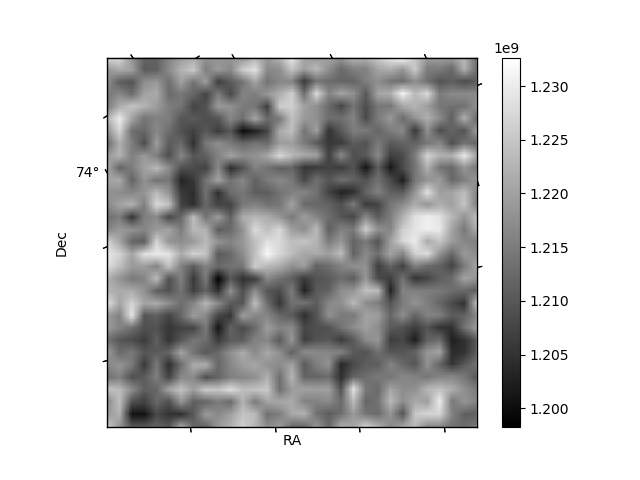
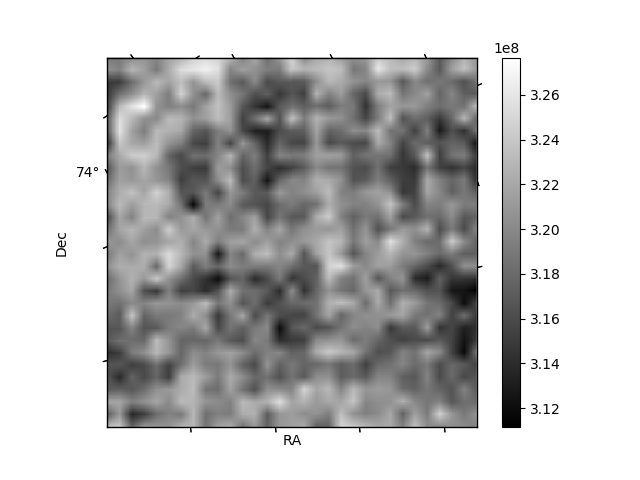
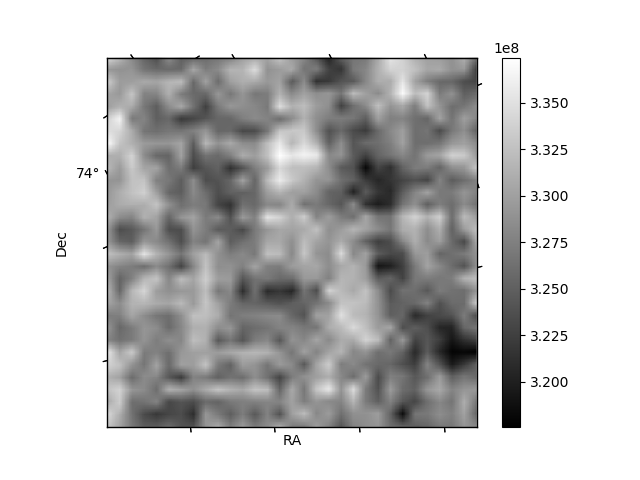
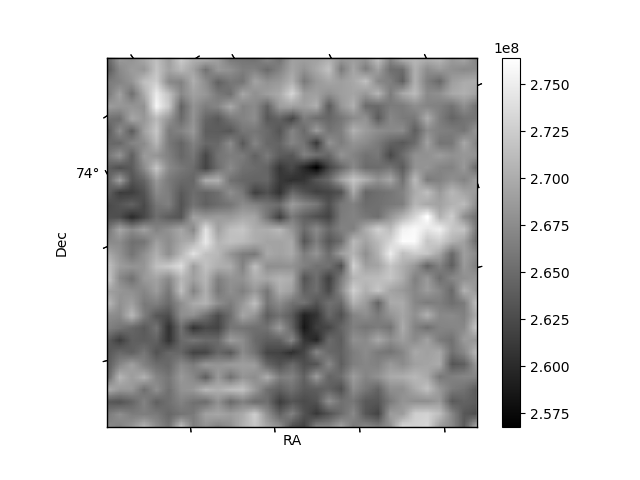
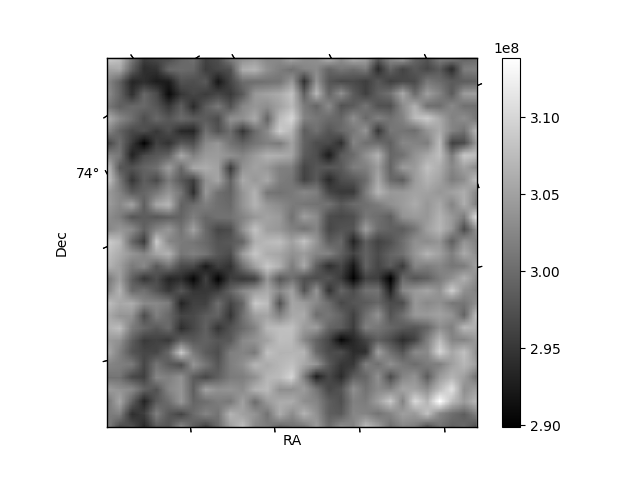
Histogram calculated using DETX and DETY for each event in the final _common_clean file
| Quadrant A | 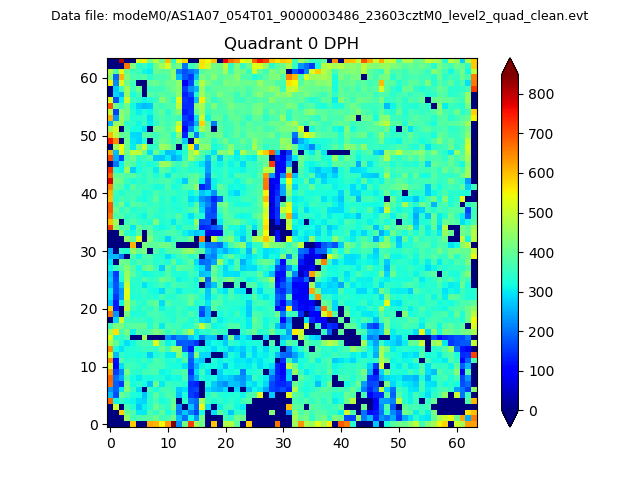 |
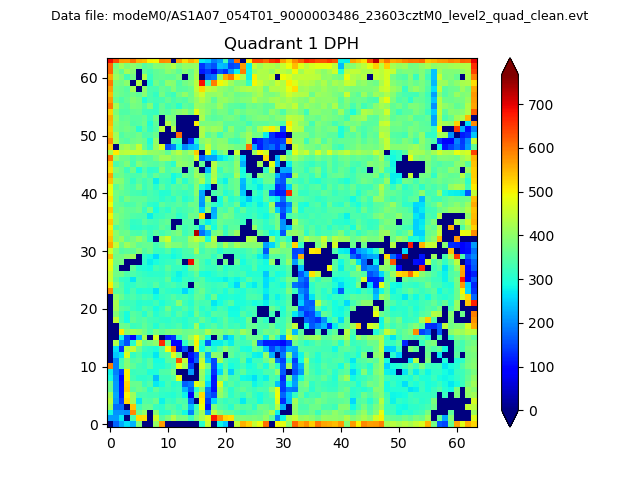 |
Quadrant B |
|---|---|---|---|
| Quadrant D | 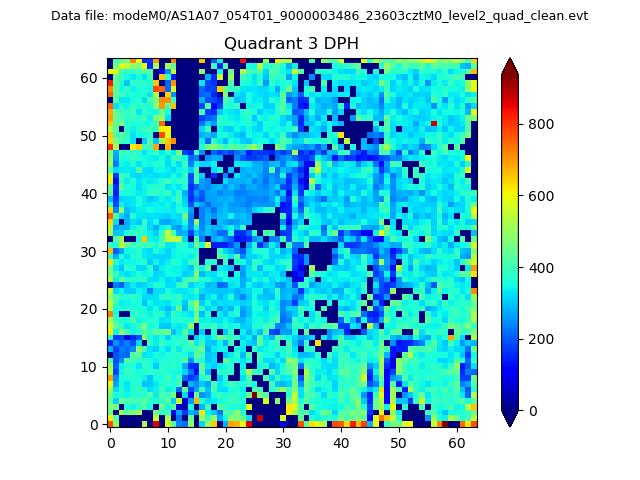 |
 |
Quadrant C |
| Plot type | Count rate plots | Images |
|---|---|---|
| Comparison with Poisson distribution Blue bars denote a histogram of data divided into 1 sec bins. Red curve is a Poisson curve with rate = median count rate of data. |
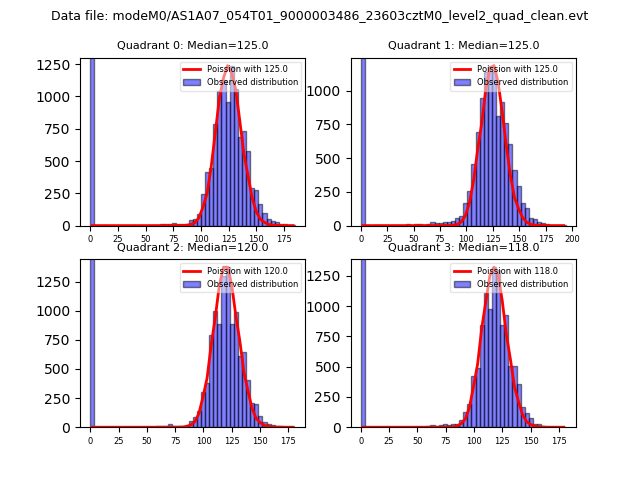 |
 |
| Quadrant-wise count rates Data is divided into 100 sec bins |
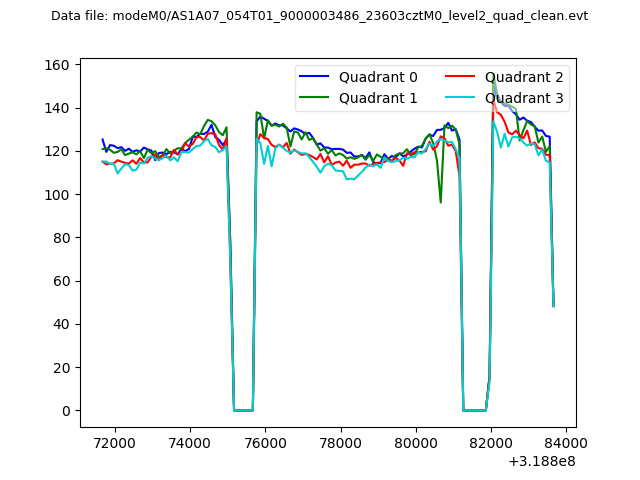 |
|
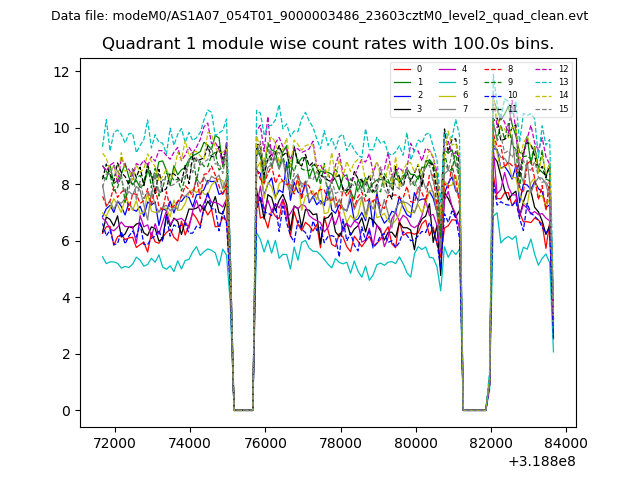
| Module-wise count rates for Quadrant A Data is divided into 100 sec bins |
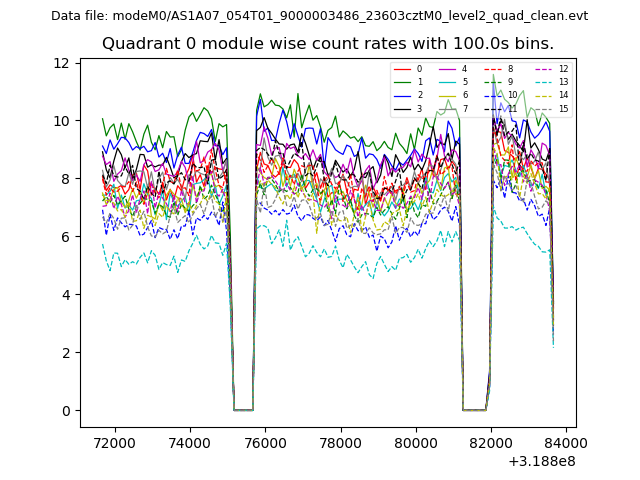 |
 |
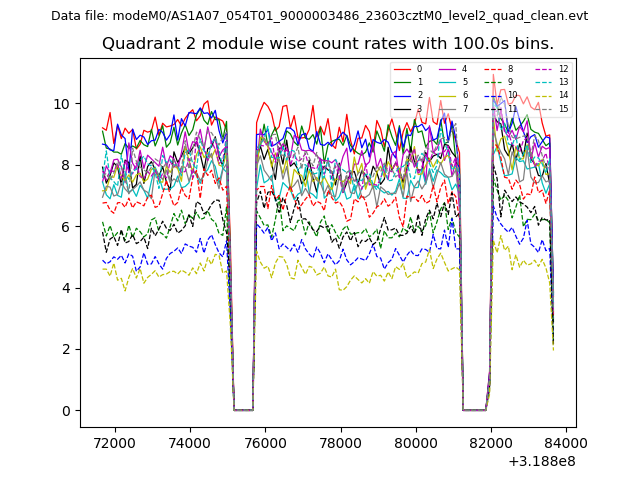
| Module-wise count rates for Quadrant B Data is divided into 100 sec bins |
 |
 |
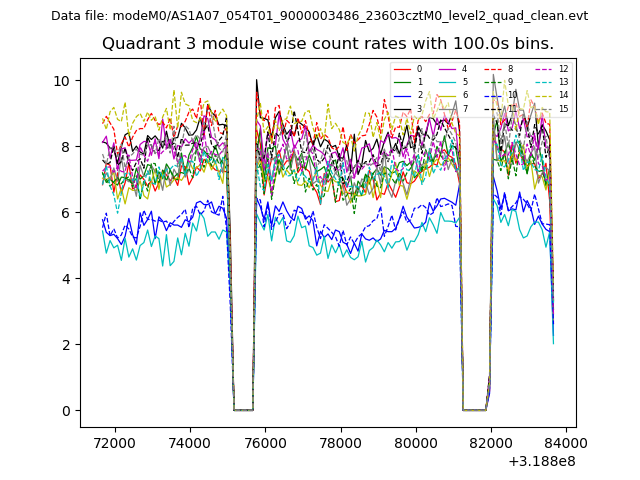
| Module-wise count rates for Quadrant C Data is divided into 100 sec bins |
 |
 |
| Module-wise count rates for Quadrant D Data is divided into 100 sec bins |
 |
 |
| Parameter | Plot |
|---|---|
| CZT HV Monitor | 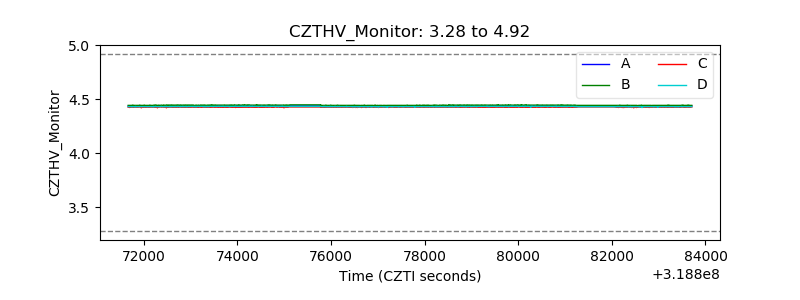 |
| D_VDD | 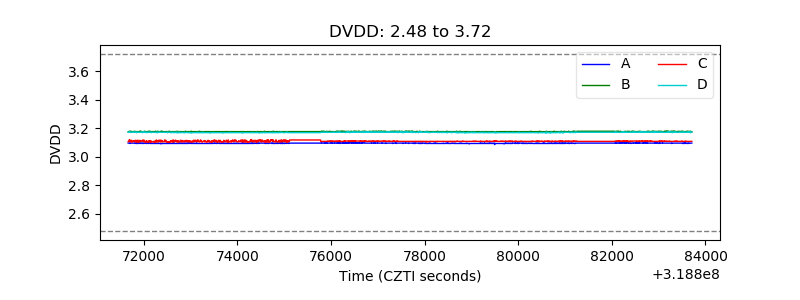 |
| Temperature 1 | 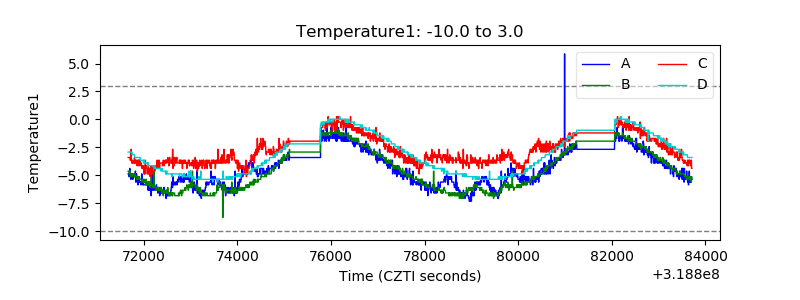 |
| Veto HV Monitor |  |
| Veto LLD | 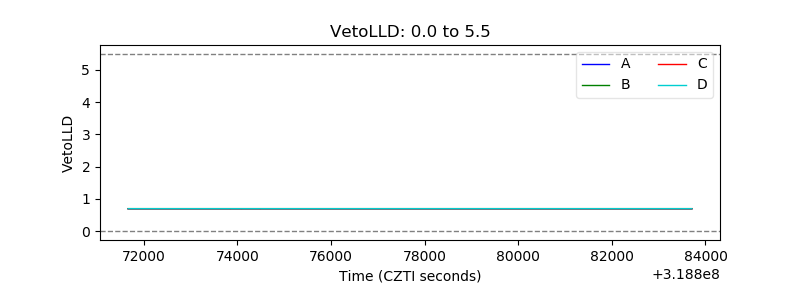 |
| Alpha Counter | 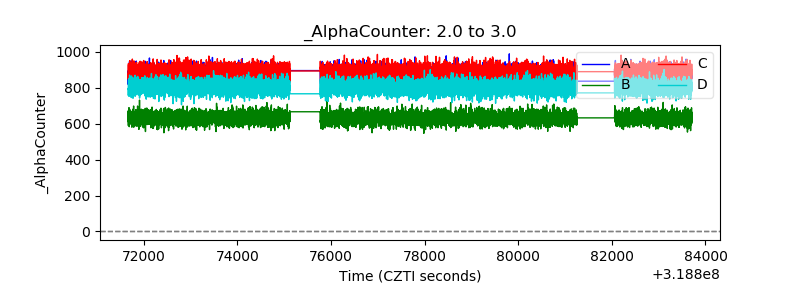 |
| _CPM_Rate |  |
| CZT Counter | 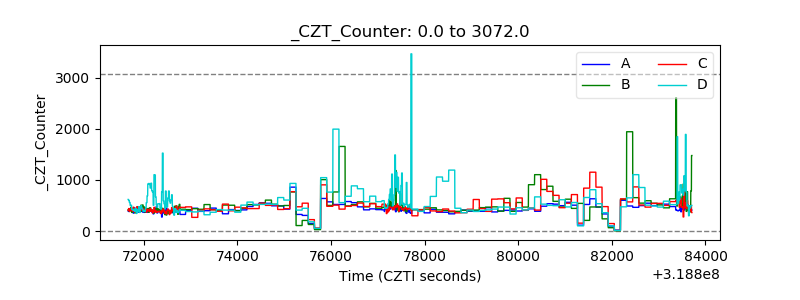 |
| +2.5 Volts monitor |  |
| +5 Volts monitor | 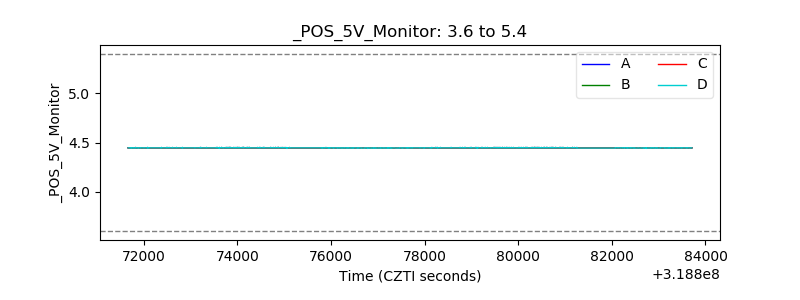 |
| _ROLL_ROT | 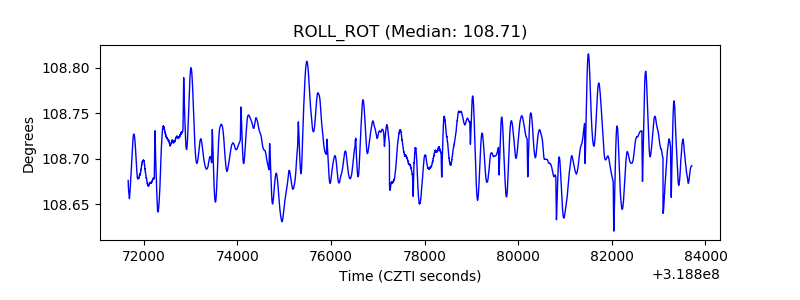 |
| _Roll_DEC | 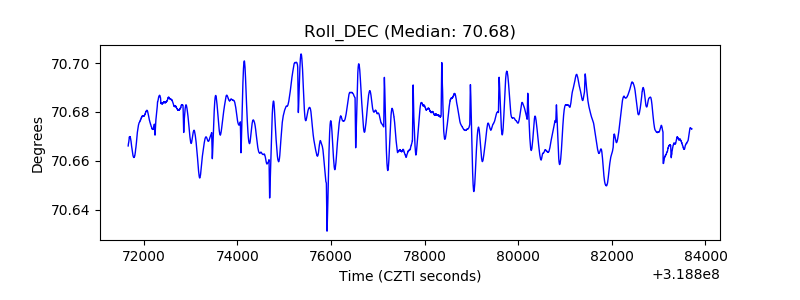 |
| _Roll_RA | 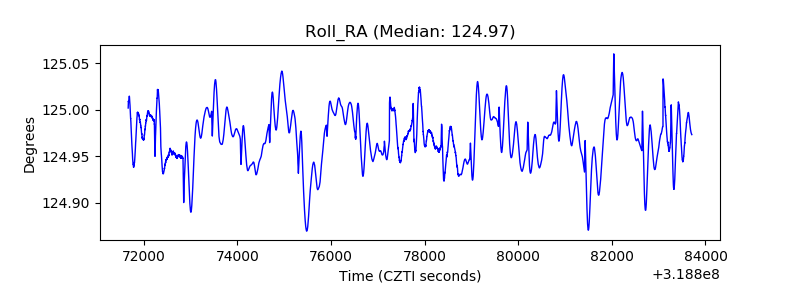 |
| Veto Counter | 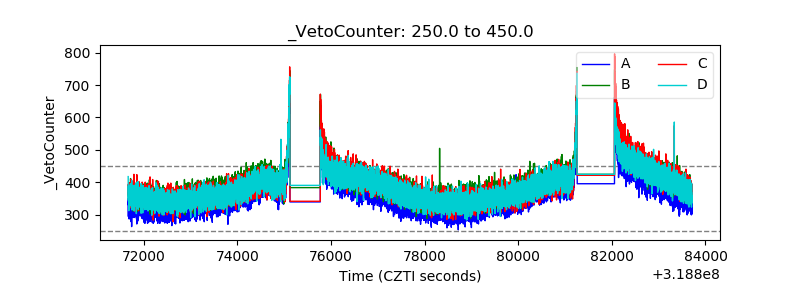 |