| Param | Original file | Final file |
|---|---|---|
| Filename | modeM0/AS1T03_178T01_9000003488_23605cztM0_level2.evt | modeM0/AS1T03_178T01_9000003488_23605cztM0_level2_quad_clean.evt |
| Size (bytes) | 452,471,040 | 92,661,120 |
| Size | 431.5 MB | 88.4 MB |
| Events in quadrant A | 3,102,122 | 594,938 |
| Events in quadrant B | 3,345,494 | 616,487 |
| Events in quadrant C | 3,185,199 | 581,606 |
| Events in quadrant D | 3,623,874 | 555,062 |
| Mode M0 | |||
|---|---|---|---|
| Quadrant | BADHDUFLAG | Total packets | Discarded packets |
| A | 0 | 13512 | 2 |
| B | 0 | 14095 | 2 |
| C | 0 | 13580 | 2 |
| D | 0 | 15255 | 2 |
| Mode M9 | |||
|---|---|---|---|
| Quadrant | BADHDUFLAG | Total packets | Discarded packets |
| A | 0 | 17 | 0 |
| B | 0 | 18 | 0 |
| C | 0 | 18 | 0 |
| D | 0 | 18 | 0 |
| Mode SS | |||
|---|---|---|---|
| Quadrant | BADHDUFLAG | Total packets | Discarded packets |
| A | 0 | 134 | 0 |
| B | 0 | 134 | 0 |
| C | 0 | 134 | 0 |
| D | 0 | 134 | 0 |
| Quadrant | Total seconds | Saturated seconds | Saturation percentage |
|---|---|---|---|
| A | 6567 | 14 | 0.213187% |
| B | 6567 | 38 | 0.578651% |
| C | 6567 | 37 | 0.563423% |
| D | 6567 | 84 | 1.279123% |
Noise dominated data is calculated using 1-second bins in cleaned event files. If a bin has >2000 counts, and if more than 50% of those come from <1% of pixels, then it is considered to be noise-dominated and hence unusable.
| Quadrant | # 1 sec bins | Bins with >0 counts | Bins with >2000 counts | High rate bins dominated by noise | Noise dominated (total time) | Noise dominated (detector-on time) | Marked lightcurve |
|---|---|---|---|---|---|---|---|
| A | 7687 | 6568 | 0 | 0 | 0.00% | 0.00% | 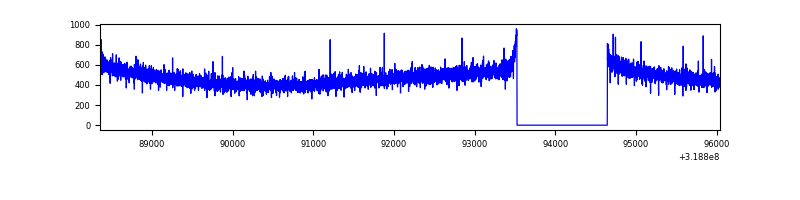 |
| B | 7687 | 6568 | 8 | 8 | 0.10% | 0.12% | 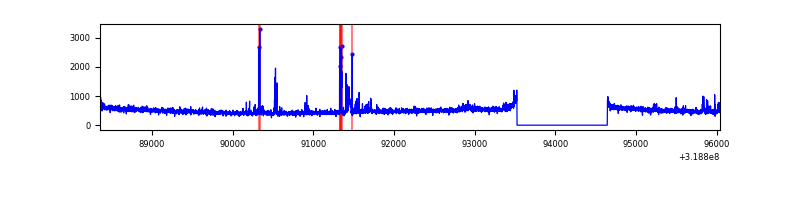 |
| C | 7687 | 6567 | 3 | 3 | 0.04% | 0.05% | 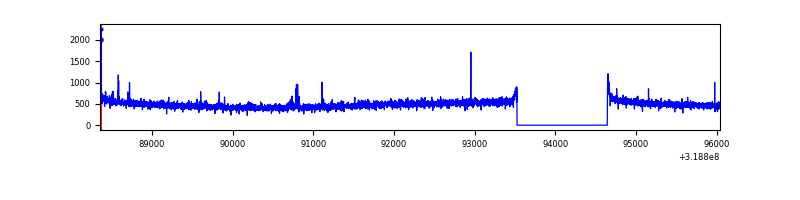 |
| D | 7687 | 6568 | 85 | 85 | 1.11% | 1.29% | 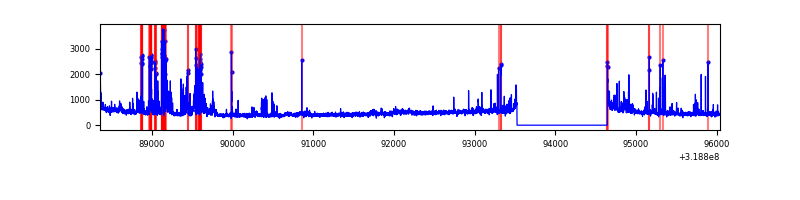 |
Top three noisy pixels from each quadrant. If the there are fewer than three noisy pixels in the level2.evt file, extra rows are filled as -1
| Pixel properties | Quadrant properties | ||||||
|---|---|---|---|---|---|---|---|
| Quadrant | DetID | PixID | Counts | Sigma | Mean | Median | Sigma |
| A | 13 | 254 | 9617 | 54.63 | 804 | 789 | 161.6 |
| A | 3 | 137 | 7254 | 40.0 | 804 | 789 | 161.6 |
| A | 0 | 226 | 6867 | 37.61 | 804 | 789 | 161.6 |
| B | 3 | 64 | 122099 | 781.08 | 811 | 792 | 155.3 |
| B | 0 | 189 | 41619 | 262.88 | 811 | 792 | 155.3 |
| B | 12 | 111 | 19230 | 118.72 | 811 | 792 | 155.3 |
| C | 14 | 238 | 123931 | 675.55 | 774 | 780 | 182.3 |
| C | 7 | 247 | 18435 | 96.85 | 774 | 780 | 182.3 |
| C | 12 | 2 | 7247 | 35.48 | 774 | 780 | 182.3 |
| D | 1 | 52 | 623590 | 3323.42 | 771 | 749 | 187.4 |
| D | 9 | 85 | 49123 | 258.12 | 771 | 749 | 187.4 |
| D | 2 | 234 | 26524 | 137.53 | 771 | 749 | 187.4 |
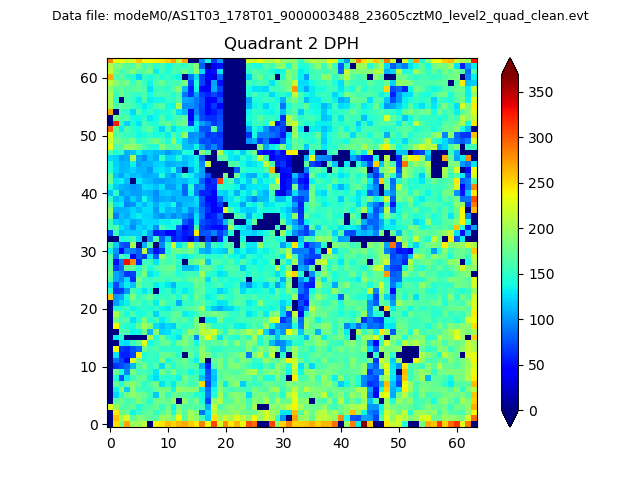
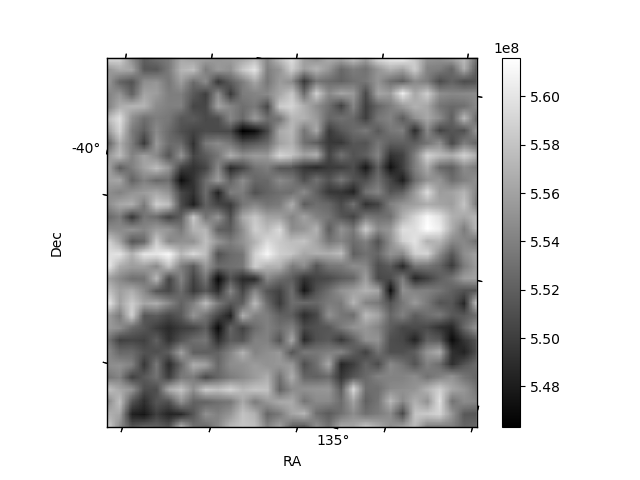
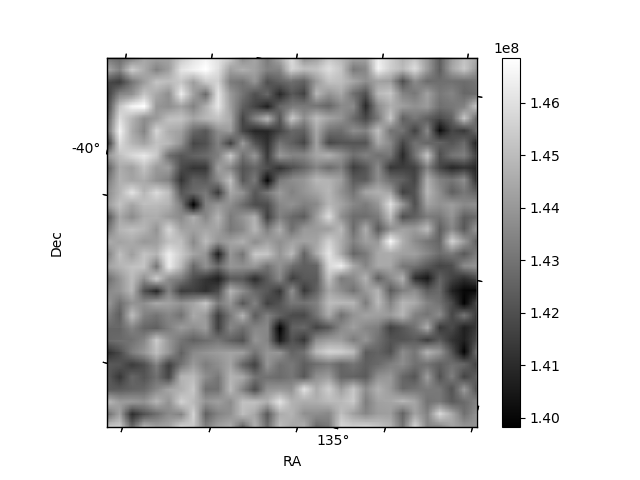
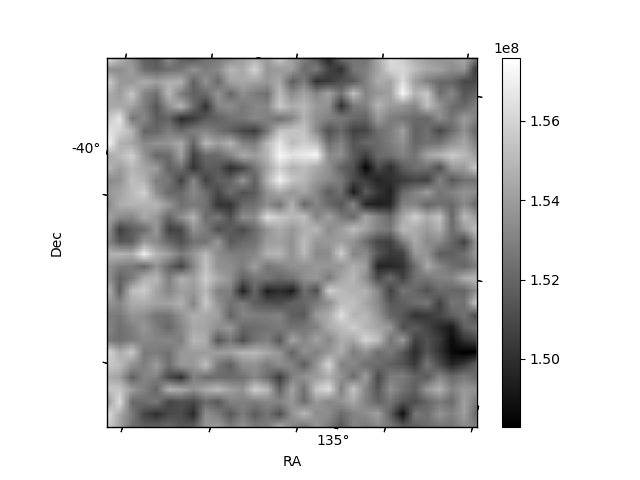
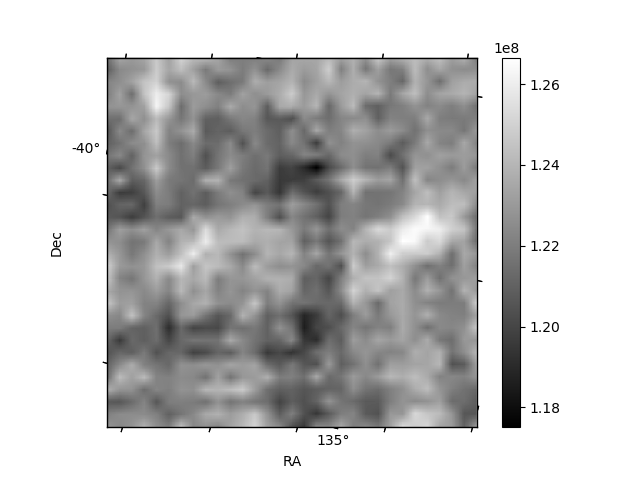
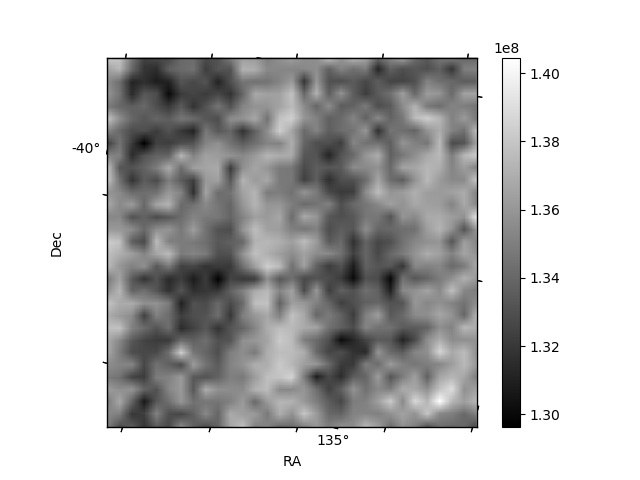
Histogram calculated using DETX and DETY for each event in the final _common_clean file
| Quadrant A | 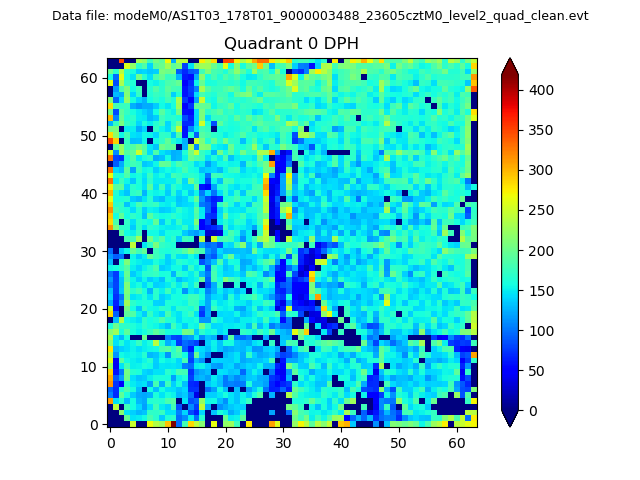 |
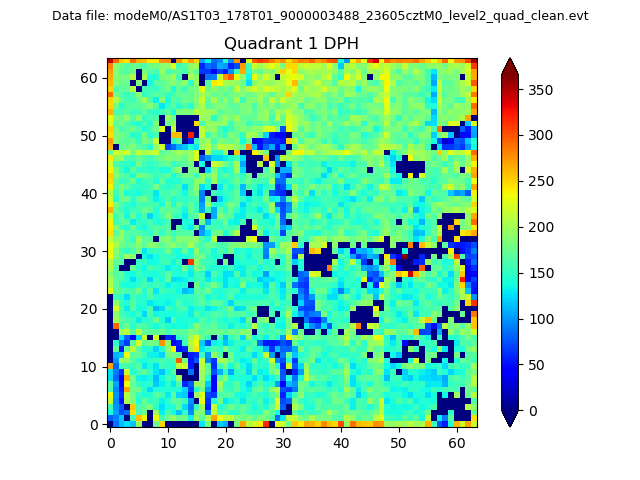 |
Quadrant B |
|---|---|---|---|
| Quadrant D | 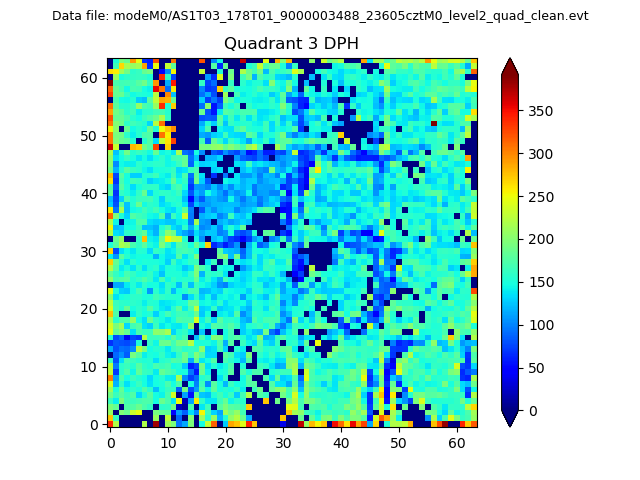 |
 |
Quadrant C |
| Plot type | Count rate plots | Images |
|---|---|---|
| Comparison with Poisson distribution Blue bars denote a histogram of data divided into 1 sec bins. Red curve is a Poisson curve with rate = median count rate of data. |
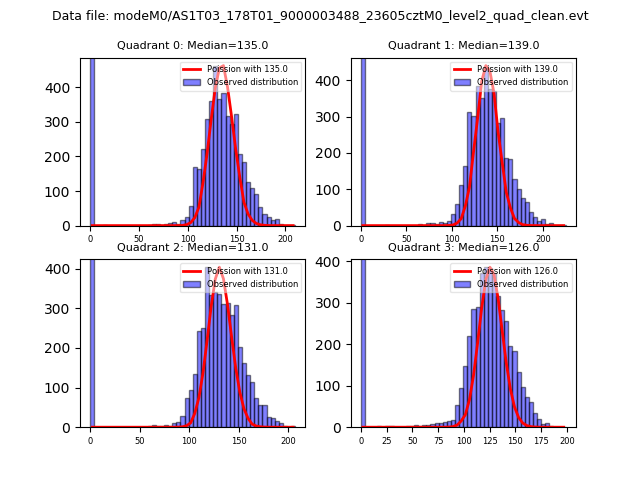 |
 |
| Quadrant-wise count rates Data is divided into 100 sec bins |
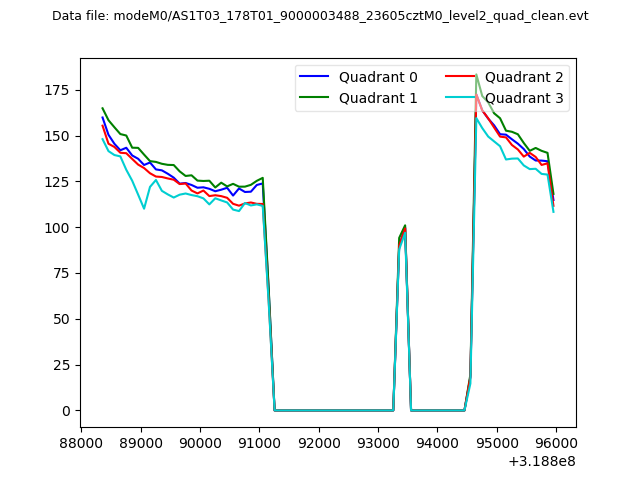 |
|
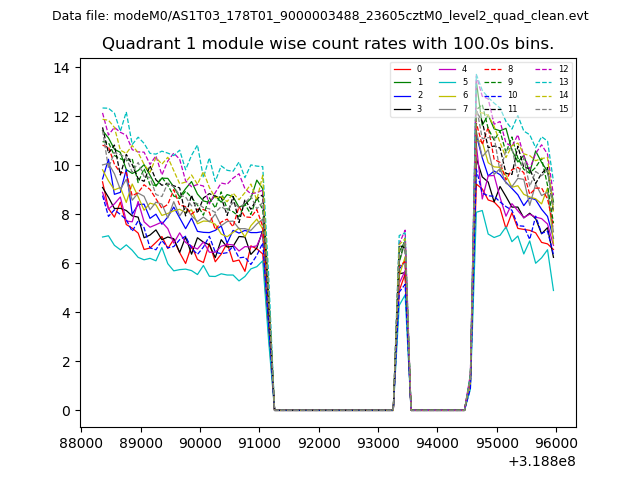
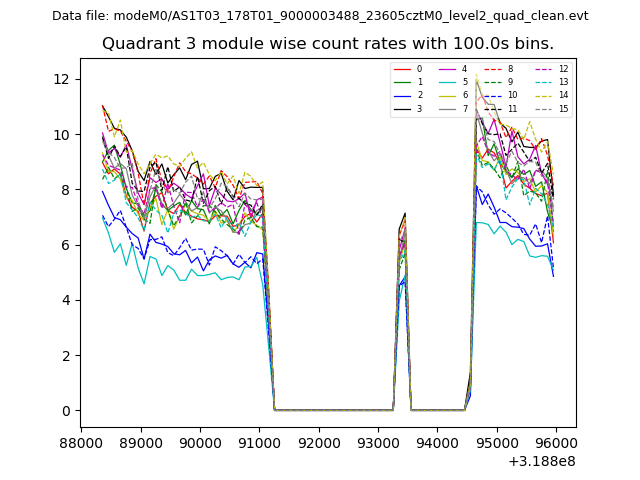
| Module-wise count rates for Quadrant A Data is divided into 100 sec bins |
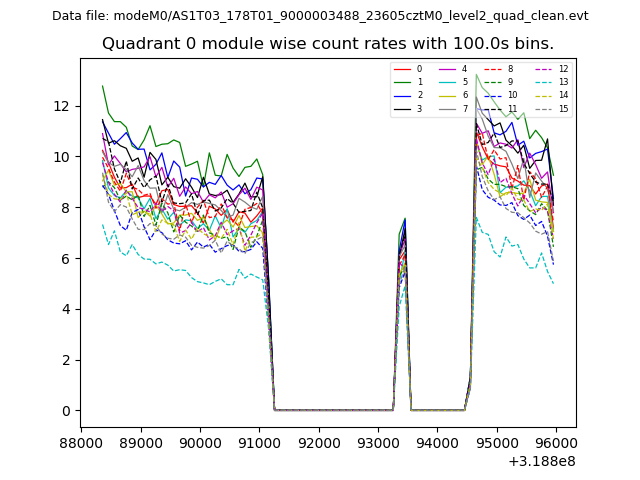 |
 |
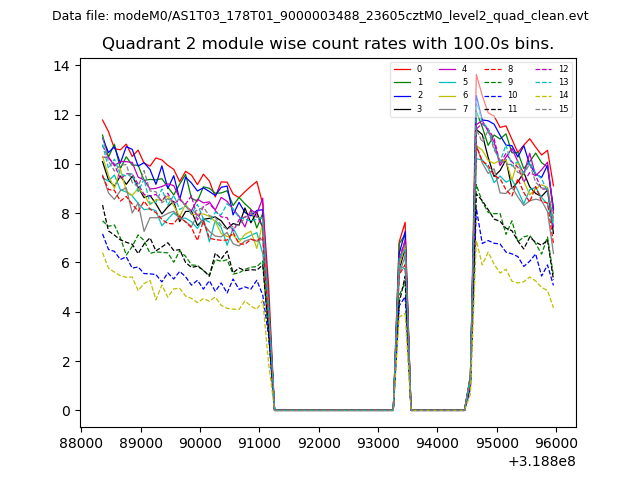
| Module-wise count rates for Quadrant B Data is divided into 100 sec bins |
 |
 |
| Module-wise count rates for Quadrant C Data is divided into 100 sec bins |
 |
 |
| Module-wise count rates for Quadrant D Data is divided into 100 sec bins |
 |
 |
| Parameter | Plot |
|---|---|
| CZT HV Monitor | 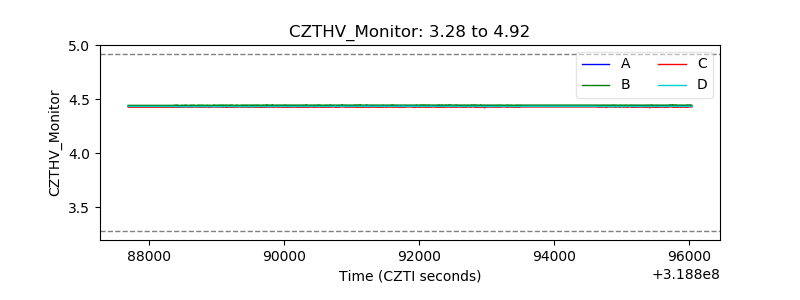 |
| D_VDD | 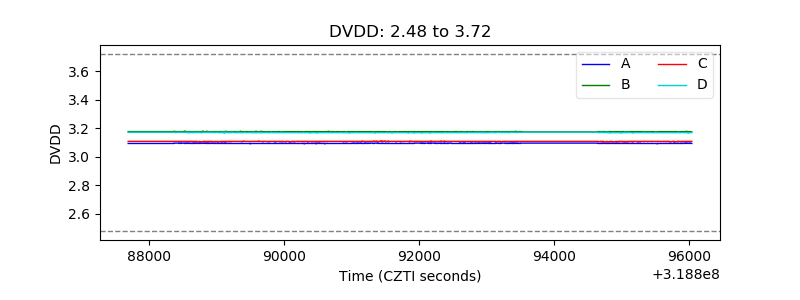 |
| Temperature 1 | 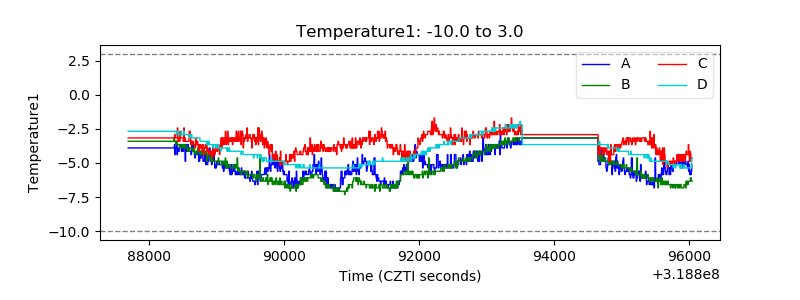 |
| Veto HV Monitor | 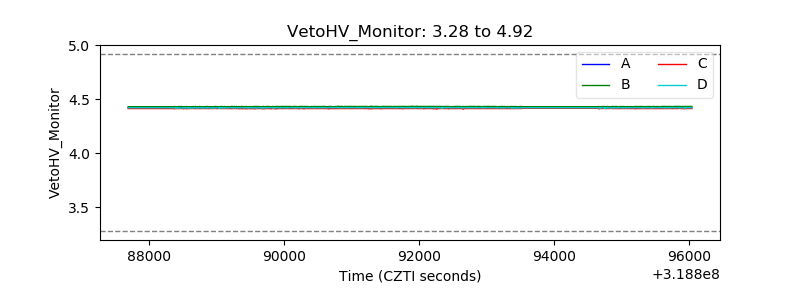 |
| Veto LLD | 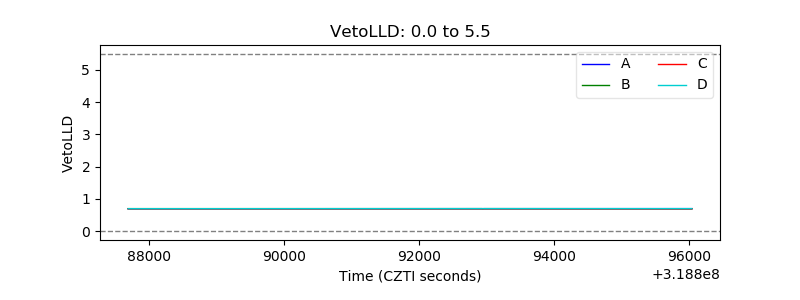 |
| Alpha Counter | 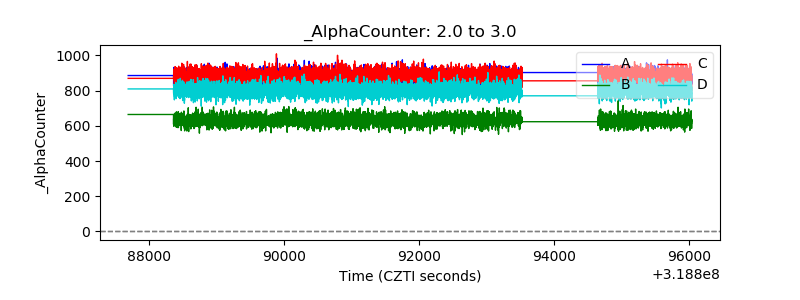 |
| _CPM_Rate | 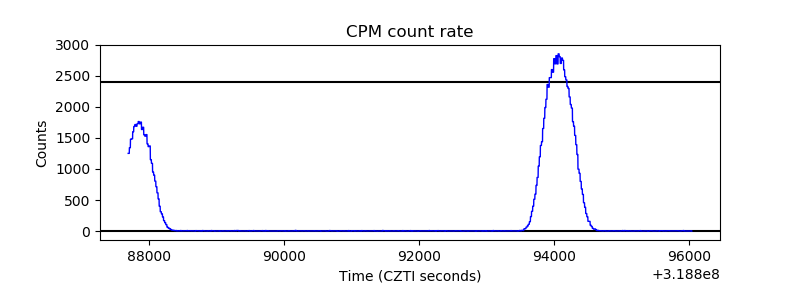 |
| CZT Counter | 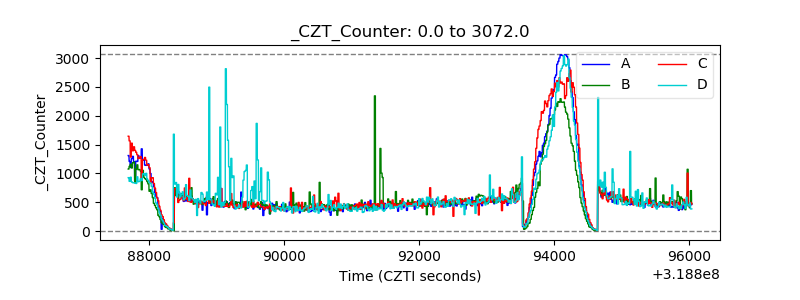 |
| +2.5 Volts monitor |  |
| +5 Volts monitor |  |
| _ROLL_ROT | 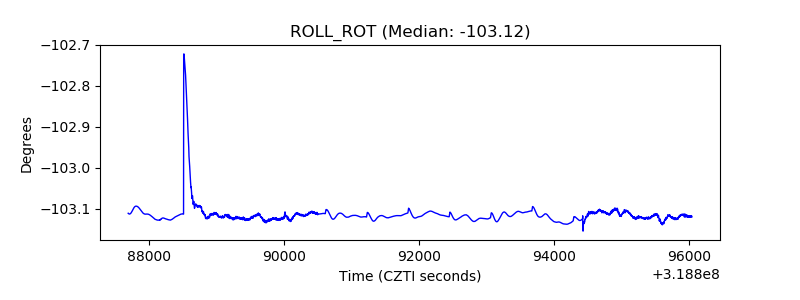 |
| _Roll_DEC | 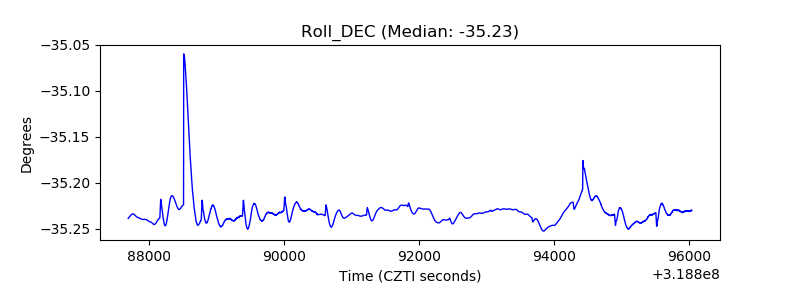 |
| _Roll_RA | 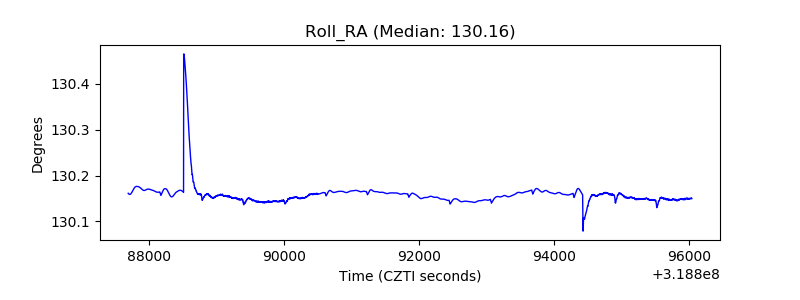 |
| Veto Counter | 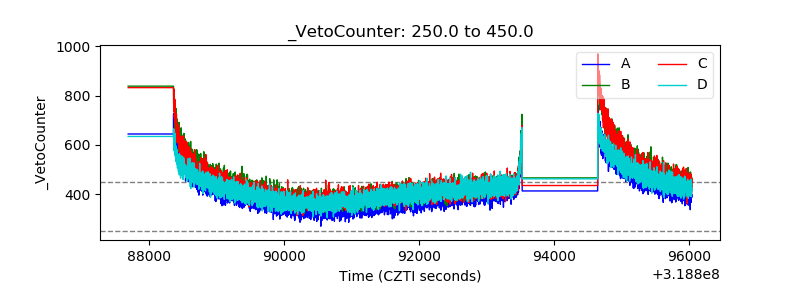 |