| Param | Original file | Final file |
|---|---|---|
| Filename | modeM0/AS1T03_178T01_9000003488_23606cztM0_level2.evt | modeM0/AS1T03_178T01_9000003488_23606cztM0_level2_quad_clean.evt |
| Size (bytes) | 469,272,960 | 96,192,000 |
| Size | 447.5 MB | 91.7 MB |
| Events in quadrant A | 3,154,466 | 621,187 |
| Events in quadrant B | 3,637,711 | 645,750 |
| Events in quadrant C | 3,289,752 | 614,977 |
| Events in quadrant D | 3,693,494 | 582,888 |
| Mode M0 | |||
|---|---|---|---|
| Quadrant | BADHDUFLAG | Total packets | Discarded packets |
| A | 0 | 13432 | 2 |
| B | 0 | 14792 | 3 |
| C | 0 | 13588 | 2 |
| D | 0 | 15173 | 2 |
| Mode M9 | |||
|---|---|---|---|
| Quadrant | BADHDUFLAG | Total packets | Discarded packets |
| A | 0 | 23 | 0 |
| B | 0 | 23 | 0 |
| C | 0 | 23 | 0 |
| D | 0 | 23 | 0 |
| Mode SS | |||
|---|---|---|---|
| Quadrant | BADHDUFLAG | Total packets | Discarded packets |
| A | 0 | 134 | 0 |
| B | 0 | 134 | 0 |
| C | 0 | 134 | 0 |
| D | 0 | 134 | 0 |
| Quadrant | Total seconds | Saturated seconds | Saturation percentage |
|---|---|---|---|
| A | 6423 | 44 | 0.685038% |
| B | 6422 | 131 | 2.039863% |
| C | 6422 | 76 | 1.183432% |
| D | 6422 | 112 | 1.744005% |
Noise dominated data is calculated using 1-second bins in cleaned event files. If a bin has >2000 counts, and if more than 50% of those come from <1% of pixels, then it is considered to be noise-dominated and hence unusable.
| Quadrant | # 1 sec bins | Bins with >0 counts | Bins with >2000 counts | High rate bins dominated by noise | Noise dominated (total time) | Noise dominated (detector-on time) | Marked lightcurve |
|---|---|---|---|---|---|---|---|
| A | 8738 | 6424 | 0 | 0 | 0.00% | 0.00% | 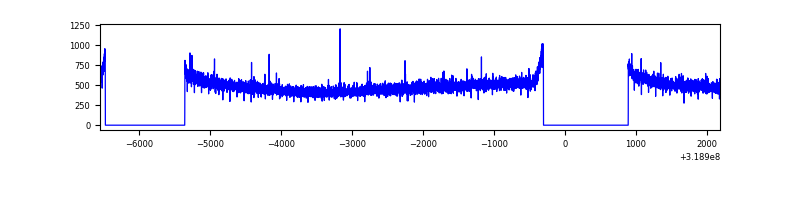 |
| B | 8737 | 6423 | 62 | 62 | 0.71% | 0.97% | 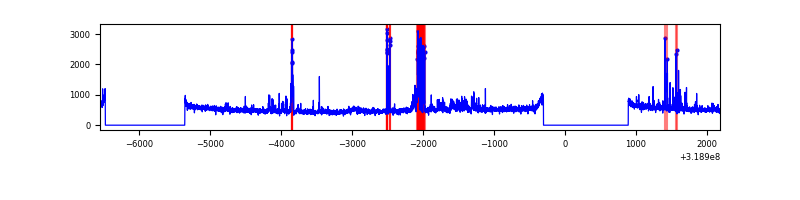 |
| C | 8737 | 6422 | 5 | 5 | 0.06% | 0.08% | 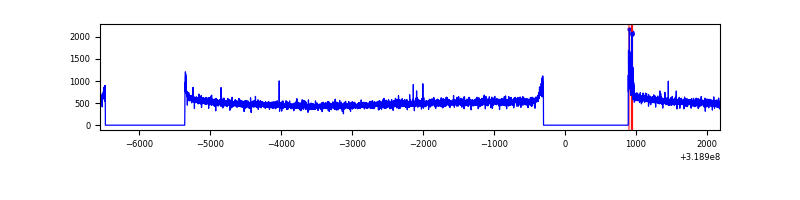 |
| D | 8737 | 6423 | 79 | 79 | 0.90% | 1.23% | 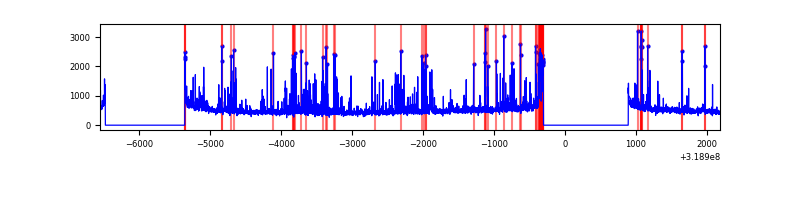 |
Top three noisy pixels from each quadrant. If the there are fewer than three noisy pixels in the level2.evt file, extra rows are filled as -1
| Pixel properties | Quadrant properties | ||||||
|---|---|---|---|---|---|---|---|
| Quadrant | DetID | PixID | Counts | Sigma | Mean | Median | Sigma |
| A | 13 | 254 | 10134 | 56.83 | 818 | 802 | 164.2 |
| A | 3 | 137 | 7142 | 38.61 | 818 | 802 | 164.2 |
| A | 0 | 226 | 6971 | 37.57 | 818 | 802 | 164.2 |
| B | 3 | 64 | 340253 | 2169.19 | 825 | 805 | 156.5 |
| B | 14 | 207 | 32832 | 204.66 | 825 | 805 | 156.5 |
| B | 0 | 189 | 31029 | 193.14 | 825 | 805 | 156.5 |
| C | 14 | 238 | 126662 | 676.61 | 797 | 805 | 186.0 |
| C | 0 | 10 | 45055 | 237.89 | 797 | 805 | 186.0 |
| C | 13 | 61 | 5554 | 25.53 | 797 | 805 | 186.0 |
| D | 1 | 52 | 671546 | 3527.19 | 787 | 767 | 190.2 |
| D | 9 | 85 | 32779 | 168.33 | 787 | 767 | 190.2 |
| D | 2 | 234 | 25206 | 128.51 | 787 | 767 | 190.2 |
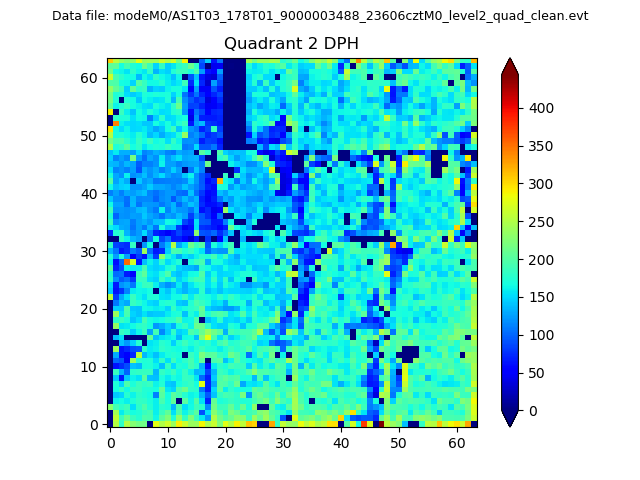
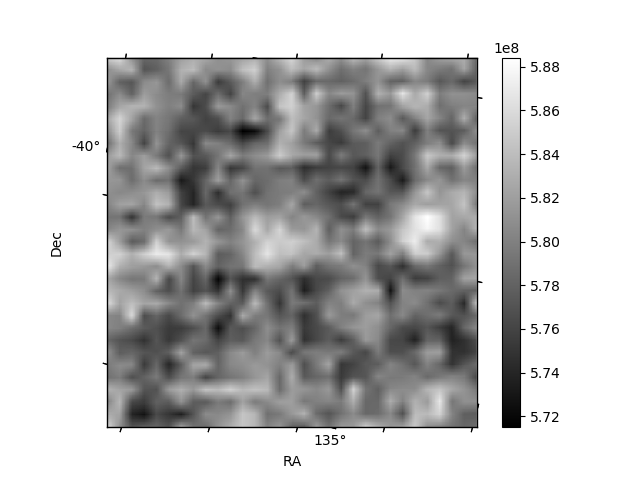
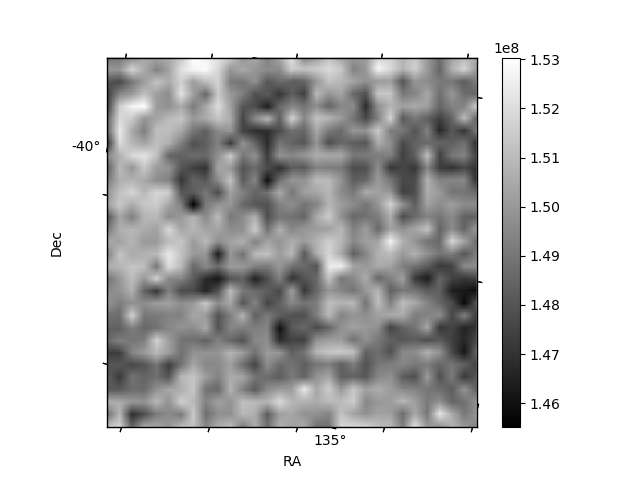
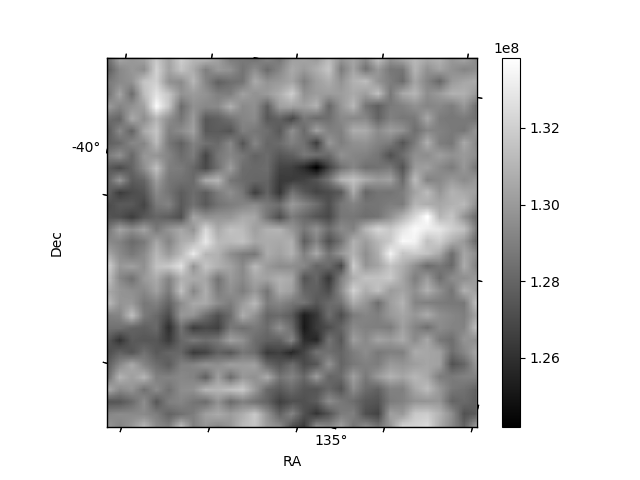
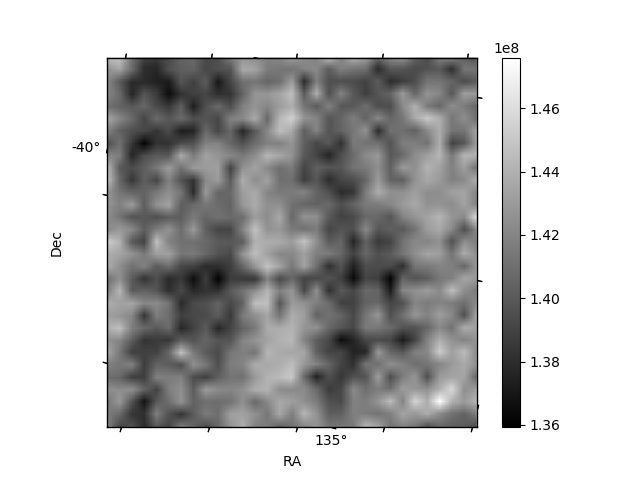
Histogram calculated using DETX and DETY for each event in the final _common_clean file
| Quadrant A | 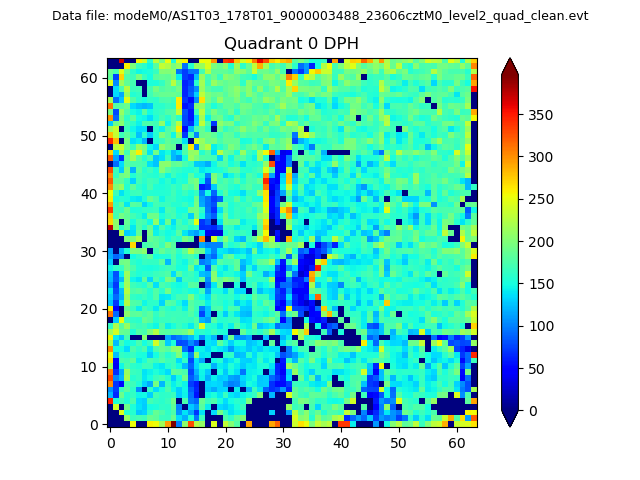 |
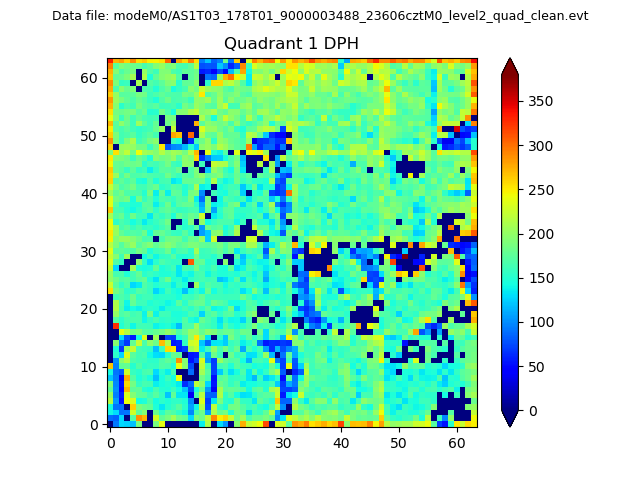 |
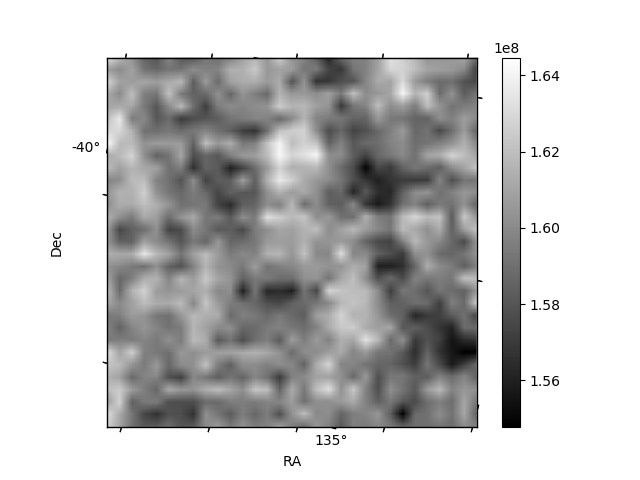
Quadrant B |
|---|---|---|---|
| Quadrant D | 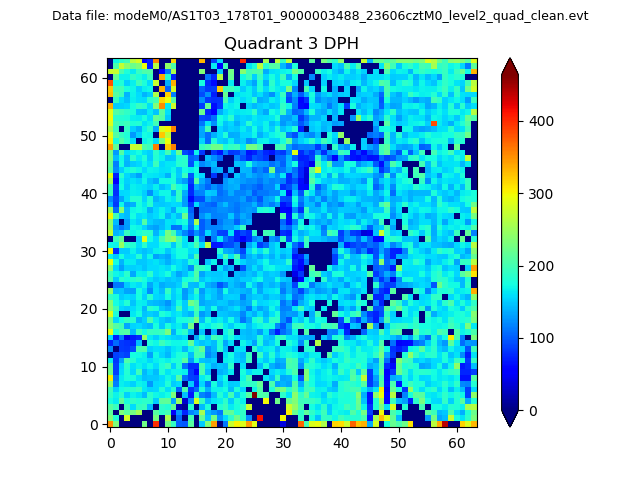 |
 |
Quadrant C |
| Plot type | Count rate plots | Images |
|---|---|---|
| Comparison with Poisson distribution Blue bars denote a histogram of data divided into 1 sec bins. Red curve is a Poisson curve with rate = median count rate of data. |
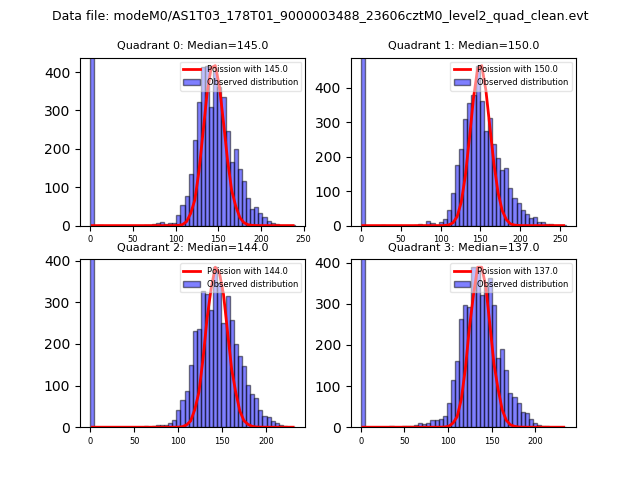 |
 |
| Quadrant-wise count rates Data is divided into 100 sec bins |
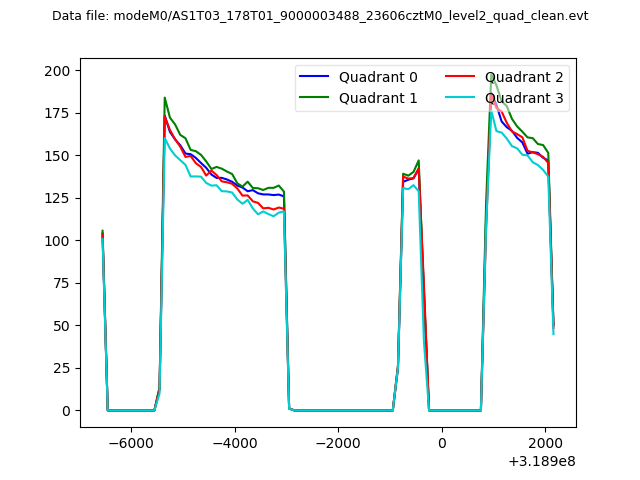 |
|
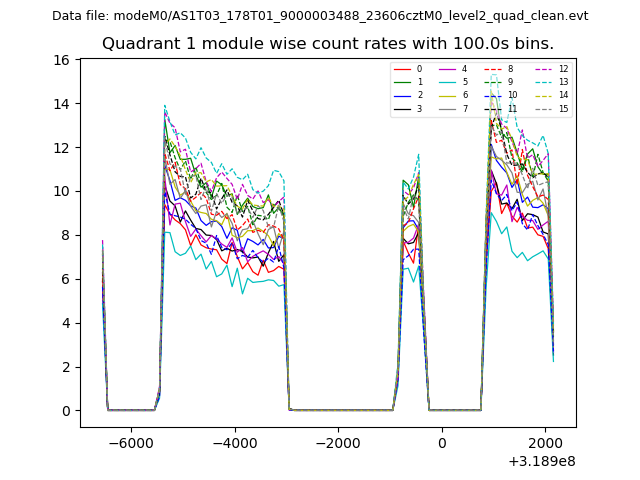
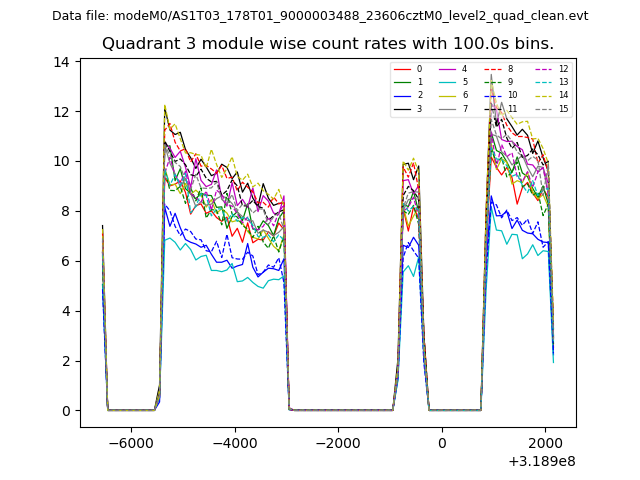
| Module-wise count rates for Quadrant A Data is divided into 100 sec bins |
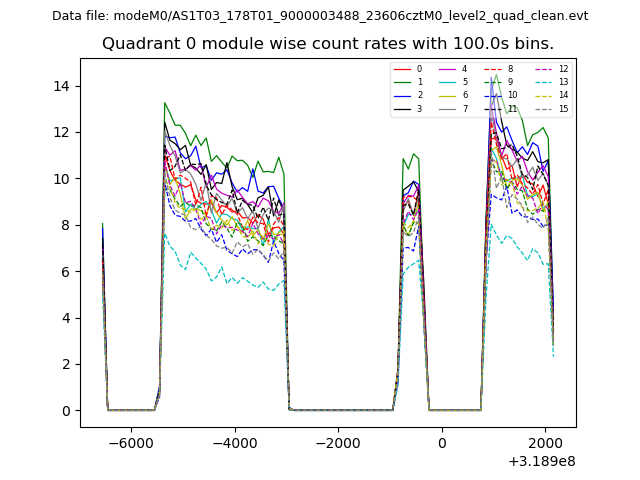 |
 |
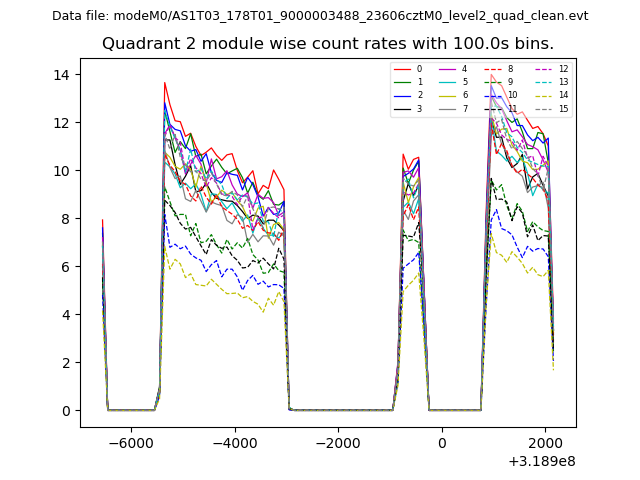
| Module-wise count rates for Quadrant B Data is divided into 100 sec bins |
 |
 |
| Module-wise count rates for Quadrant C Data is divided into 100 sec bins |
 |
 |
| Module-wise count rates for Quadrant D Data is divided into 100 sec bins |
 |
 |
| Parameter | Plot |
|---|---|
| CZT HV Monitor | 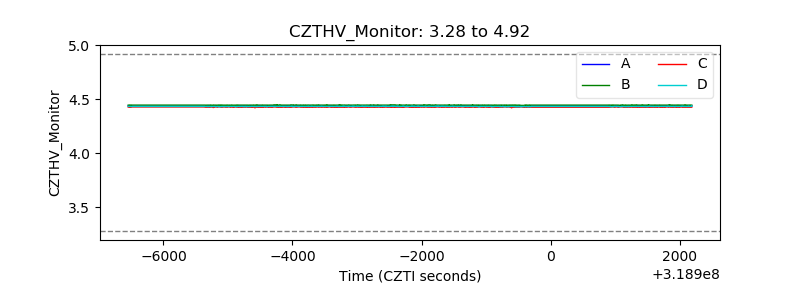 |
| D_VDD | 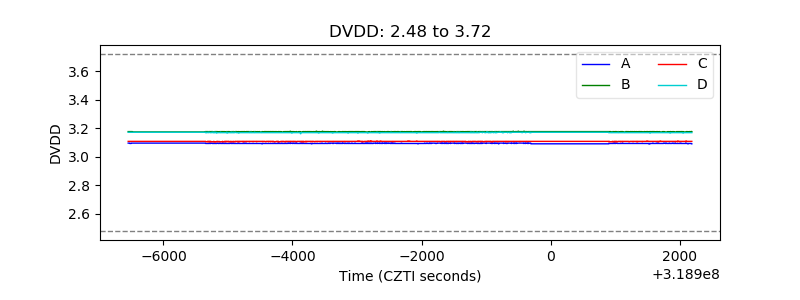 |
| Temperature 1 | 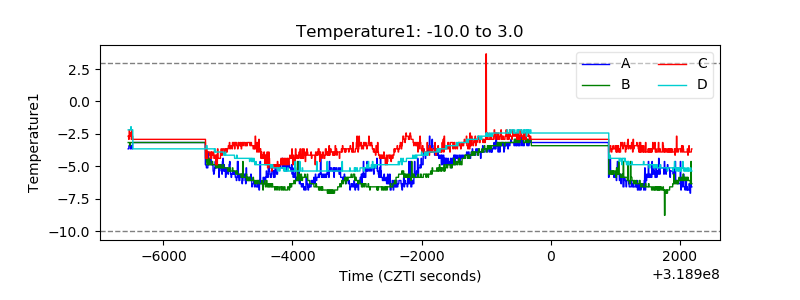 |
| Veto HV Monitor | 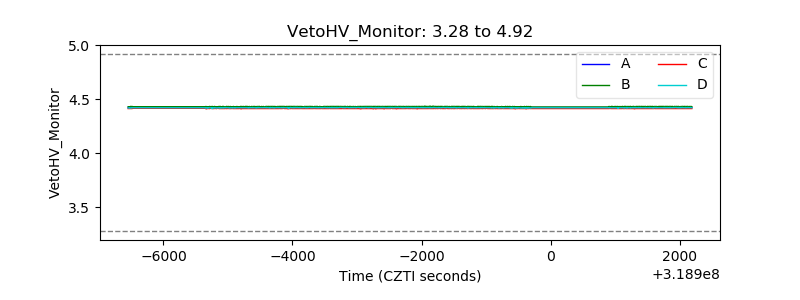 |
| Veto LLD | 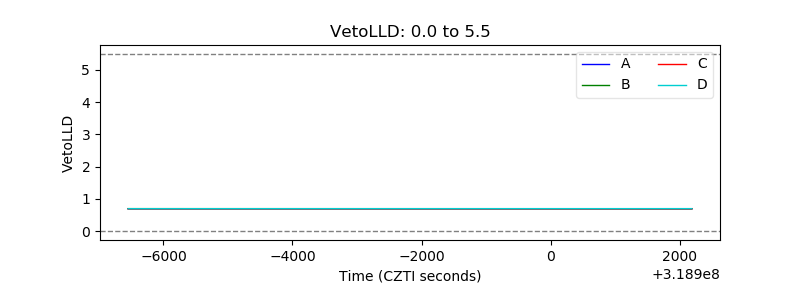 |
| Alpha Counter |  |
| _CPM_Rate | 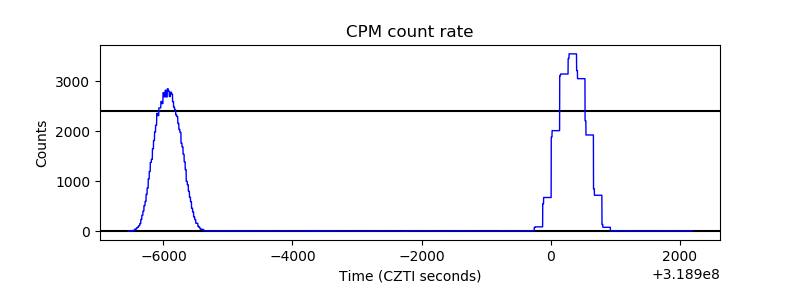 |
| CZT Counter | 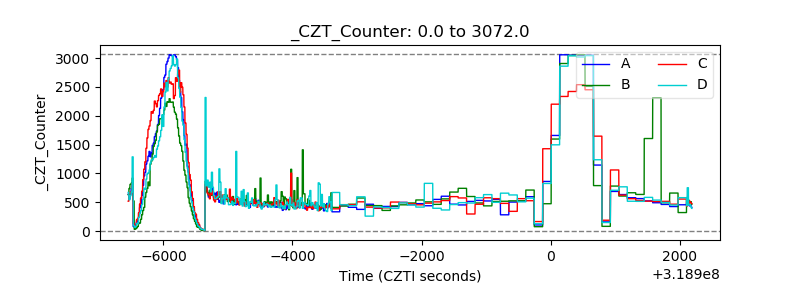 |
| +2.5 Volts monitor |  |
| +5 Volts monitor |  |
| _ROLL_ROT | 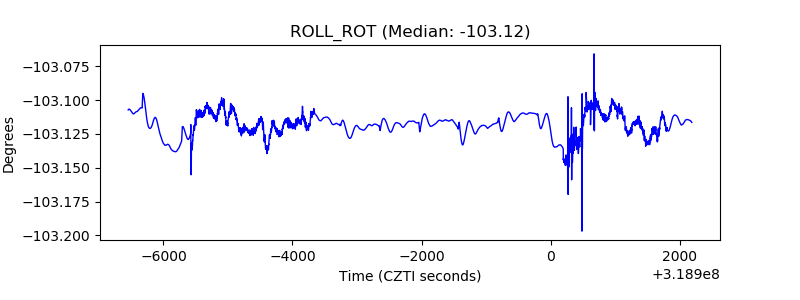 |
| _Roll_DEC | 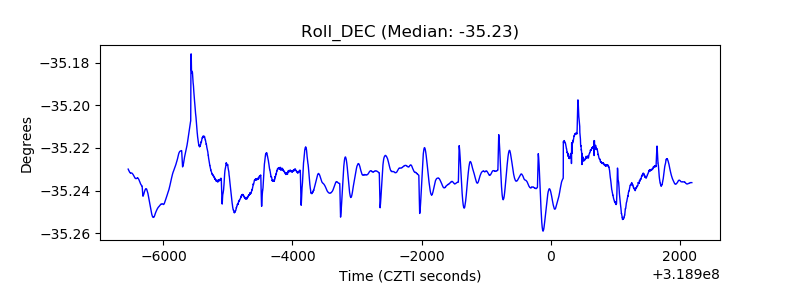 |
| _Roll_RA | 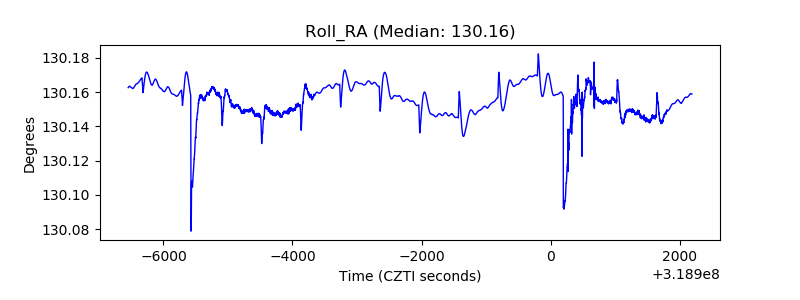 |
| Veto Counter | 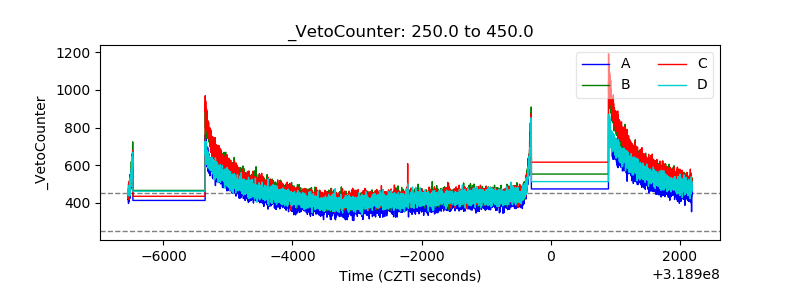 |