| Param | Original file | Final file |
|---|---|---|
| Filename | modeM0/AS1T03_178T01_9000003488_23607cztM0_level2.evt | modeM0/AS1T03_178T01_9000003488_23607cztM0_level2_quad_clean.evt |
| Size (bytes) | 501,465,600 | 100,235,520 |
| Size | 478.2 MB | 95.6 MB |
| Events in quadrant A | 3,190,529 | 648,913 |
| Events in quadrant B | 4,482,489 | 680,014 |
| Events in quadrant C | 3,518,501 | 644,685 |
| Events in quadrant D | 3,565,405 | 619,899 |
| Mode M0 | |||
|---|---|---|---|
| Quadrant | BADHDUFLAG | Total packets | Discarded packets |
| A | 0 | 13254 | 2 |
| B | 0 | 17206 | 2 |
| C | 0 | 14175 | 2 |
| D | 0 | 14623 | 2 |
| Mode M9 | |||
|---|---|---|---|
| Quadrant | BADHDUFLAG | Total packets | Discarded packets |
| A | 0 | 21 | 0 |
| B | 0 | 22 | 0 |
| C | 0 | 22 | 0 |
| D | 0 | 22 | 0 |
| Mode SS | |||
|---|---|---|---|
| Quadrant | BADHDUFLAG | Total packets | Discarded packets |
| A | 0 | 128 | 0 |
| B | 0 | 128 | 0 |
| C | 0 | 128 | 0 |
| D | 0 | 128 | 0 |
| Quadrant | Total seconds | Saturated seconds | Saturation percentage |
|---|---|---|---|
| A | 6338 | 20 | 0.315557% |
| B | 6338 | 482 | 7.604923% |
| C | 6338 | 110 | 1.735563% |
| D | 6338 | 40 | 0.631114% |
Noise dominated data is calculated using 1-second bins in cleaned event files. If a bin has >2000 counts, and if more than 50% of those come from <1% of pixels, then it is considered to be noise-dominated and hence unusable.
| Quadrant | # 1 sec bins | Bins with >0 counts | Bins with >2000 counts | High rate bins dominated by noise | Noise dominated (total time) | Noise dominated (detector-on time) | Marked lightcurve |
|---|---|---|---|---|---|---|---|
| A | 7653 | 6339 | 0 | 0 | 0.00% | 0.00% |  |
| B | 7653 | 6339 | 424 | 424 | 5.54% | 6.69% |  |
| C | 7653 | 6339 | 45 | 45 | 0.59% | 0.71% |  |
| D | 7653 | 6339 | 25 | 25 | 0.33% | 0.39% |  |
Top three noisy pixels from each quadrant. If the there are fewer than three noisy pixels in the level2.evt file, extra rows are filled as -1
| Pixel properties | Quadrant properties | ||||||
|---|---|---|---|---|---|---|---|
| Quadrant | DetID | PixID | Counts | Sigma | Mean | Median | Sigma |
| A | 13 | 254 | 10181 | 57.26 | 826 | 813 | 163.6 |
| A | 0 | 226 | 6922 | 37.34 | 826 | 813 | 163.6 |
| A | 3 | 137 | 6908 | 37.26 | 826 | 813 | 163.6 |
| B | 3 | 64 | 1259941 | 8315.6 | 813 | 795 | 151.4 |
| B | 12 | 111 | 18150 | 114.62 | 813 | 795 | 151.4 |
| B | 0 | 189 | 16743 | 105.32 | 813 | 795 | 151.4 |
| C | 0 | 10 | 148732 | 779.2 | 817 | 825 | 189.8 |
| C | 14 | 238 | 128644 | 673.37 | 817 | 825 | 189.8 |
| C | 10 | 9 | 49824 | 258.13 | 817 | 825 | 189.8 |
| D | 1 | 52 | 497911 | 2552.61 | 810 | 790 | 194.8 |
| D | 2 | 234 | 24472 | 121.6 | 810 | 790 | 194.8 |
| D | 14 | 226 | 7788 | 35.93 | 810 | 790 | 194.8 |
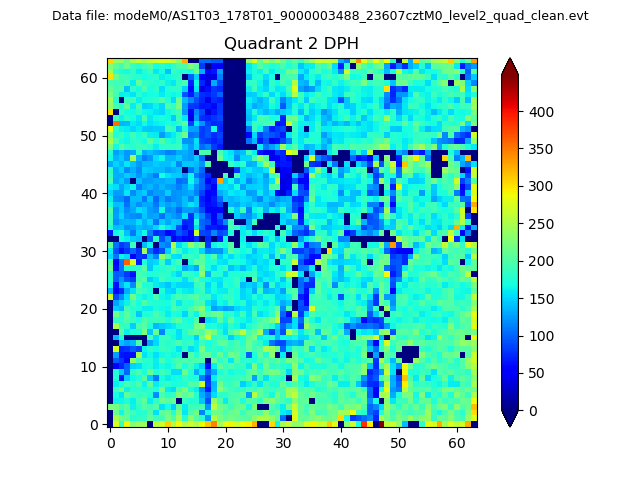
Histogram calculated using DETX and DETY for each event in the final _common_clean file
| Quadrant A | 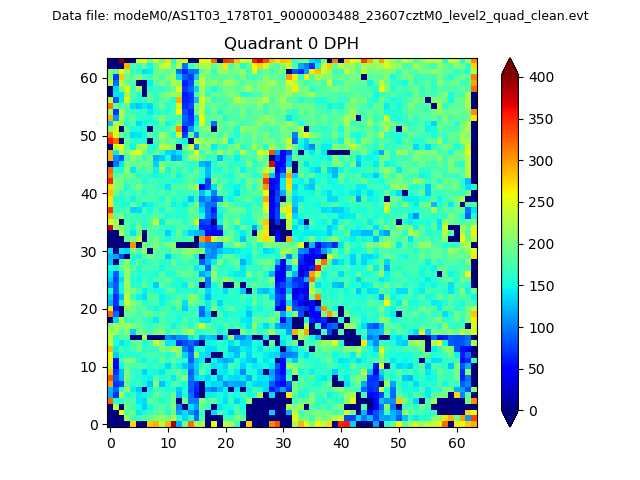 |
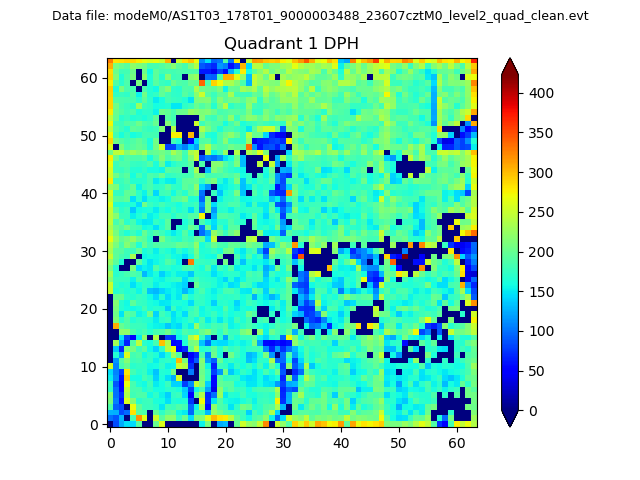 |
Quadrant B |
|---|---|---|---|
| Quadrant D | 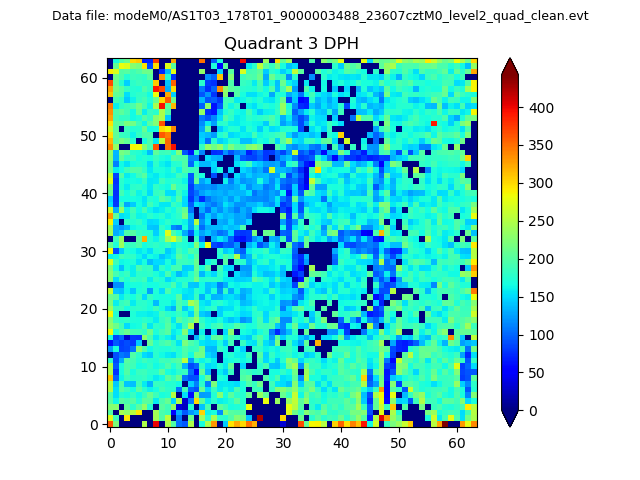 |
 |
Quadrant C |
| Plot type | Count rate plots | Images |
|---|---|---|
| Comparison with Poisson distribution Blue bars denote a histogram of data divided into 1 sec bins. Red curve is a Poisson curve with rate = median count rate of data. |
 |
 |
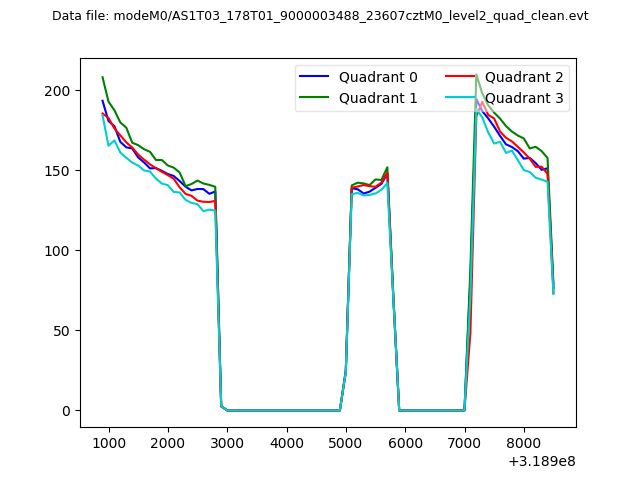
| Quadrant-wise count rates Data is divided into 100 sec bins |
 |
|
| Module-wise count rates for Quadrant A Data is divided into 100 sec bins |
 |
 |
| Module-wise count rates for Quadrant B Data is divided into 100 sec bins |
 |
 |
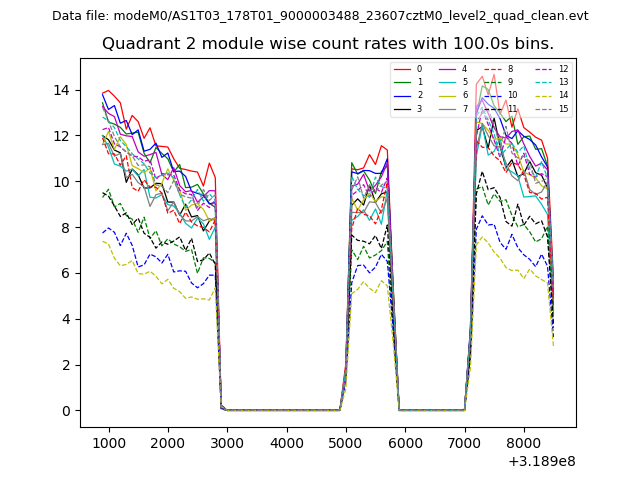
| Module-wise count rates for Quadrant C Data is divided into 100 sec bins |
 |
 |
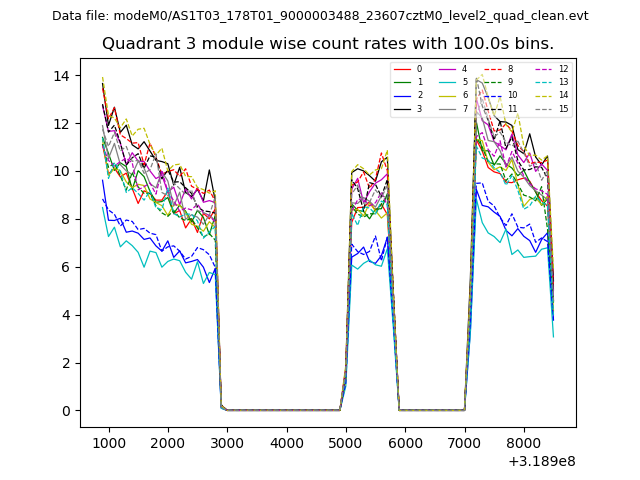
| Module-wise count rates for Quadrant D Data is divided into 100 sec bins |
 |
 |
| Parameter | Plot |
|---|---|
| CZT HV Monitor | 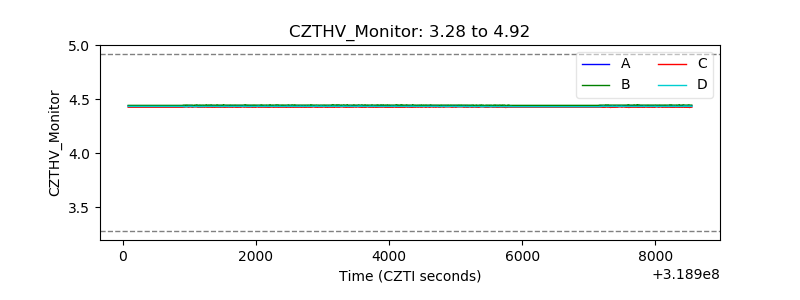 |
| D_VDD | 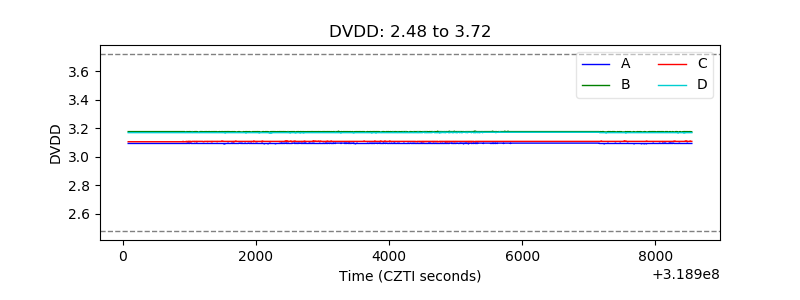 |
| Temperature 1 | 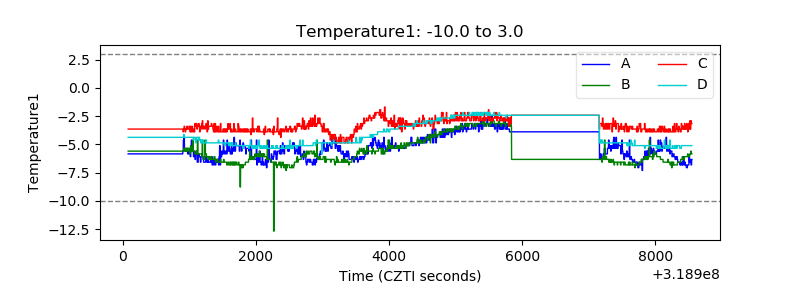 |
| Veto HV Monitor | 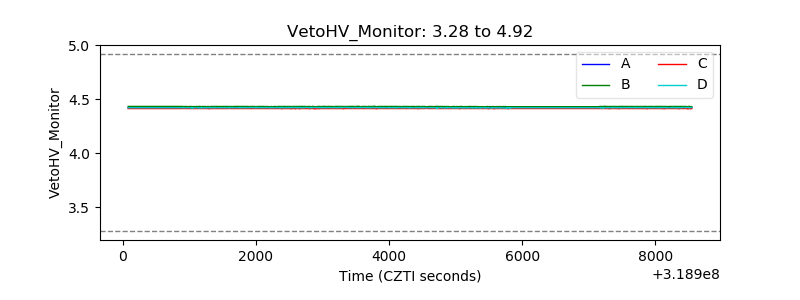 |
| Veto LLD | 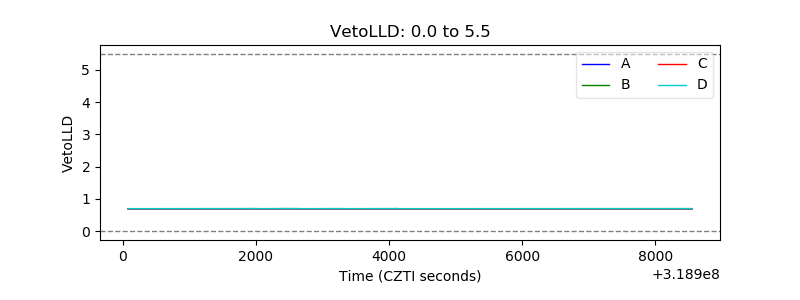 |
| Alpha Counter | 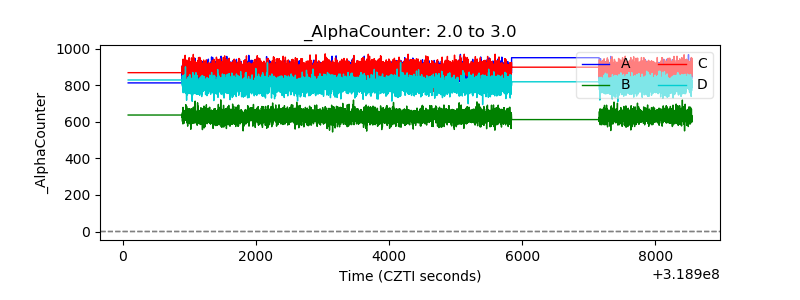 |
| _CPM_Rate | 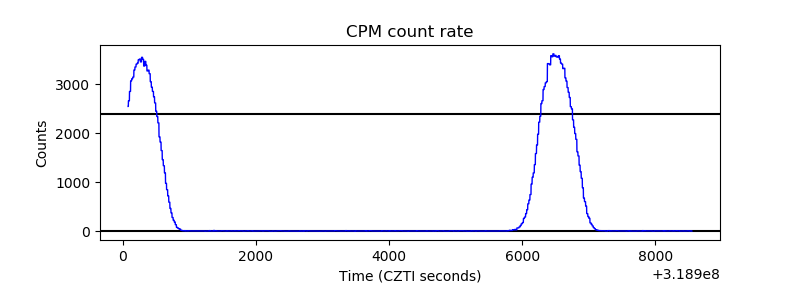 |
| CZT Counter | 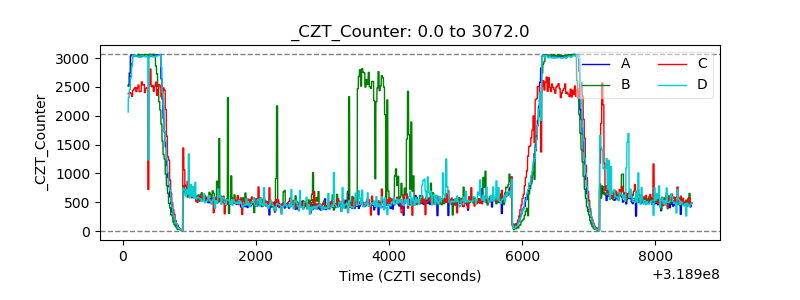 |
| +2.5 Volts monitor |  |
| +5 Volts monitor | 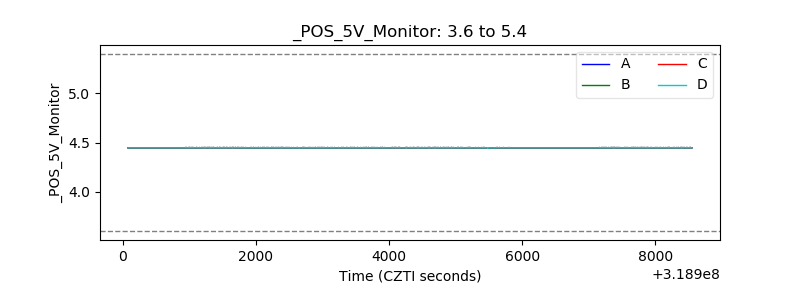 |
| _ROLL_ROT | 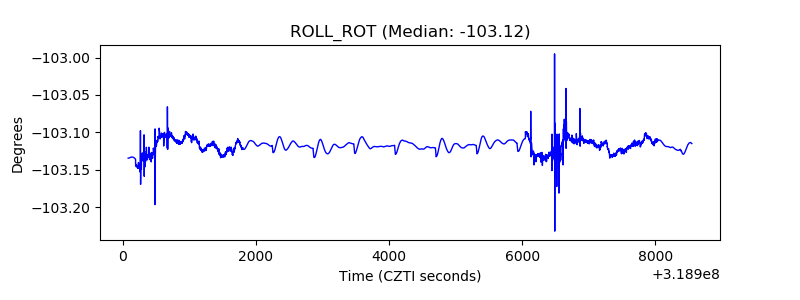 |
| _Roll_DEC |  |
| _Roll_RA | 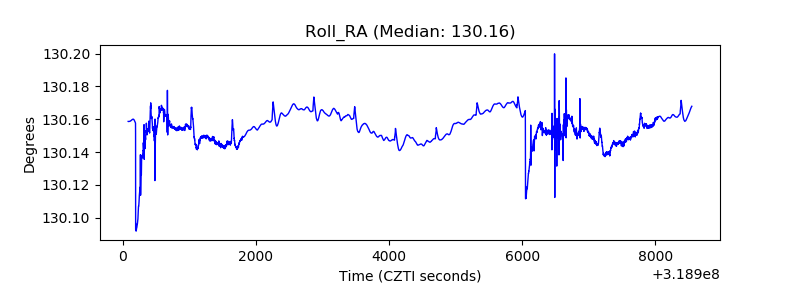 |
| Veto Counter |  |