| Param | Original file | Final file |
|---|---|---|
| Filename | modeM0/AS1T03_178T01_9000003488_23608cztM0_level2.evt | modeM0/AS1T03_178T01_9000003488_23608cztM0_level2_quad_clean.evt |
| Size (bytes) | 502,536,960 | 97,632,000 |
| Size | 479.3 MB | 93.1 MB |
| Events in quadrant A | 3,257,168 | 629,712 |
| Events in quadrant B | 3,495,810 | 662,194 |
| Events in quadrant C | 3,966,176 | 626,059 |
| Events in quadrant D | 4,071,329 | 597,471 |
| Mode M0 | |||
|---|---|---|---|
| Quadrant | BADHDUFLAG | Total packets | Discarded packets |
| A | 0 | 13293 | 2 |
| B | 0 | 14066 | 2 |
| C | 0 | 15948 | 2 |
| D | 0 | 16159 | 2 |
| Mode M9 | |||
|---|---|---|---|
| Quadrant | BADHDUFLAG | Total packets | Discarded packets |
| A | 0 | 19 | 0 |
| B | 0 | 20 | 0 |
| C | 0 | 20 | 0 |
| D | 0 | 20 | 0 |
| Mode SS | |||
|---|---|---|---|
| Quadrant | BADHDUFLAG | Total packets | Discarded packets |
| A | 0 | 128 | 0 |
| B | 0 | 128 | 0 |
| C | 0 | 128 | 0 |
| D | 0 | 128 | 0 |
| Quadrant | Total seconds | Saturated seconds | Saturation percentage |
|---|---|---|---|
| A | 6325 | 16 | 0.252964% |
| B | 6325 | 69 | 1.090909% |
| C | 6325 | 138 | 2.181818% |
| D | 6325 | 134 | 2.118577% |
Noise dominated data is calculated using 1-second bins in cleaned event files. If a bin has >2000 counts, and if more than 50% of those come from <1% of pixels, then it is considered to be noise-dominated and hence unusable.
| Quadrant | # 1 sec bins | Bins with >0 counts | Bins with >2000 counts | High rate bins dominated by noise | Noise dominated (total time) | Noise dominated (detector-on time) | Marked lightcurve |
|---|---|---|---|---|---|---|---|
| A | 7655 | 6326 | 0 | 0 | 0.00% | 0.00% | 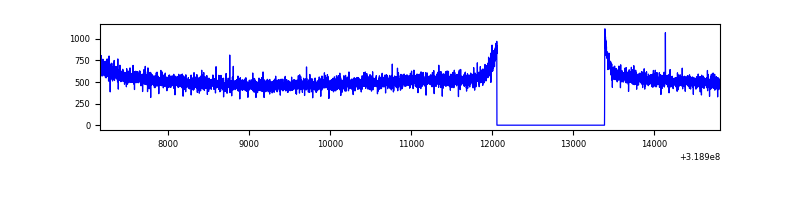 |
| B | 7655 | 6325 | 12 | 12 | 0.16% | 0.19% | 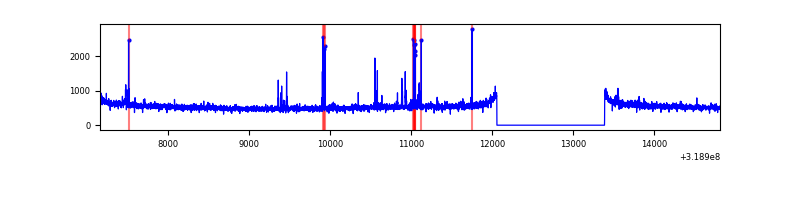 |
| C | 7655 | 6326 | 41 | 41 | 0.54% | 0.65% | 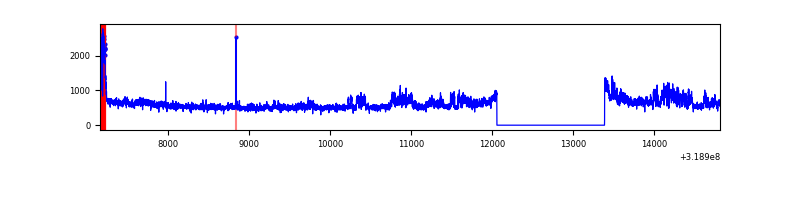 |
| D | 7655 | 6326 | 81 | 81 | 1.06% | 1.28% | 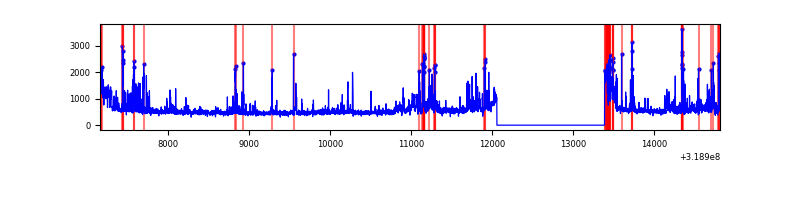 |
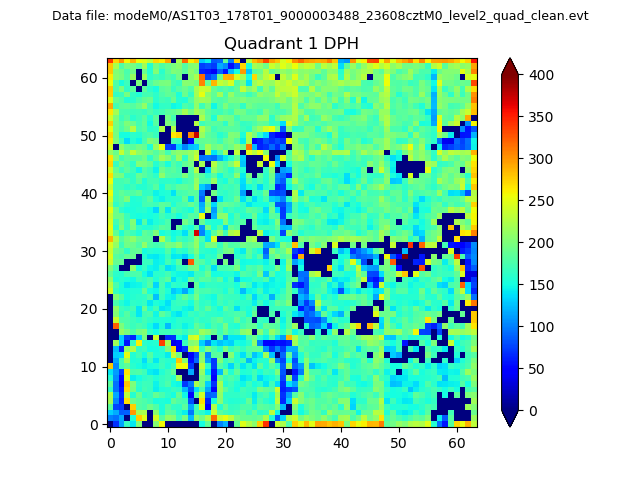
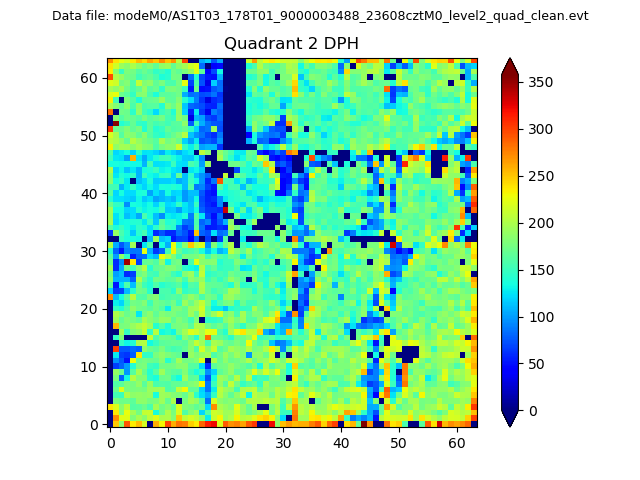
Top three noisy pixels from each quadrant. If the there are fewer than three noisy pixels in the level2.evt file, extra rows are filled as -1
| Pixel properties | Quadrant properties | ||||||
|---|---|---|---|---|---|---|---|
| Quadrant | DetID | PixID | Counts | Sigma | Mean | Median | Sigma |
| A | 13 | 254 | 10461 | 57.19 | 845 | 828 | 168.4 |
| A | 0 | 226 | 7198 | 37.82 | 845 | 828 | 168.4 |
| A | 3 | 137 | 6898 | 36.04 | 845 | 828 | 168.4 |
| B | 3 | 64 | 99225 | 621.73 | 857 | 836 | 158.3 |
| B | 12 | 111 | 19088 | 115.34 | 857 | 836 | 158.3 |
| B | 11 | 111 | 16779 | 100.75 | 857 | 836 | 158.3 |
| C | 10 | 9 | 430379 | 2207.62 | 838 | 847 | 194.6 |
| C | 14 | 238 | 133357 | 681.05 | 838 | 847 | 194.6 |
| C | 0 | 10 | 116683 | 595.35 | 838 | 847 | 194.6 |
| D | 1 | 52 | 928895 | 4621.83 | 830 | 809 | 200.8 |
| D | 2 | 234 | 25210 | 121.52 | 830 | 809 | 200.8 |
| D | 9 | 85 | 9017 | 40.88 | 830 | 809 | 200.8 |
Histogram calculated using DETX and DETY for each event in the final _common_clean file
| Quadrant A | 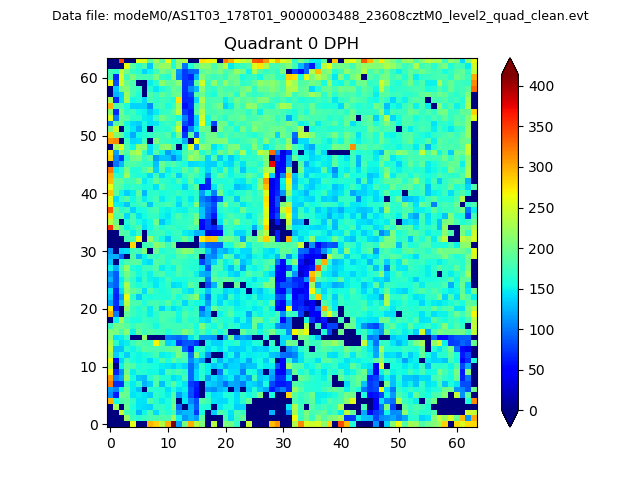 |
 |
Quadrant B |
|---|---|---|---|
| Quadrant D | 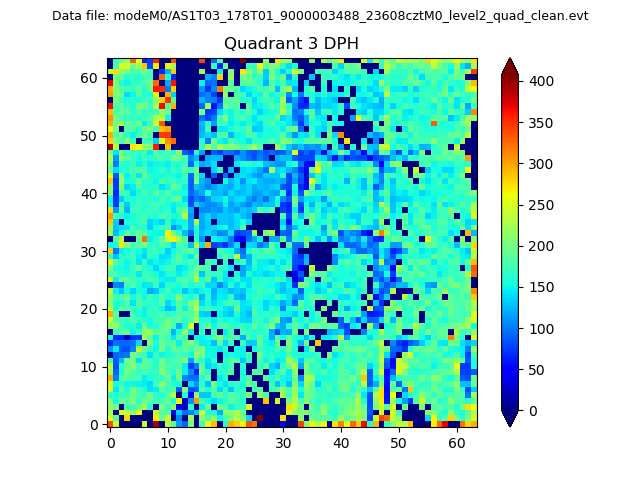 |
 |
Quadrant C |
| Plot type | Count rate plots | Images |
|---|---|---|
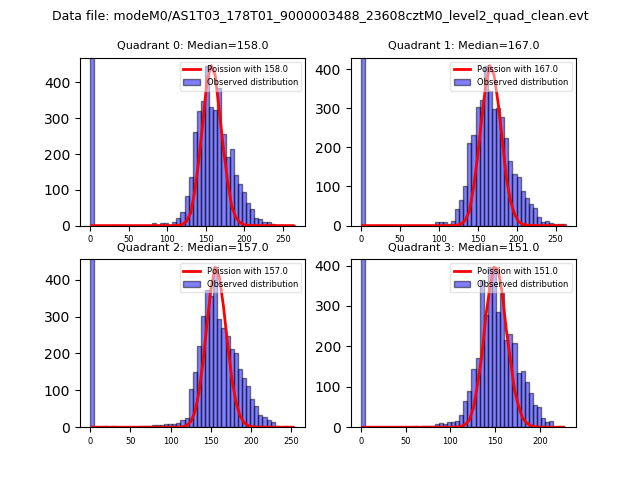
| Comparison with Poisson distribution Blue bars denote a histogram of data divided into 1 sec bins. Red curve is a Poisson curve with rate = median count rate of data. |
 |
 |
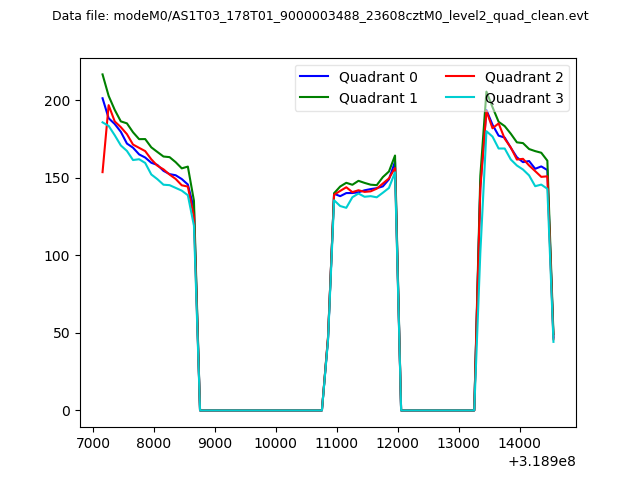
| Quadrant-wise count rates Data is divided into 100 sec bins |
 |
|
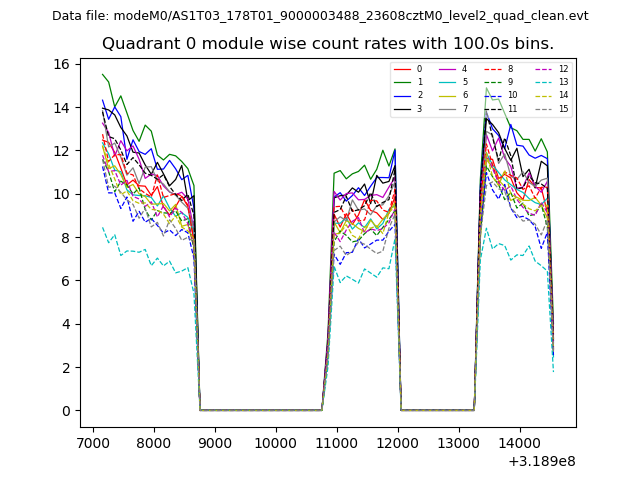
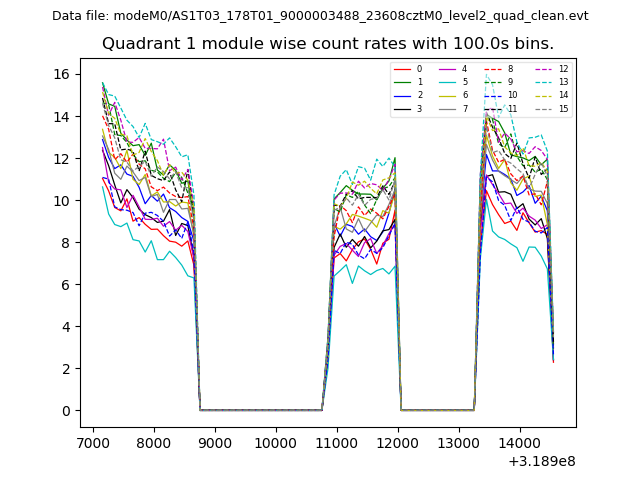
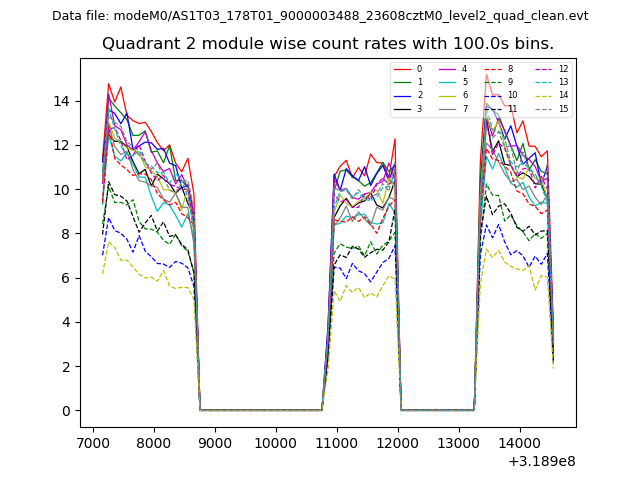
| Module-wise count rates for Quadrant A Data is divided into 100 sec bins |
 |
 |
| Module-wise count rates for Quadrant B Data is divided into 100 sec bins |
 |
 |
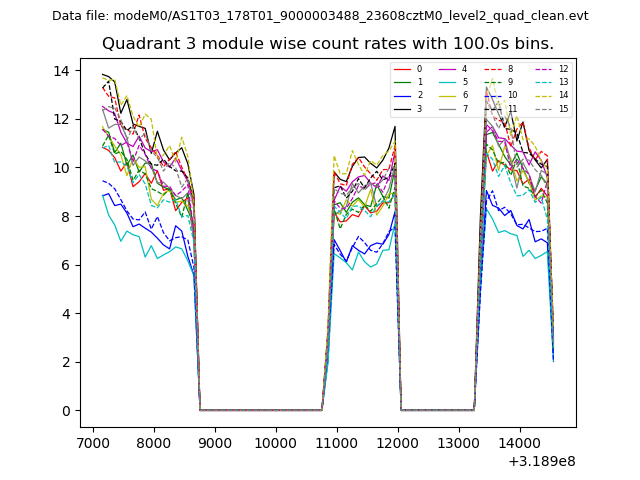
| Module-wise count rates for Quadrant C Data is divided into 100 sec bins |
 |
 |
| Module-wise count rates for Quadrant D Data is divided into 100 sec bins |
 |
 |
| Parameter | Plot |
|---|---|
| CZT HV Monitor | 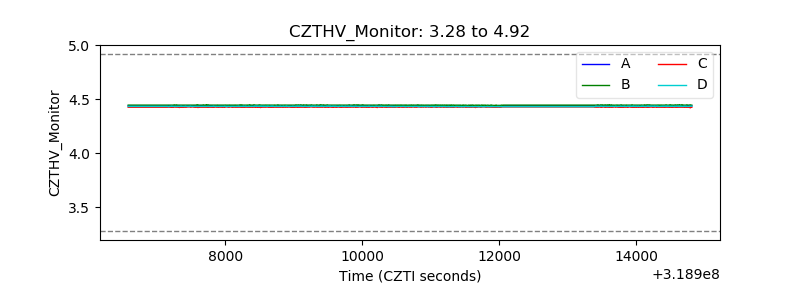 |
| D_VDD | 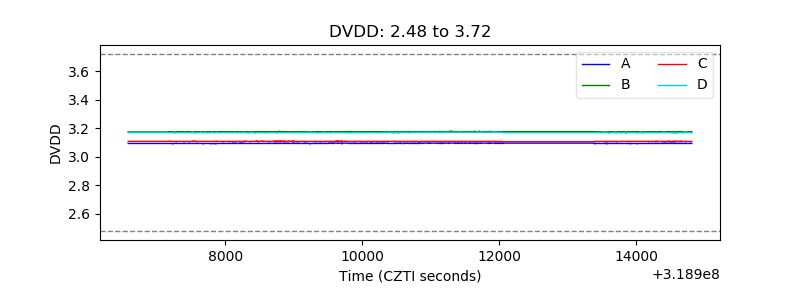 |
| Temperature 1 | 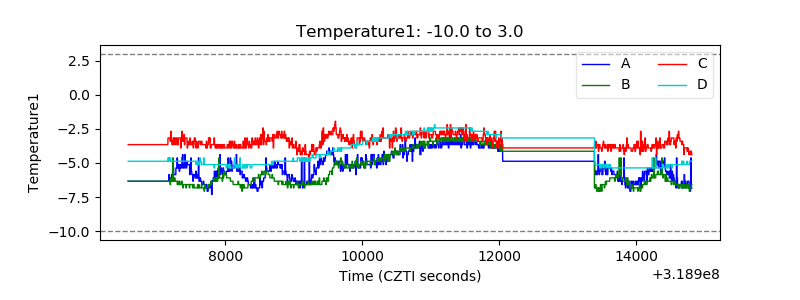 |
| Veto HV Monitor |  |
| Veto LLD | 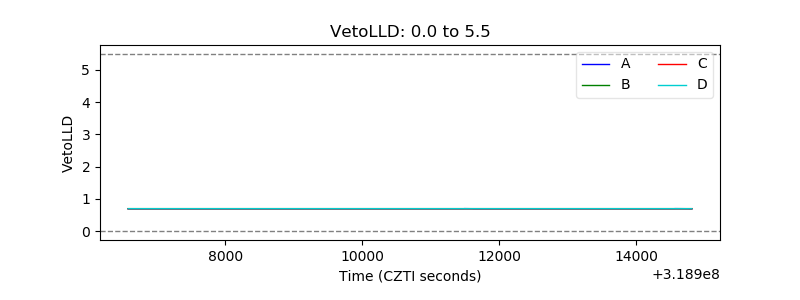 |
| Alpha Counter | 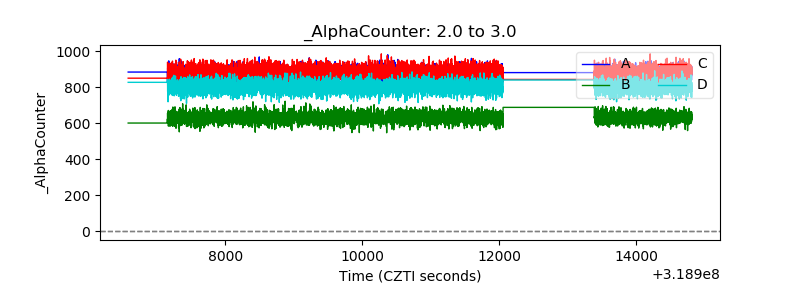 |
| _CPM_Rate | 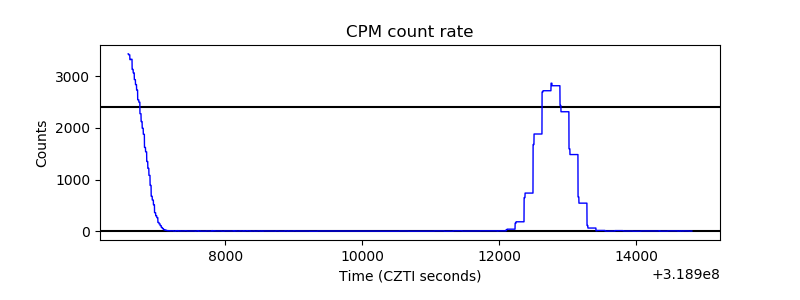 |
| CZT Counter | 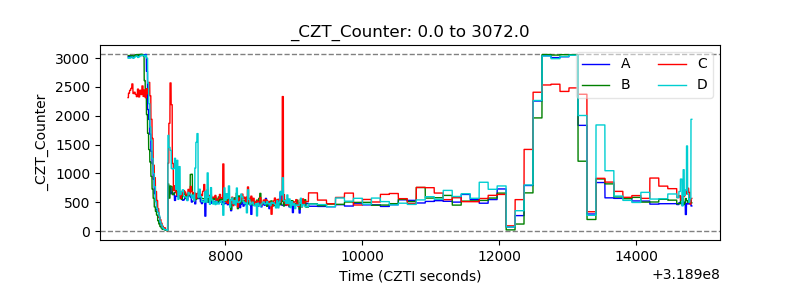 |
| +2.5 Volts monitor |  |
| +5 Volts monitor |  |
| _ROLL_ROT | 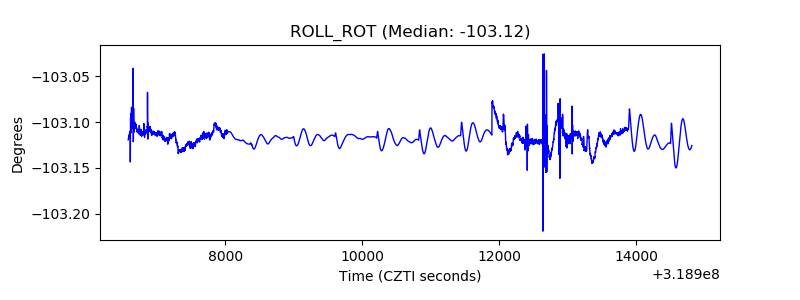 |
| _Roll_DEC | 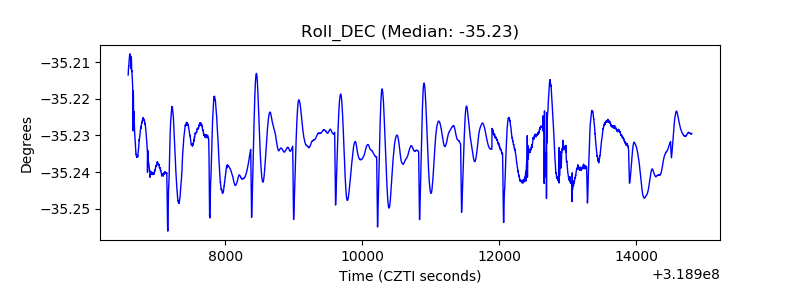 |
| _Roll_RA | 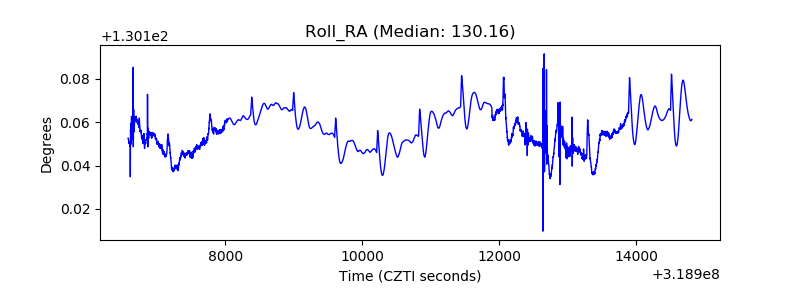 |
| Veto Counter | 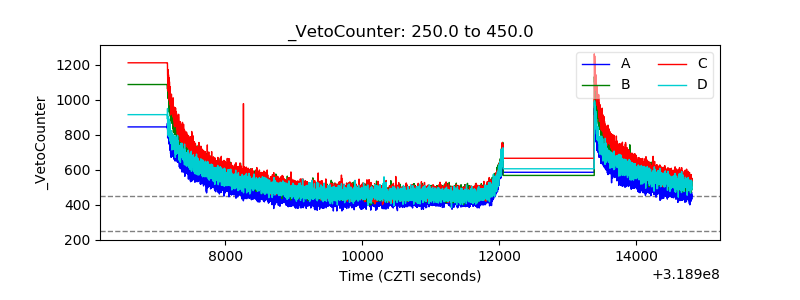 |