| Param | Original file | Final file |
|---|---|---|
| Filename | modeM0/AS1T03_178T01_9000003488_23610cztM0_level2.evt | modeM0/AS1T03_178T01_9000003488_23610cztM0_level2_quad_clean.evt |
| Size (bytes) | 467,945,280 | 65,908,800 |
| Size | 446.3 MB | 62.9 MB |
| Events in quadrant A | 2,850,426 | 414,655 |
| Events in quadrant B | 4,289,991 | 386,996 |
| Events in quadrant C | 3,035,612 | 408,672 |
| Events in quadrant D | 3,610,202 | 388,426 |
| Mode M0 | |||
|---|---|---|---|
| Quadrant | BADHDUFLAG | Total packets | Discarded packets |
| A | 0 | 13091 | 1284 |
| B | 0 | 18979 | 2846 |
| C | 0 | 13730 | 1451 |
| D | 0 | 16317 | 2008 |
| Mode M9 | |||
|---|---|---|---|
| Quadrant | BADHDUFLAG | Total packets | Discarded packets |
| A | 0 | 12 | 0 |
| B | 0 | 12 | 0 |
| C | 0 | 12 | 0 |
| D | 0 | 13 | 1 |
| Mode SS | |||
|---|---|---|---|
| Quadrant | BADHDUFLAG | Total packets | Discarded packets |
| A | 0 | 128 | 12 |
| B | 0 | 129 | 15 |
| C | 0 | 128 | 12 |
| D | 0 | 126 | 13 |
| Quadrant | Total seconds | Saturated seconds | Saturation percentage |
|---|---|---|---|
| A | 5710 | 66 | 1.155867% |
| B | 5614 | 712 | 12.682579% |
| C | 5691 | 117 | 2.055878% |
| D | 5671 | 120 | 2.116029% |
Noise dominated data is calculated using 1-second bins in cleaned event files. If a bin has >2000 counts, and if more than 50% of those come from <1% of pixels, then it is considered to be noise-dominated and hence unusable.
| Quadrant | # 1 sec bins | Bins with >0 counts | Bins with >2000 counts | High rate bins dominated by noise | Noise dominated (total time) | Noise dominated (detector-on time) | Marked lightcurve |
|---|---|---|---|---|---|---|---|
| A | 7435 | 5885 | 0 | 0 | 0.00% | 0.00% | 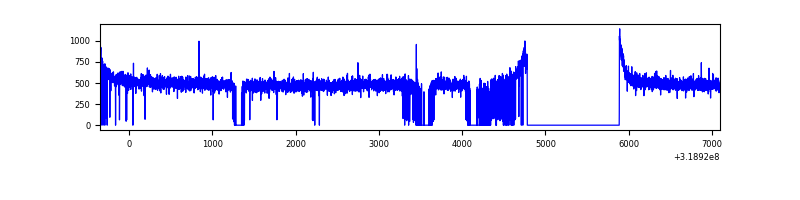 |
| B | 7439 | 5752 | 357 | 357 | 4.80% | 6.21% | 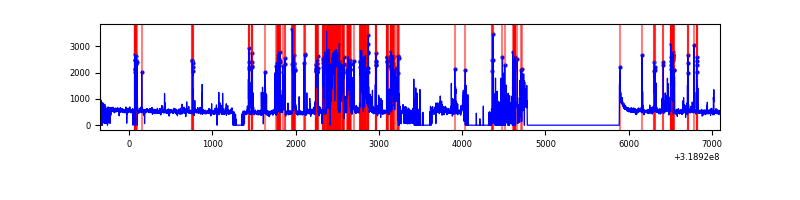 |
| C | 7443 | 5887 | 0 | 0 | 0.00% | 0.00% | 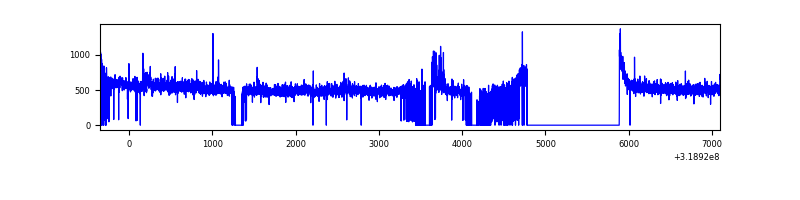 |
| D | 7435 | 5860 | 60 | 60 | 0.81% | 1.02% | 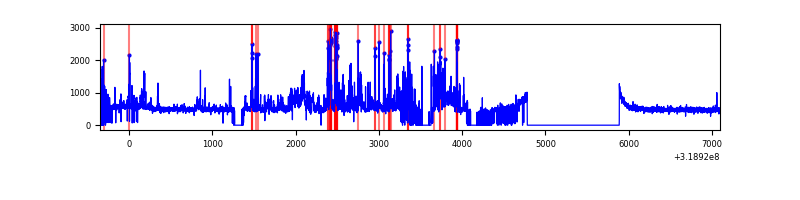 |
Top three noisy pixels from each quadrant. If the there are fewer than three noisy pixels in the level2.evt file, extra rows are filled as -1
| Pixel properties | Quadrant properties | ||||||
|---|---|---|---|---|---|---|---|
| Quadrant | DetID | PixID | Counts | Sigma | Mean | Median | Sigma |
| A | 13 | 254 | 8832 | 54.6 | 739 | 725 | 148.5 |
| A | 3 | 137 | 6349 | 37.88 | 739 | 725 | 148.5 |
| A | 0 | 226 | 6240 | 37.15 | 739 | 725 | 148.5 |
| B | 3 | 64 | 1585414 | 12118.86 | 687 | 669 | 130.8 |
| B | 12 | 111 | 15412 | 112.74 | 687 | 669 | 130.8 |
| B | 11 | 111 | 13932 | 101.42 | 687 | 669 | 130.8 |
| C | 14 | 238 | 115379 | 681.11 | 725 | 730 | 168.3 |
| C | 10 | 9 | 69494 | 408.51 | 725 | 730 | 168.3 |
| C | 7 | 247 | 8702 | 47.36 | 725 | 730 | 168.3 |
| D | 1 | 52 | 864636 | 4967.68 | 722 | 701 | 173.9 |
| D | 2 | 234 | 20060 | 111.32 | 722 | 701 | 173.9 |
| D | 10 | 70 | 16673 | 91.84 | 722 | 701 | 173.9 |
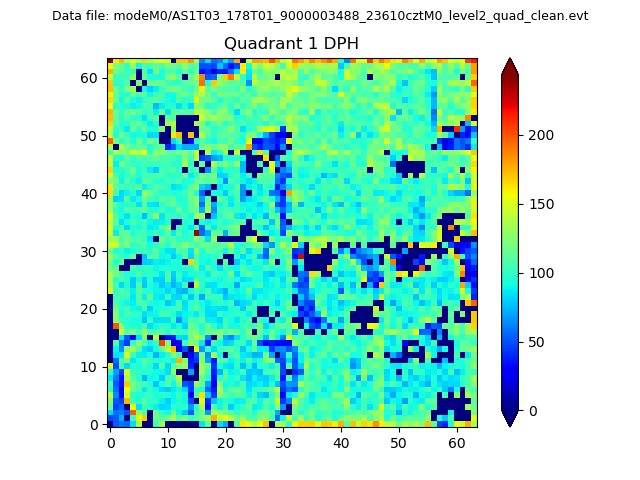
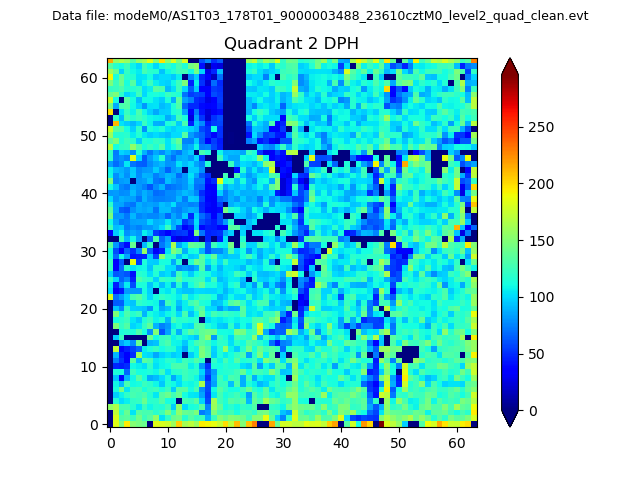
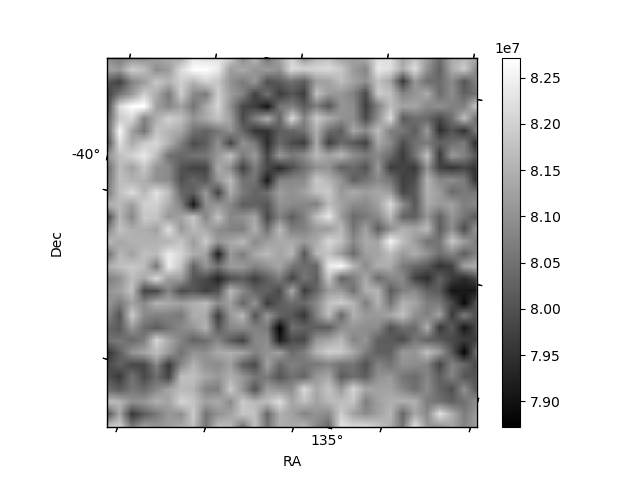
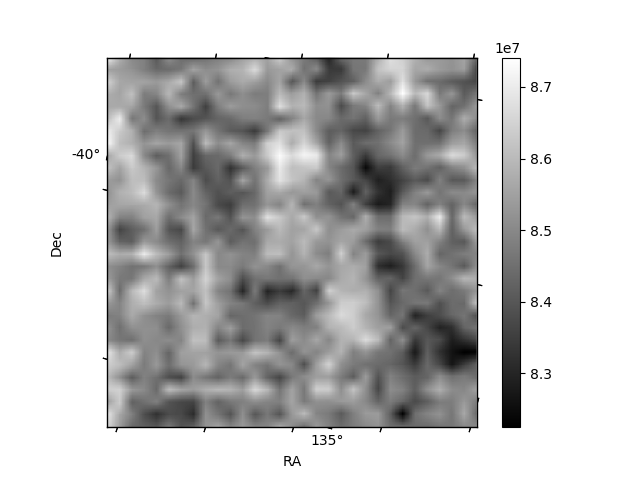
Histogram calculated using DETX and DETY for each event in the final _common_clean file
| Quadrant A |  |
 |
Quadrant B |
|---|---|---|---|
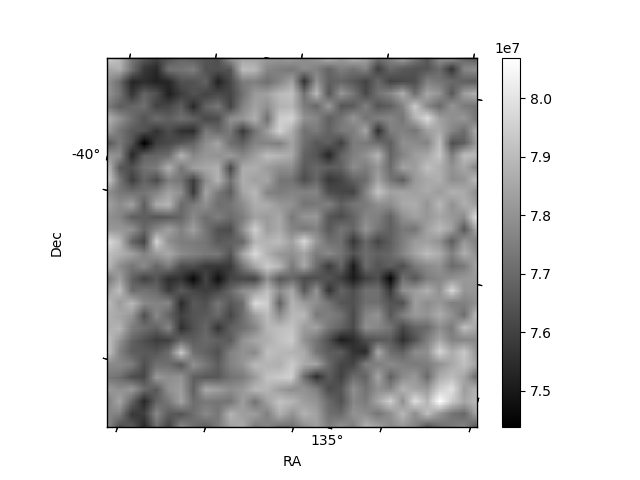
| Quadrant D |  |
 |
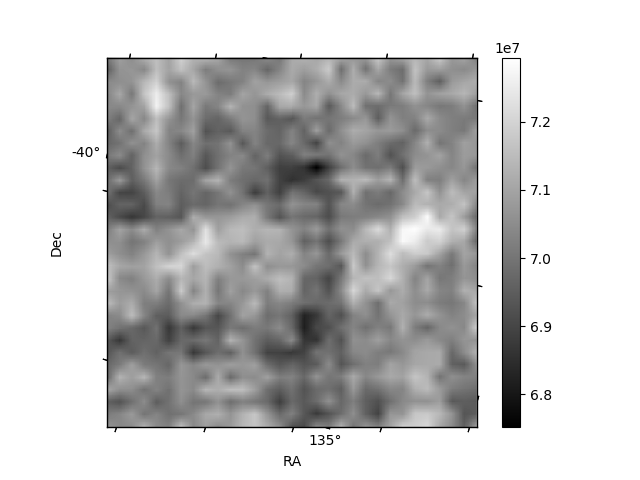
Quadrant C |
| Plot type | Count rate plots | Images |
|---|---|---|
| Comparison with Poisson distribution Blue bars denote a histogram of data divided into 1 sec bins. Red curve is a Poisson curve with rate = median count rate of data. |
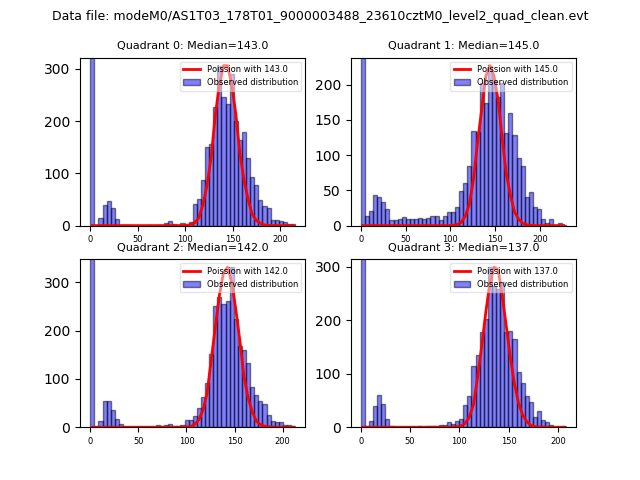 |
 |
| Quadrant-wise count rates Data is divided into 100 sec bins |
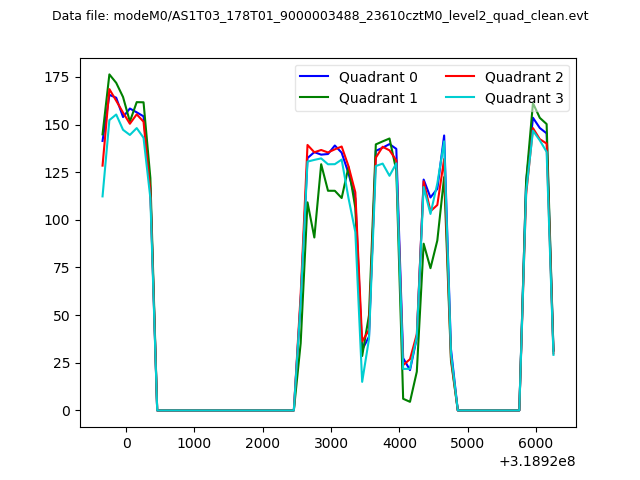 |
|
| Module-wise count rates for Quadrant A Data is divided into 100 sec bins |
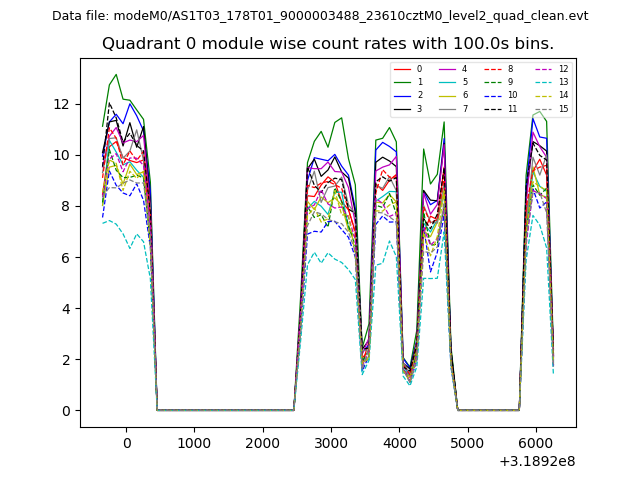 |
 |
| Module-wise count rates for Quadrant B Data is divided into 100 sec bins |
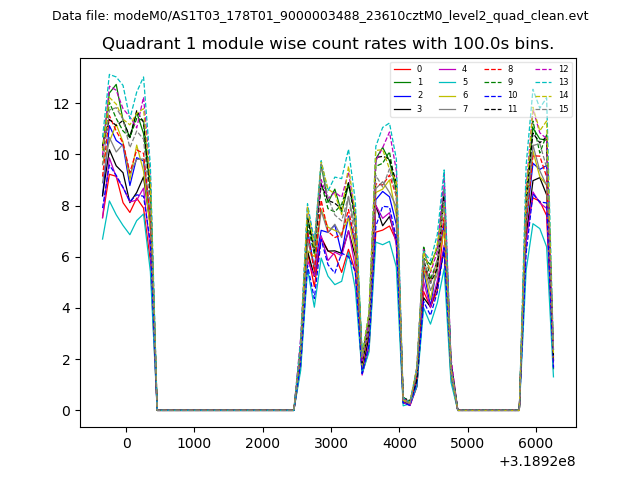 |
 |
| Module-wise count rates for Quadrant C Data is divided into 100 sec bins |
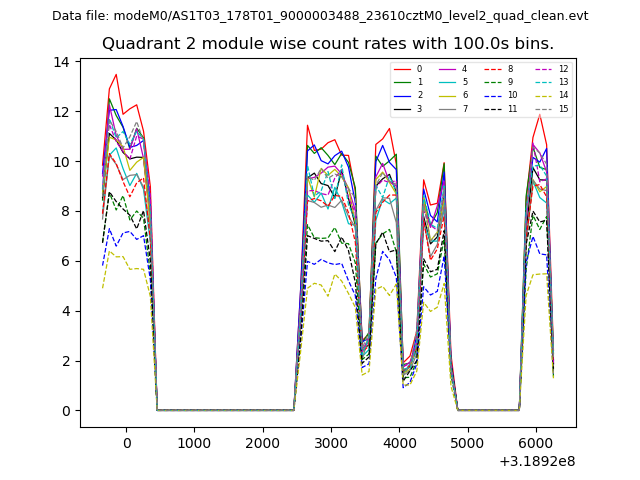 |
 |
| Module-wise count rates for Quadrant D Data is divided into 100 sec bins |
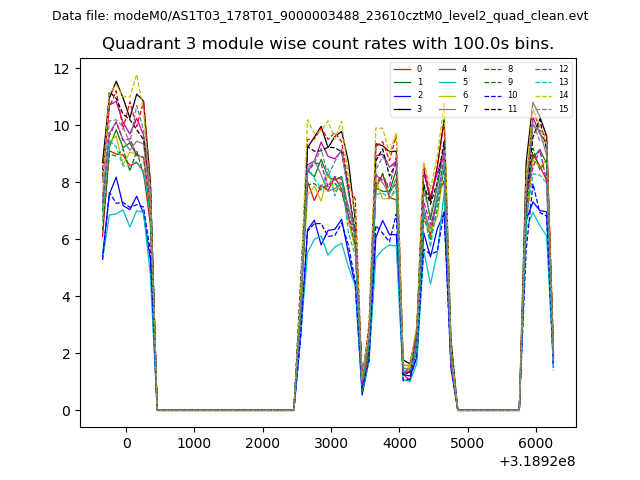 |
 |
| Parameter | Plot |
|---|---|
| CZT HV Monitor | 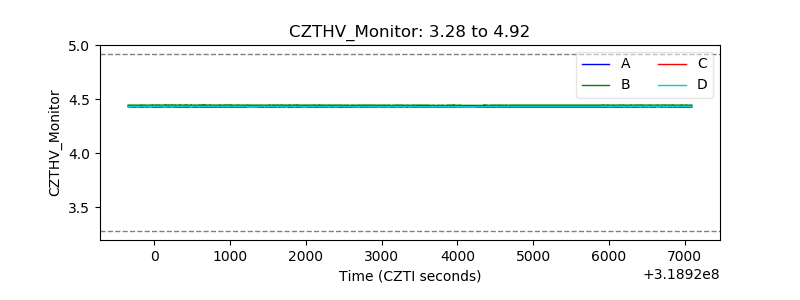 |
| D_VDD | 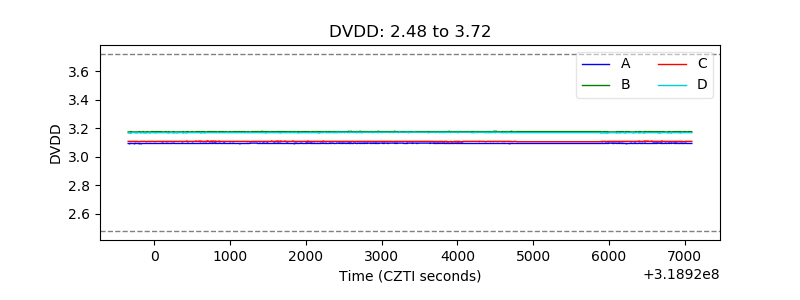 |
| Temperature 1 | 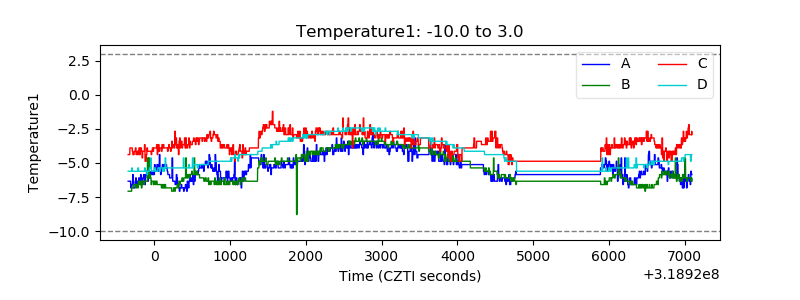 |
| Veto HV Monitor |  |
| Veto LLD | 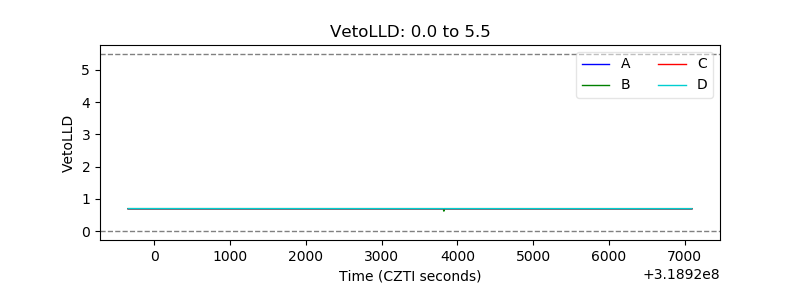 |
| Alpha Counter | 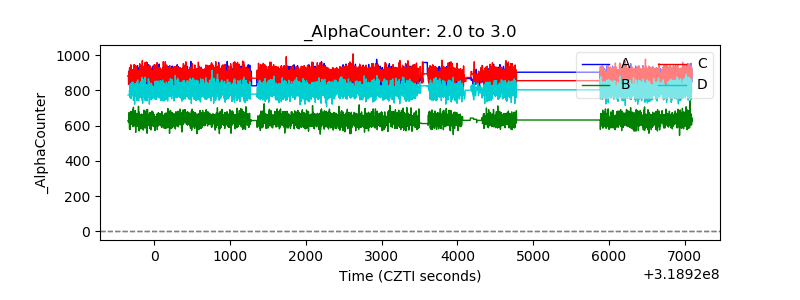 |
| _CPM_Rate | 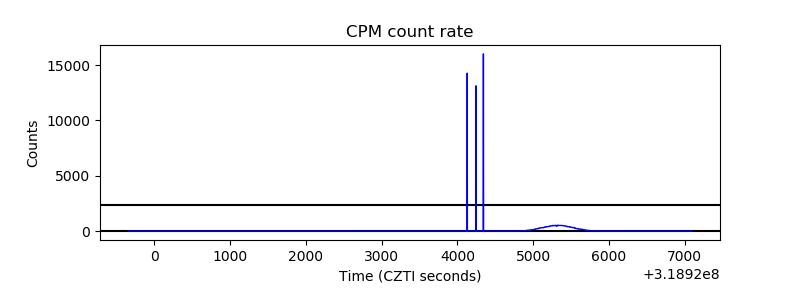 |
| CZT Counter | 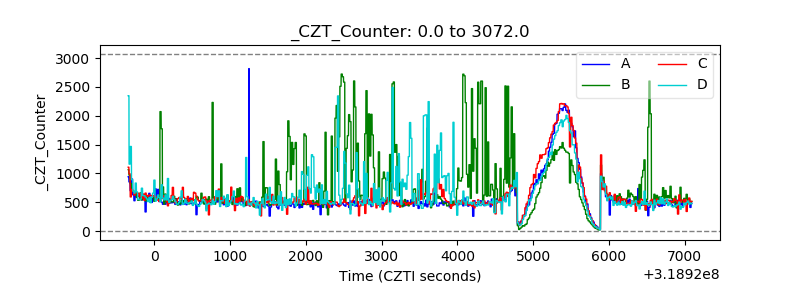 |
| +2.5 Volts monitor |  |
| +5 Volts monitor |  |
| _ROLL_ROT | 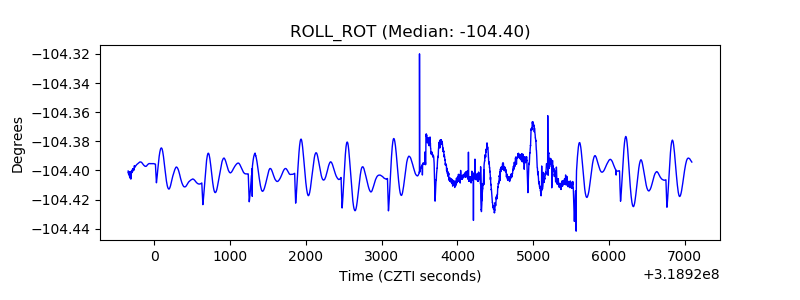 |
| _Roll_DEC |  |
| _Roll_RA |  |
| Veto Counter | 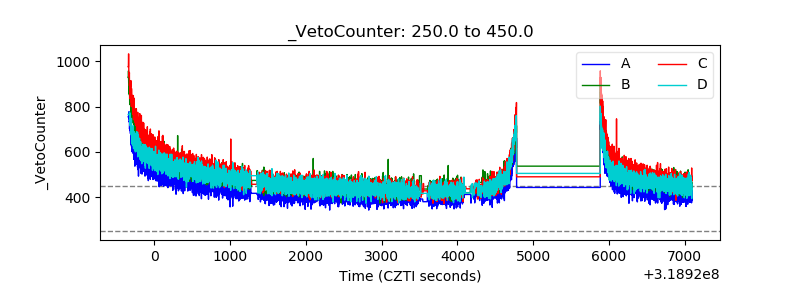 |