| Param | Original file | Final file |
|---|---|---|
| Filename | modeM0/AS1T03_178T01_9000003488_23611cztM0_level2.evt | modeM0/AS1T03_178T01_9000003488_23611cztM0_level2_quad_clean.evt |
| Size (bytes) | 614,393,280 | 78,727,680 |
| Size | 585.9 MB | 75.1 MB |
| Events in quadrant A | 3,563,091 | 496,391 |
| Events in quadrant B | 7,320,517 | 415,005 |
| Events in quadrant C | 3,696,933 | 488,032 |
| Events in quadrant D | 3,536,654 | 481,246 |
| Mode M0 | |||
|---|---|---|---|
| Quadrant | BADHDUFLAG | Total packets | Discarded packets |
| A | 0 | 15142 | 2 |
| B | 0 | 26474 | 8 |
| C | 0 | 15308 | 2 |
| D | 0 | 15341 | 2 |
| Mode M9 | |||
|---|---|---|---|
| Quadrant | BADHDUFLAG | Total packets | Discarded packets |
| A | 0 | 19 | 0 |
| B | 0 | 19 | 0 |
| C | 0 | 19 | 0 |
| D | 0 | 19 | 0 |
| Mode SS | |||
|---|---|---|---|
| Quadrant | BADHDUFLAG | Total packets | Discarded packets |
| A | 0 | 148 | 0 |
| B | 0 | 148 | 0 |
| C | 0 | 148 | 0 |
| D | 0 | 148 | 0 |
| Quadrant | Total seconds | Saturated seconds | Saturation percentage |
|---|---|---|---|
| A | 7216 | 192 | 2.660754% |
| B | 7216 | 1755 | 24.320953% |
| C | 7216 | 279 | 3.866408% |
| D | 7216 | 170 | 2.355876% |
Noise dominated data is calculated using 1-second bins in cleaned event files. If a bin has >2000 counts, and if more than 50% of those come from <1% of pixels, then it is considered to be noise-dominated and hence unusable.
| Quadrant | # 1 sec bins | Bins with >0 counts | Bins with >2000 counts | High rate bins dominated by noise | Noise dominated (total time) | Noise dominated (detector-on time) | Marked lightcurve |
|---|---|---|---|---|---|---|---|
| A | 9046 | 7216 | 0 | 0 | 0.00% | 0.00% | 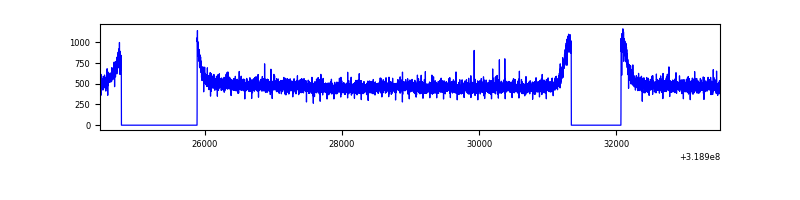 |
| B | 9045 | 7215 | 1118 | 1118 | 12.36% | 15.50% | 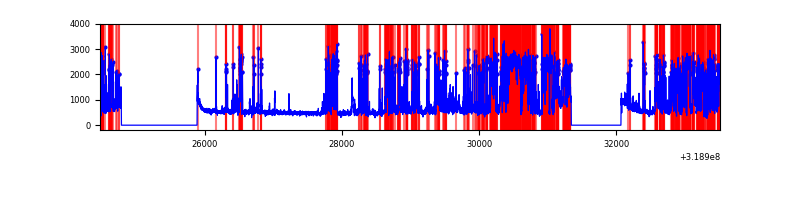 |
| C | 9046 | 7216 | 0 | 0 | 0.00% | 0.00% | 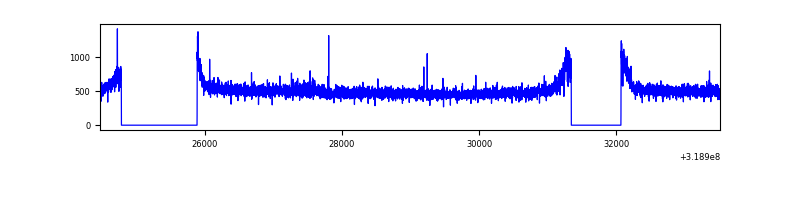 |
| D | 9046 | 7216 | 1 | 1 | 0.01% | 0.01% | 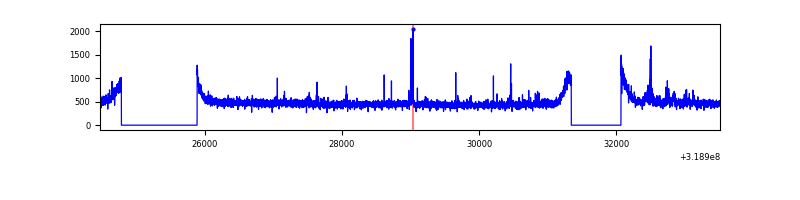 |
Top three noisy pixels from each quadrant. If the there are fewer than three noisy pixels in the level2.evt file, extra rows are filled as -1
| Pixel properties | Quadrant properties | ||||||
|---|---|---|---|---|---|---|---|
| Quadrant | DetID | PixID | Counts | Sigma | Mean | Median | Sigma |
| A | 13 | 254 | 11210 | 55.47 | 924 | 903 | 185.8 |
| A | 3 | 137 | 8416 | 40.44 | 924 | 903 | 185.8 |
| A | 0 | 226 | 7536 | 35.7 | 924 | 903 | 185.8 |
| B | 3 | 64 | 4069326 | 25981.56 | 810 | 789 | 156.6 |
| B | 7 | 219 | 30894 | 192.25 | 810 | 789 | 156.6 |
| B | 12 | 111 | 19143 | 117.21 | 810 | 789 | 156.6 |
| C | 14 | 238 | 141728 | 668.41 | 898 | 904 | 210.7 |
| C | 0 | 239 | 33964 | 156.92 | 898 | 904 | 210.7 |
| C | 10 | 23 | 6472 | 26.43 | 898 | 904 | 210.7 |
| D | 9 | 68 | 44306 | 196.47 | 911 | 884 | 221.0 |
| D | 1 | 52 | 35428 | 156.3 | 911 | 884 | 221.0 |
| D | 2 | 234 | 28309 | 124.09 | 911 | 884 | 221.0 |
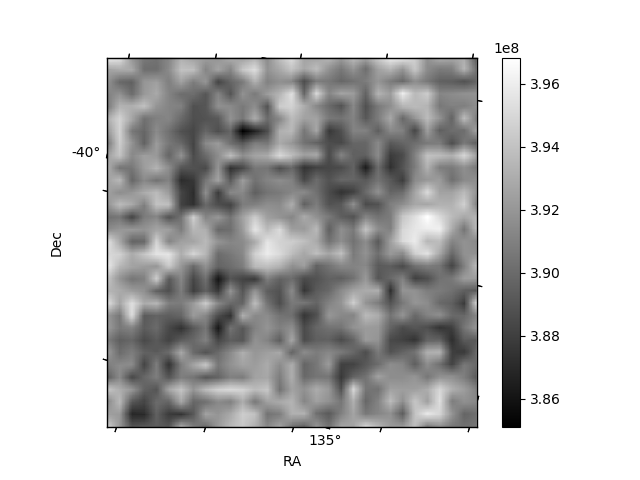
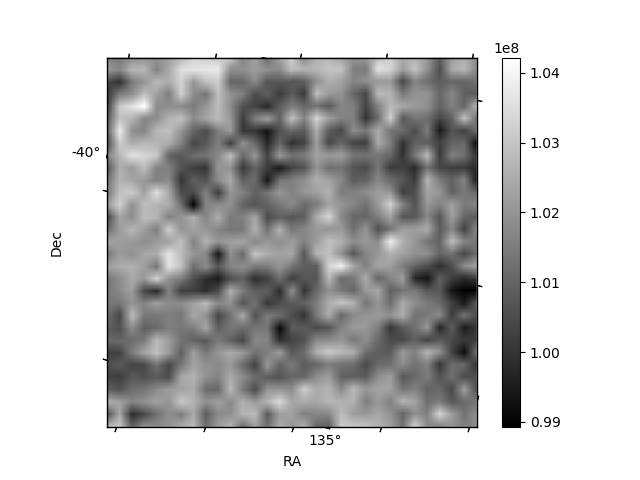
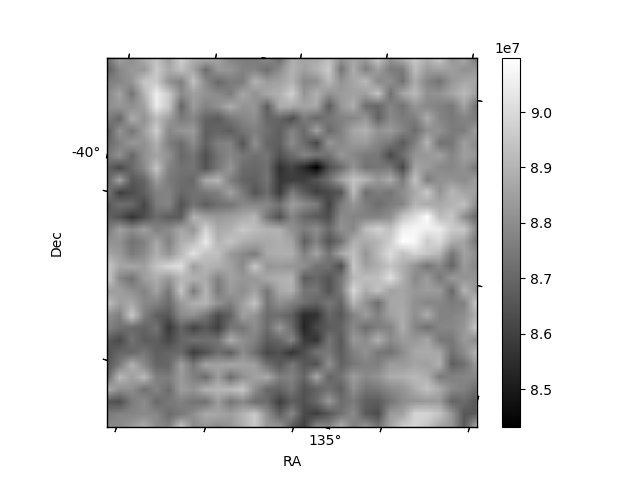
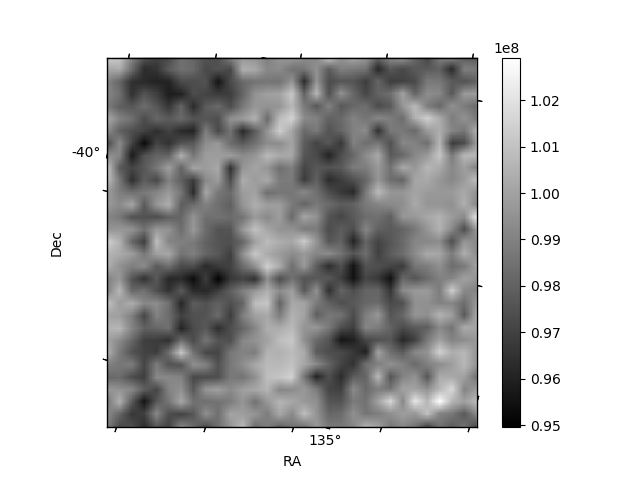
Histogram calculated using DETX and DETY for each event in the final _common_clean file
| Quadrant A | 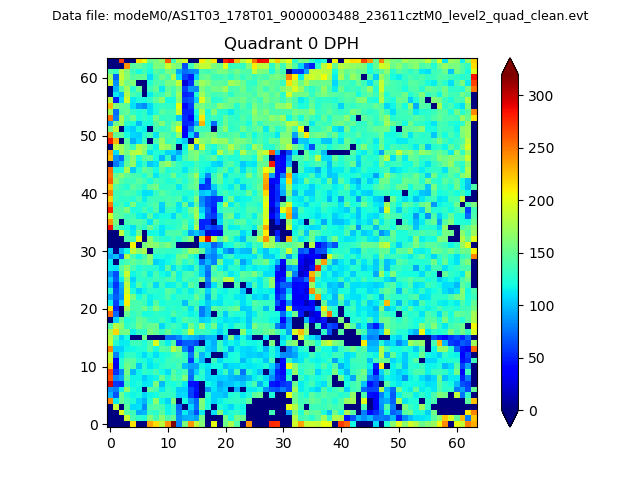 |
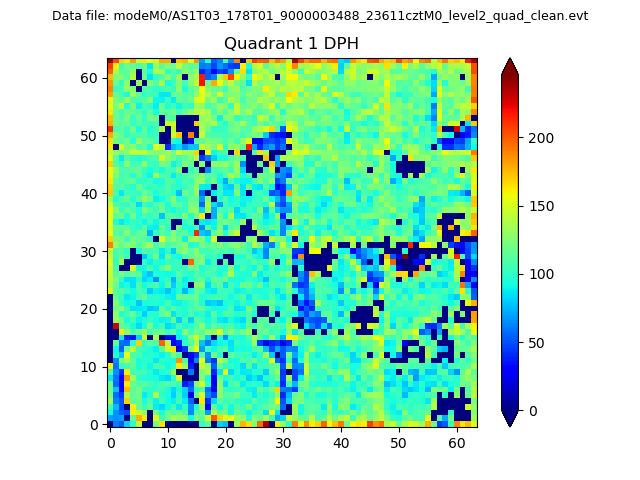 |
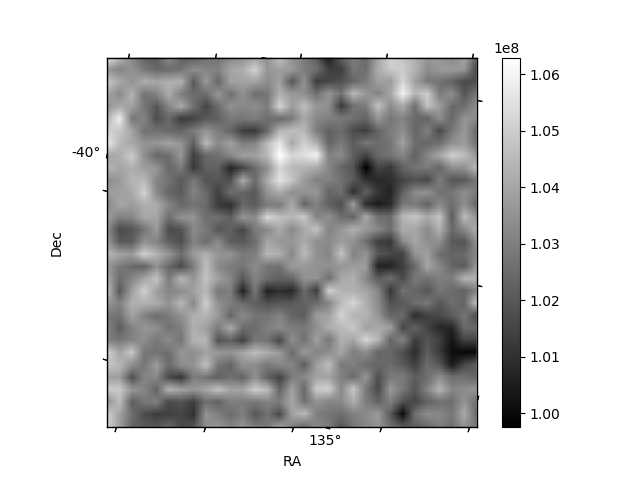
Quadrant B |
|---|---|---|---|
| Quadrant D | 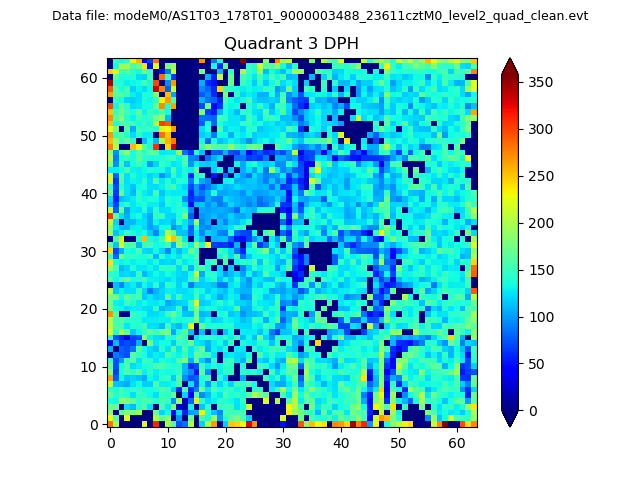 |
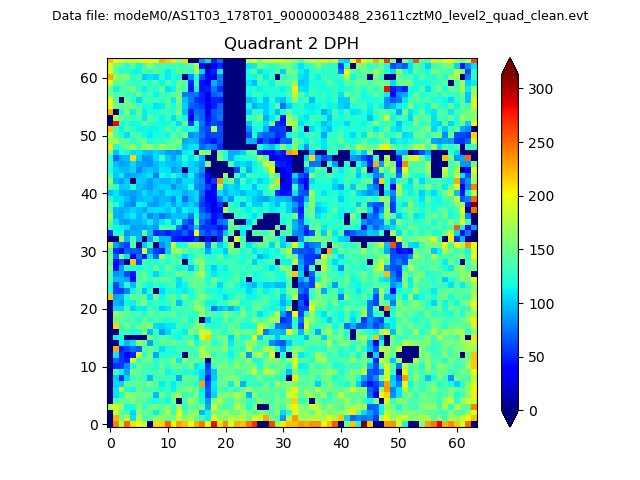 |
Quadrant C |
| Plot type | Count rate plots | Images |
|---|---|---|
| Comparison with Poisson distribution Blue bars denote a histogram of data divided into 1 sec bins. Red curve is a Poisson curve with rate = median count rate of data. |
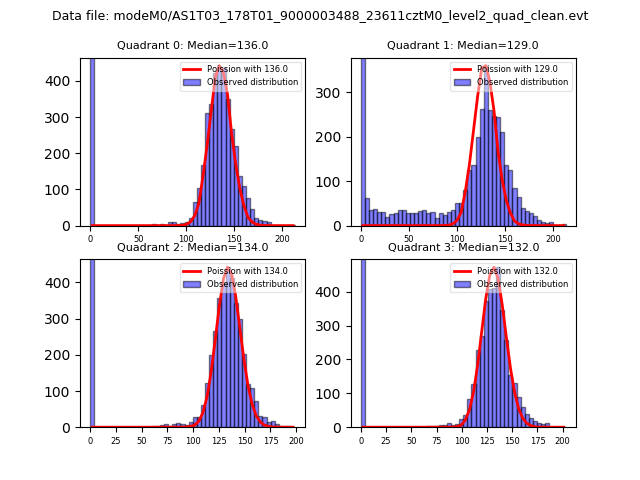 |
 |
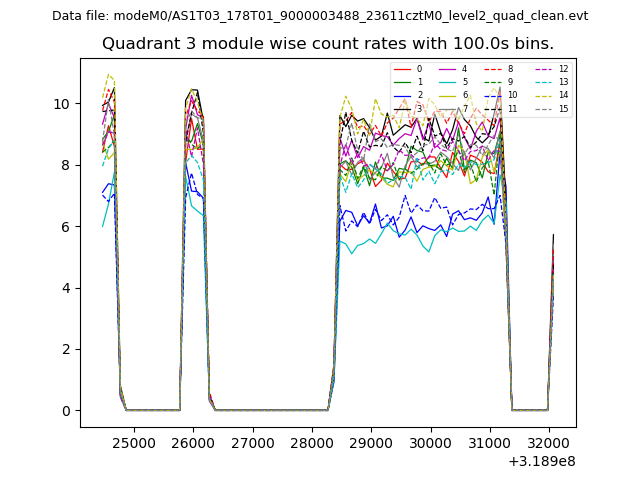
| Quadrant-wise count rates Data is divided into 100 sec bins |
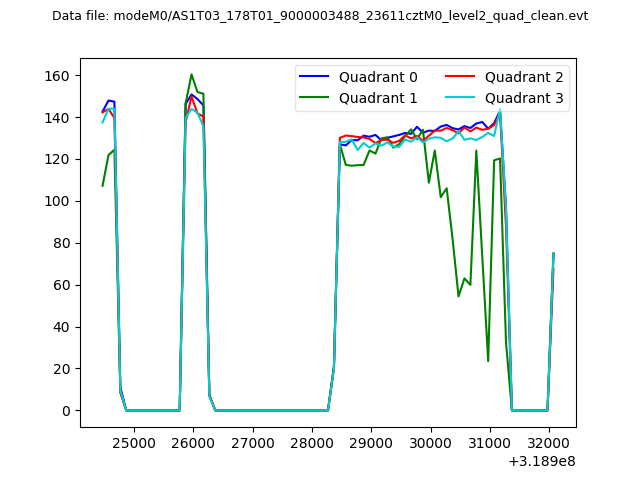 |
|
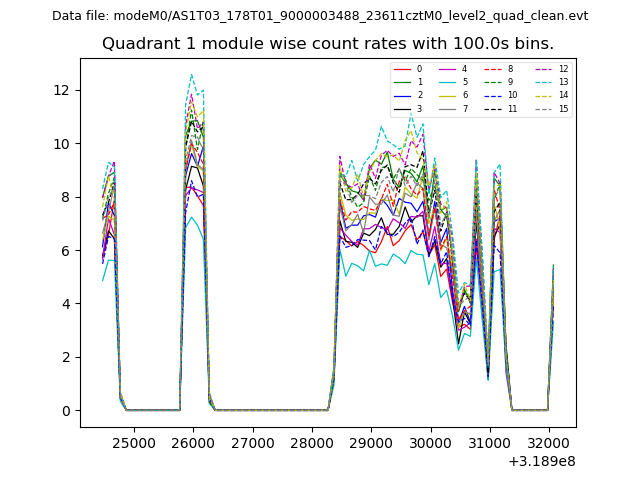
| Module-wise count rates for Quadrant A Data is divided into 100 sec bins |
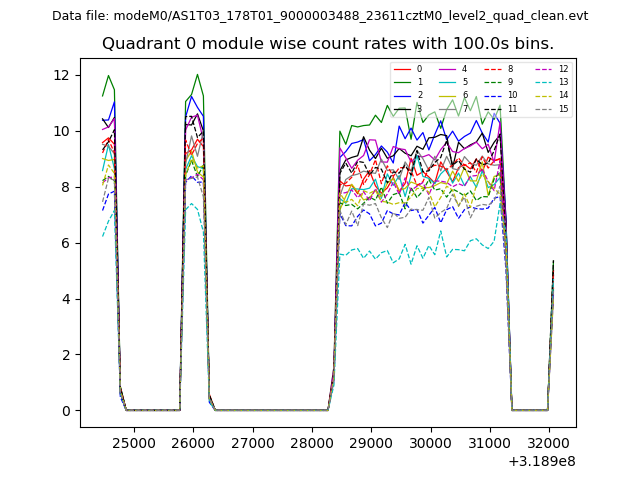 |
 |
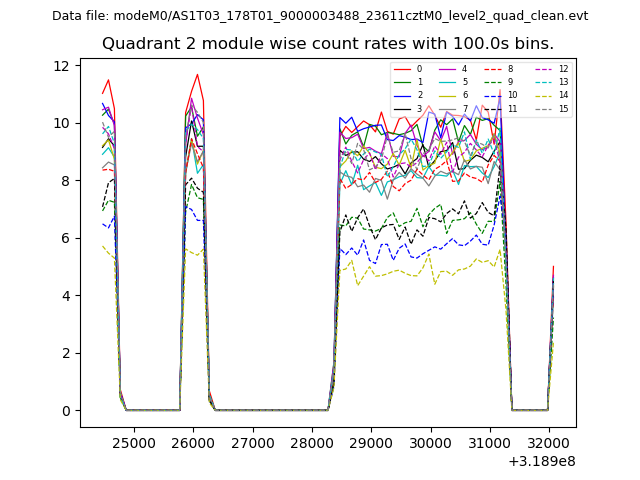
| Module-wise count rates for Quadrant B Data is divided into 100 sec bins |
 |
 |
| Module-wise count rates for Quadrant C Data is divided into 100 sec bins |
 |
 |
| Module-wise count rates for Quadrant D Data is divided into 100 sec bins |
 |
 |
| Parameter | Plot |
|---|---|
| CZT HV Monitor | 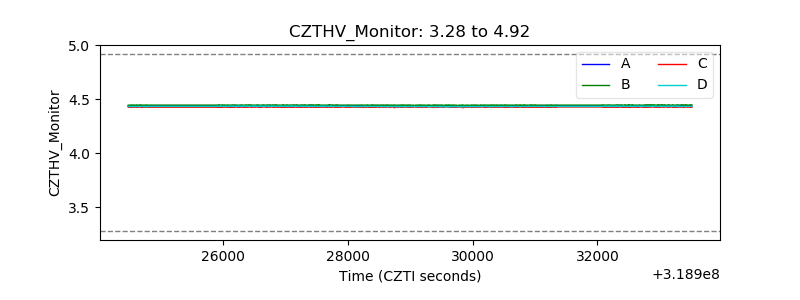 |
| D_VDD | 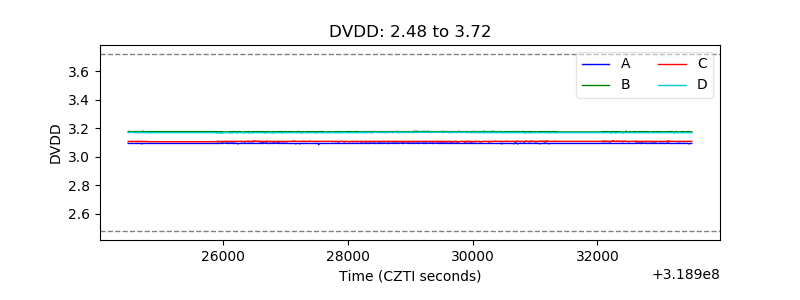 |
| Temperature 1 | 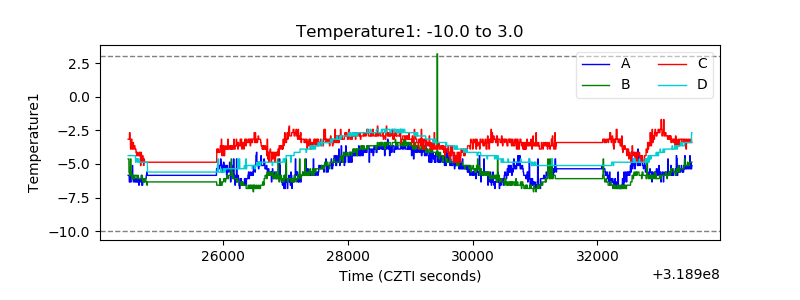 |
| Veto HV Monitor |  |
| Veto LLD | 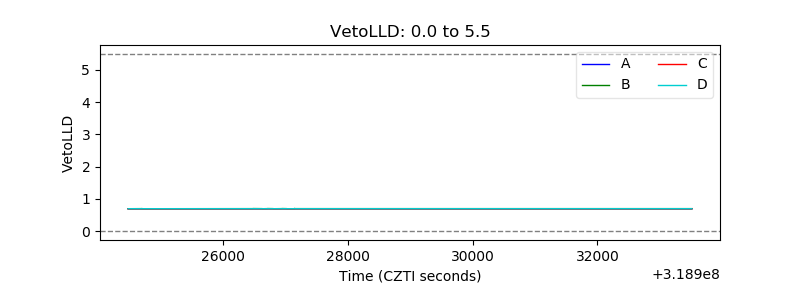 |
| Alpha Counter |  |
| _CPM_Rate |  |
| CZT Counter | 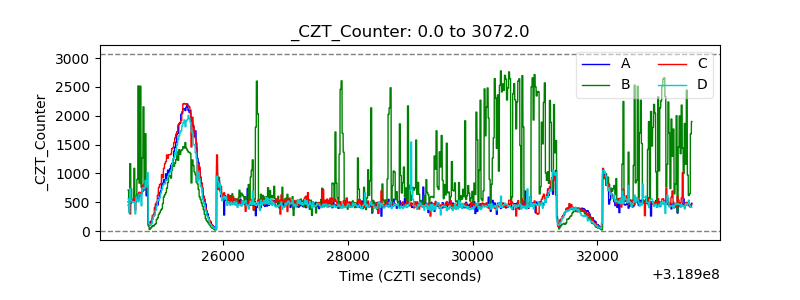 |
| +2.5 Volts monitor | 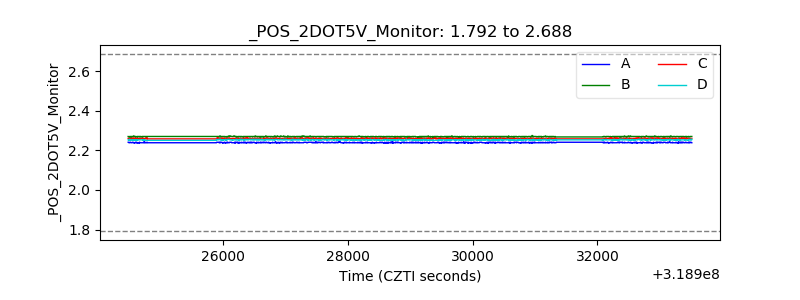 |
| +5 Volts monitor |  |
| _ROLL_ROT | 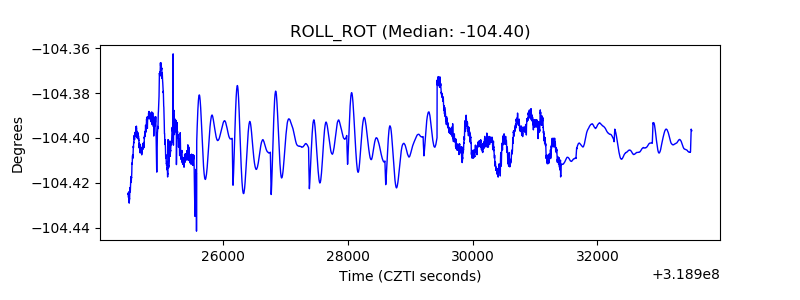 |
| _Roll_DEC | 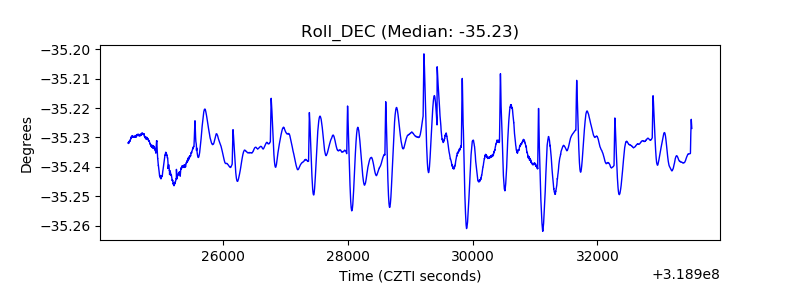 |
| _Roll_RA | 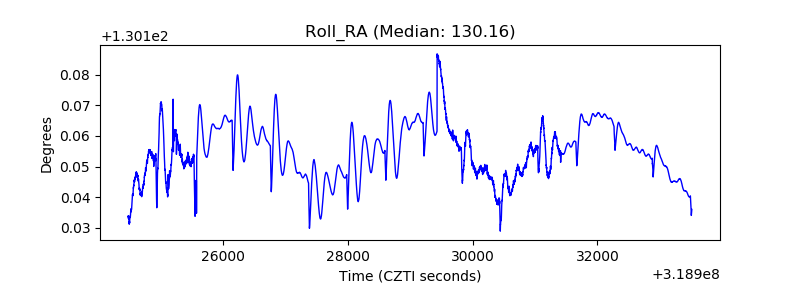 |
| Veto Counter | 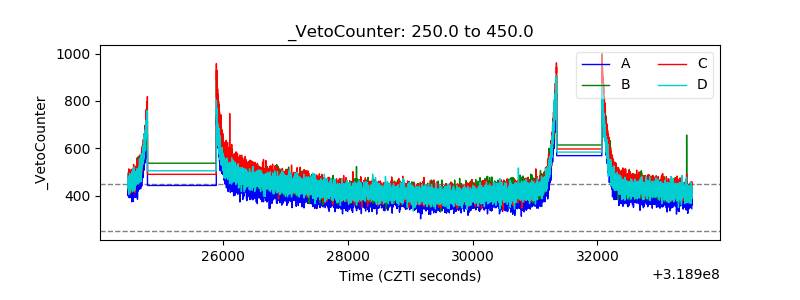 |