| Param | Original file | Final file |
|---|---|---|
| Filename | modeM0/AS1T03_178T01_9000003488_23613cztM0_level2.evt | modeM0/AS1T03_178T01_9000003488_23613cztM0_level2_quad_clean.evt |
| Size (bytes) | 718,729,920 | 78,145,920 |
| Size | 685.4 MB | 74.5 MB |
| Events in quadrant A | 3,785,955 | 486,158 |
| Events in quadrant B | 9,681,598 | 385,300 |
| Events in quadrant C | 3,877,156 | 481,398 |
| Events in quadrant D | 3,893,126 | 470,281 |
| Mode M0 | |||
|---|---|---|---|
| Quadrant | BADHDUFLAG | Total packets | Discarded packets |
| A | 0 | 16322 | 2 |
| B | 0 | 33955 | 2 |
| C | 0 | 16445 | 2 |
| D | 0 | 16901 | 2 |
| Mode M9 | |||
|---|---|---|---|
| Quadrant | BADHDUFLAG | Total packets | Discarded packets |
| A | 0 | 3 | 0 |
| B | 0 | 4 | 0 |
| C | 0 | 4 | 0 |
| D | 0 | 4 | 0 |
| Mode SS | |||
|---|---|---|---|
| Quadrant | BADHDUFLAG | Total packets | Discarded packets |
| A | 0 | 156 | 0 |
| B | 0 | 156 | 0 |
| C | 0 | 156 | 0 |
| D | 0 | 156 | 0 |
| Quadrant | Total seconds | Saturated seconds | Saturation percentage |
|---|---|---|---|
| A | 7807 | 328 | 4.201358% |
| B | 7807 | 2765 | 35.416934% |
| C | 7807 | 379 | 4.854618% |
| D | 7807 | 263 | 3.368772% |
Noise dominated data is calculated using 1-second bins in cleaned event files. If a bin has >2000 counts, and if more than 50% of those come from <1% of pixels, then it is considered to be noise-dominated and hence unusable.
| Quadrant | # 1 sec bins | Bins with >0 counts | Bins with >2000 counts | High rate bins dominated by noise | Noise dominated (total time) | Noise dominated (detector-on time) | Marked lightcurve |
|---|---|---|---|---|---|---|---|
| A | 7912 | 7807 | 0 | 0 | 0.00% | 0.00% | 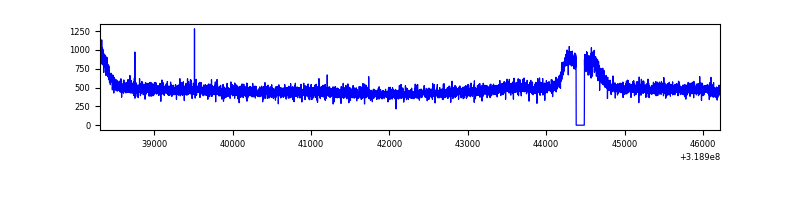 |
| B | 7912 | 7807 | 1951 | 1951 | 24.66% | 24.99% | 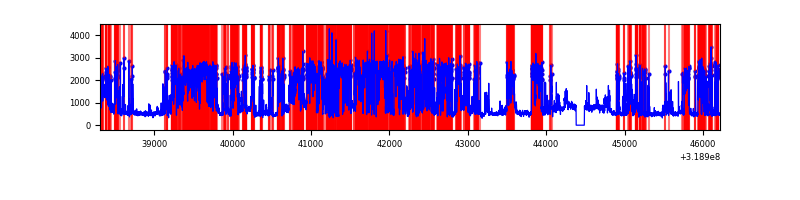 |
| C | 7912 | 7807 | 1 | 1 | 0.01% | 0.01% | 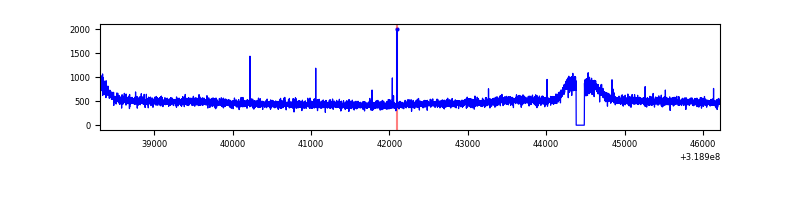 |
| D | 7912 | 7807 | 9 | 9 | 0.11% | 0.12% | 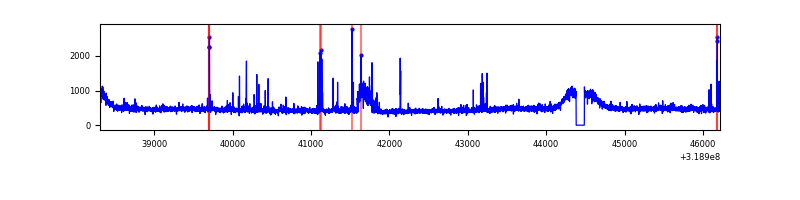 |
Top three noisy pixels from each quadrant. If the there are fewer than three noisy pixels in the level2.evt file, extra rows are filled as -1
| Pixel properties | Quadrant properties | ||||||
|---|---|---|---|---|---|---|---|
| Quadrant | DetID | PixID | Counts | Sigma | Mean | Median | Sigma |
| A | 13 | 254 | 11447 | 52.97 | 982 | 958 | 198.0 |
| A | 3 | 137 | 9341 | 42.34 | 982 | 958 | 198.0 |
| A | 0 | 226 | 8305 | 37.1 | 982 | 958 | 198.0 |
| B | 3 | 64 | 6149488 | 37985.82 | 827 | 802 | 161.9 |
| B | 0 | 229 | 259694 | 1599.4 | 827 | 802 | 161.9 |
| B | 12 | 111 | 20258 | 120.2 | 827 | 802 | 161.9 |
| C | 14 | 238 | 147340 | 649.62 | 952 | 955 | 225.3 |
| C | 13 | 61 | 6436 | 24.32 | 952 | 955 | 225.3 |
| C | 7 | 247 | 5921 | 22.04 | 952 | 955 | 225.3 |
| D | 1 | 52 | 181156 | 765.22 | 967 | 940 | 235.5 |
| D | 12 | 233 | 43125 | 179.12 | 967 | 940 | 235.5 |
| D | 2 | 234 | 31264 | 128.76 | 967 | 940 | 235.5 |
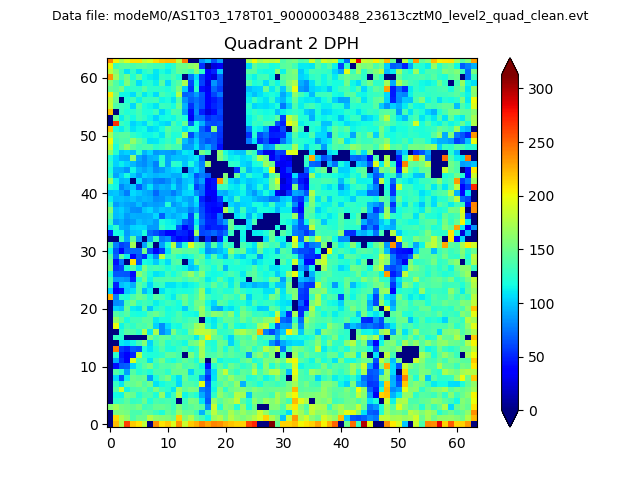
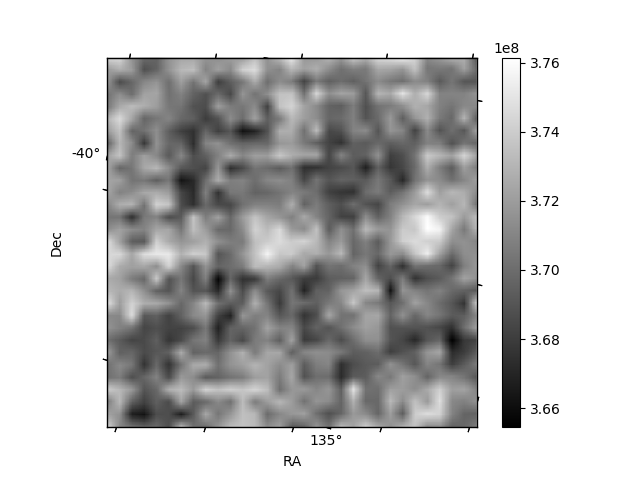
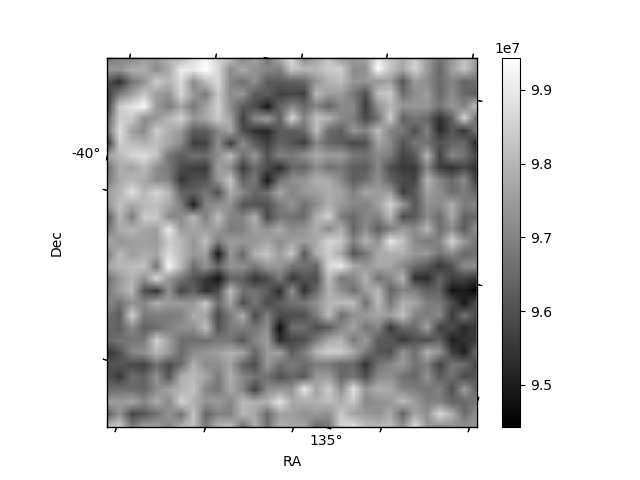
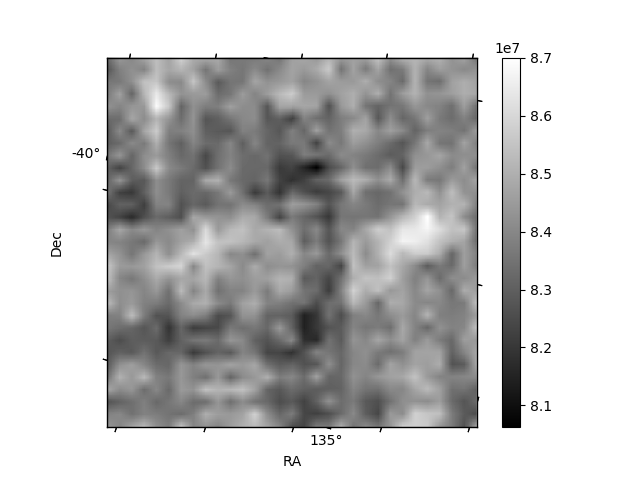
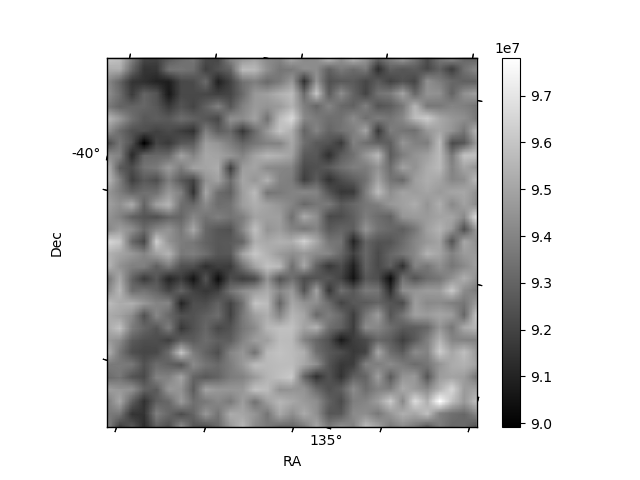
Histogram calculated using DETX and DETY for each event in the final _common_clean file
| Quadrant A | 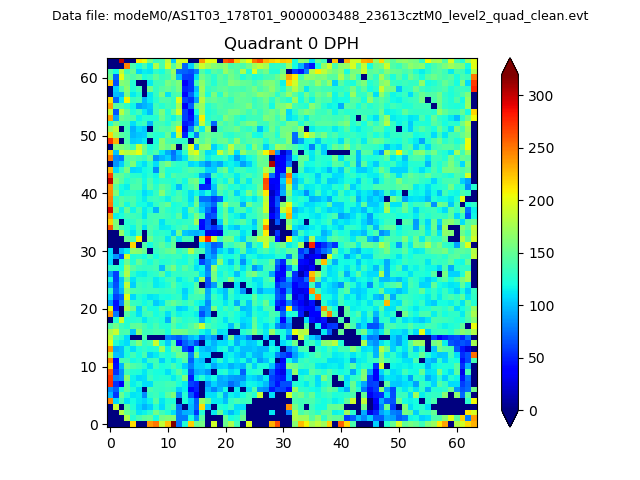 |
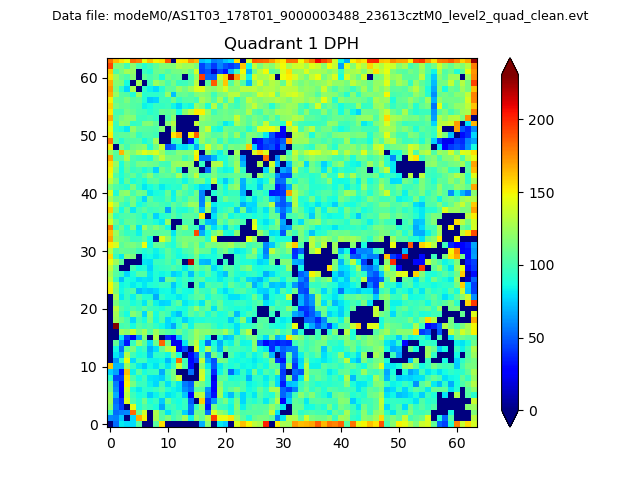 |
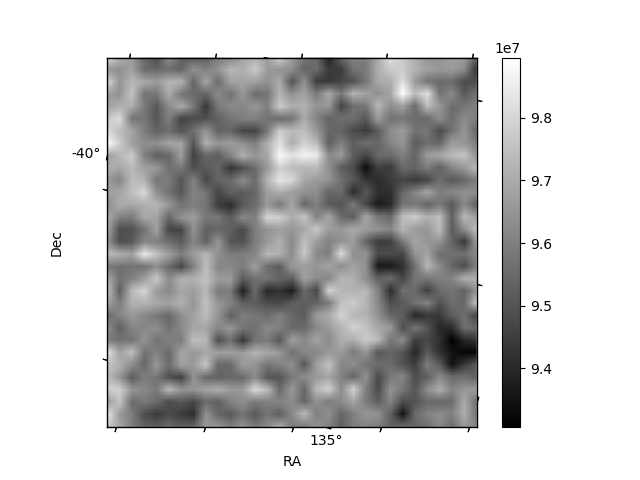
Quadrant B |
|---|---|---|---|
| Quadrant D | 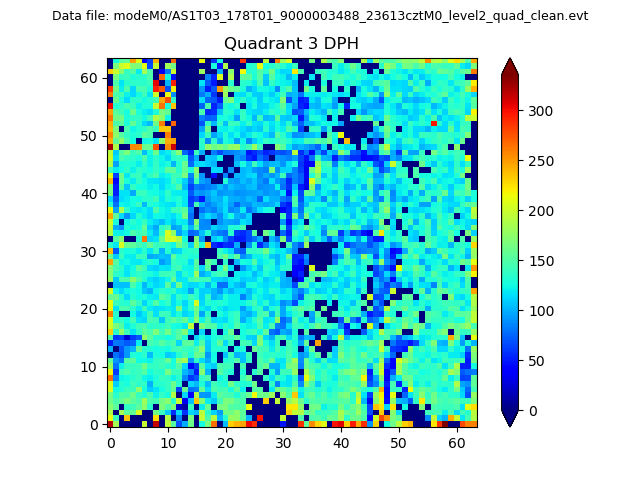 |
 |
Quadrant C |
| Plot type | Count rate plots | Images |
|---|---|---|
| Comparison with Poisson distribution Blue bars denote a histogram of data divided into 1 sec bins. Red curve is a Poisson curve with rate = median count rate of data. |
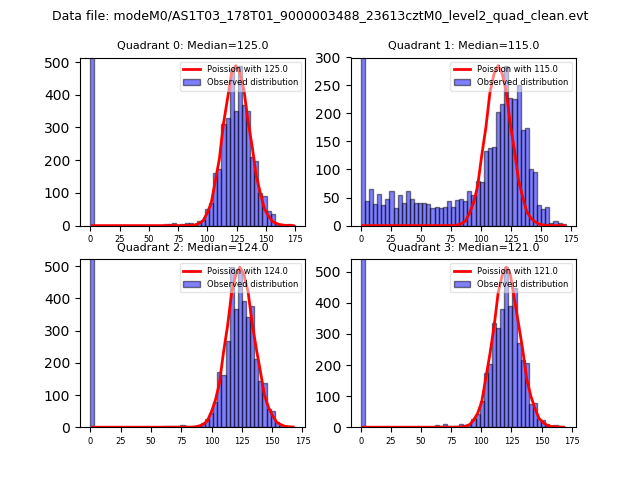 |
 |
| Quadrant-wise count rates Data is divided into 100 sec bins |
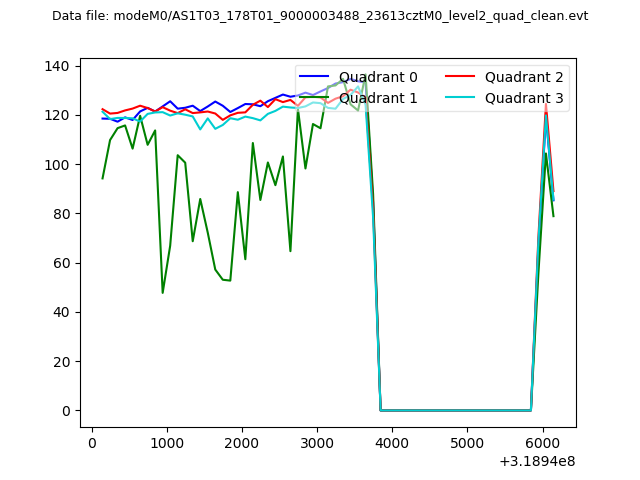 |
|
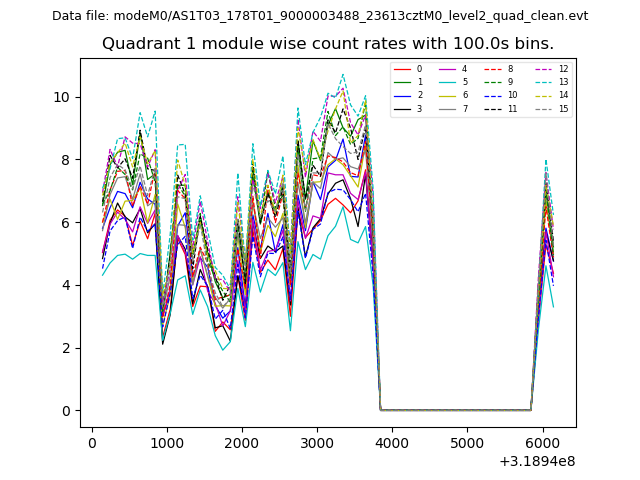
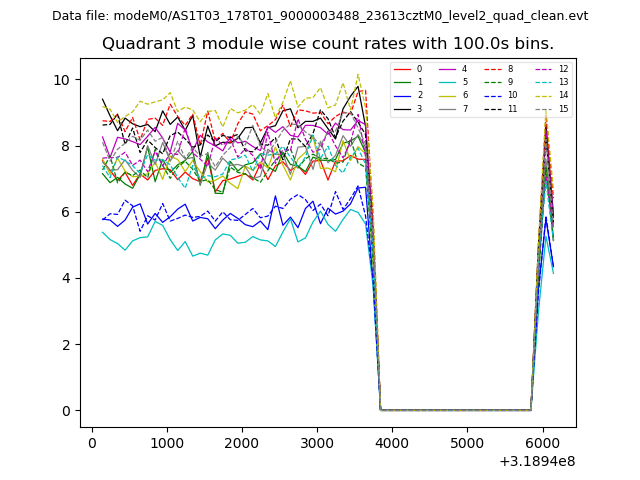
| Module-wise count rates for Quadrant A Data is divided into 100 sec bins |
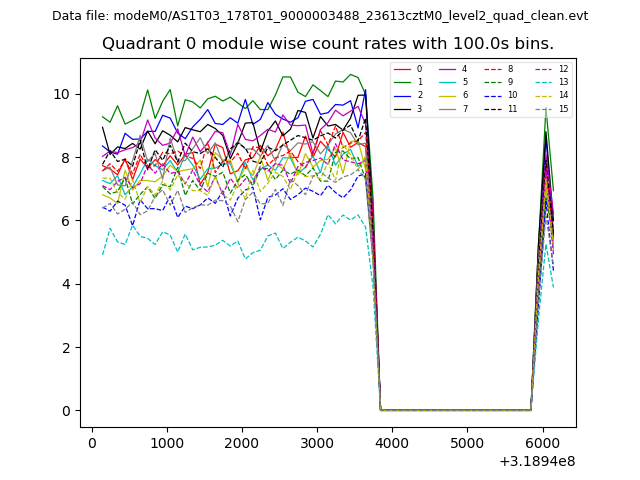 |
 |
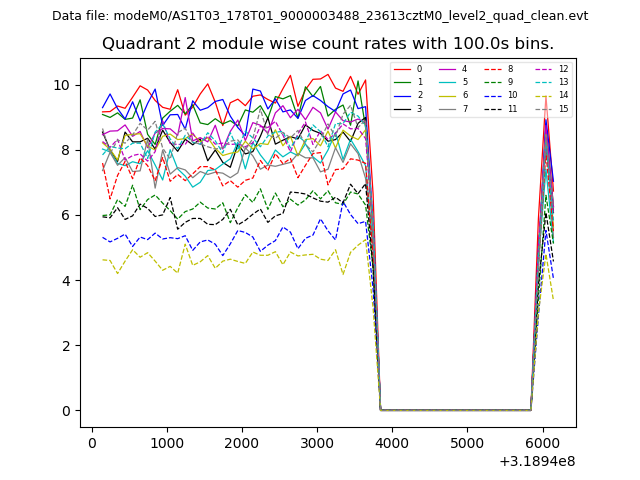
| Module-wise count rates for Quadrant B Data is divided into 100 sec bins |
 |
 |
| Module-wise count rates for Quadrant C Data is divided into 100 sec bins |
 |
 |
| Module-wise count rates for Quadrant D Data is divided into 100 sec bins |
 |
 |
| Parameter | Plot |
|---|---|
| CZT HV Monitor | 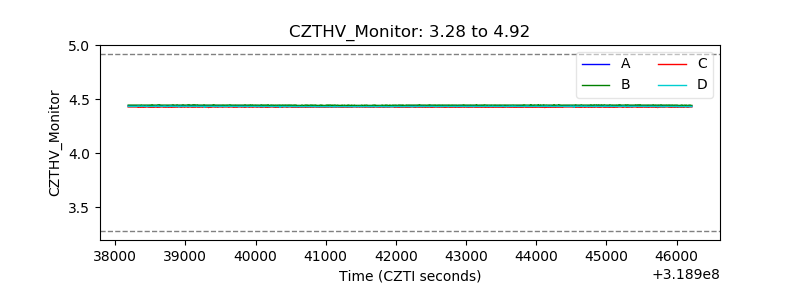 |
| D_VDD | 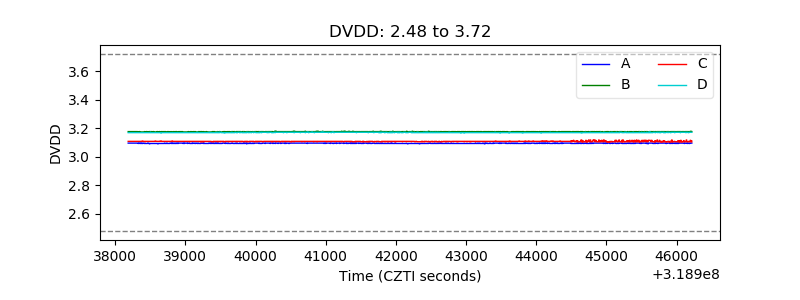 |
| Temperature 1 | 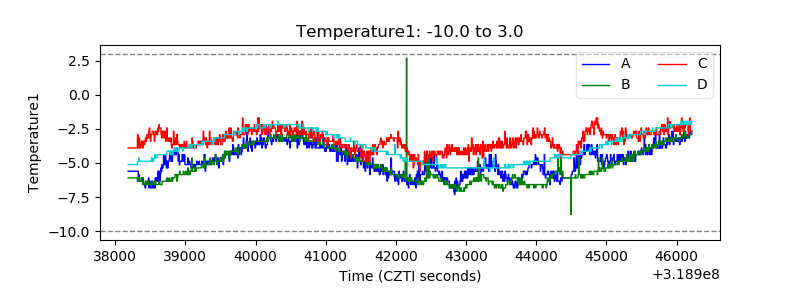 |
| Veto HV Monitor | 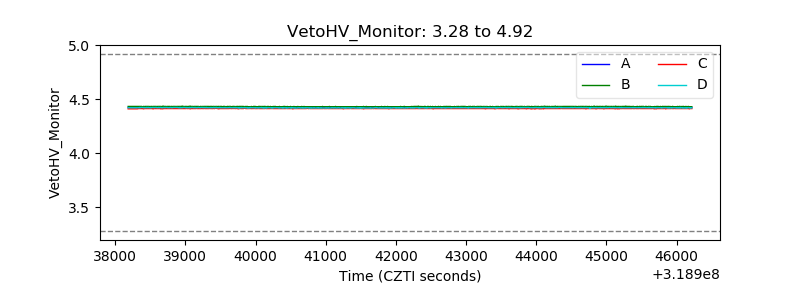 |
| Veto LLD | 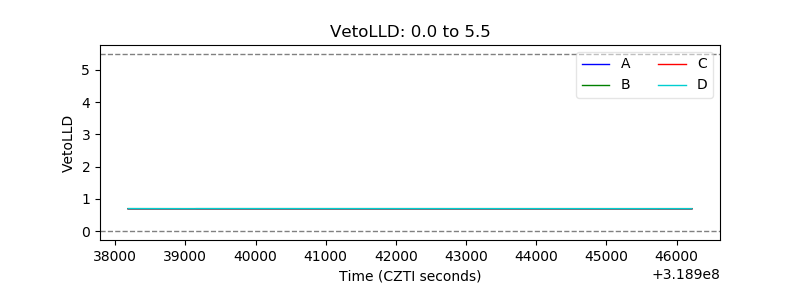 |
| Alpha Counter | 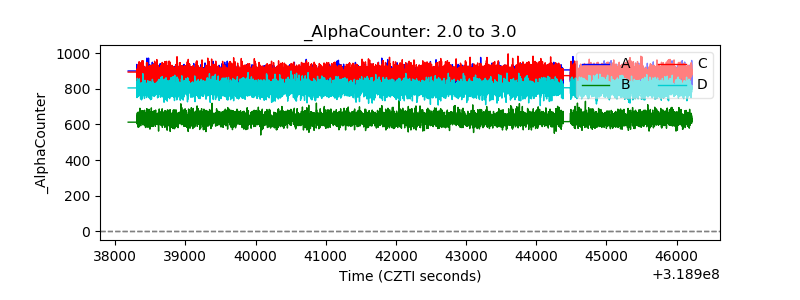 |
| _CPM_Rate | 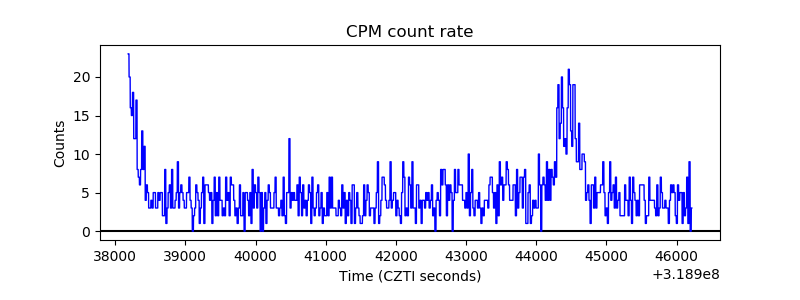 |
| CZT Counter | 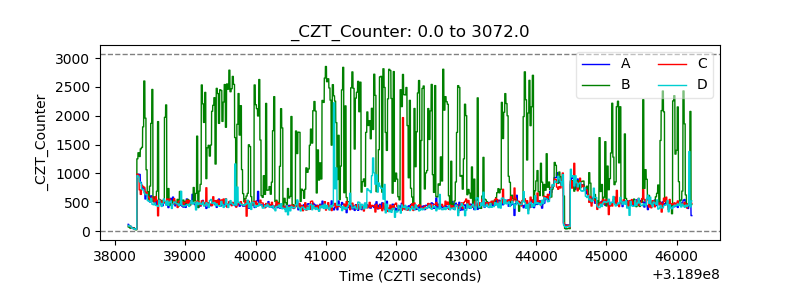 |
| +2.5 Volts monitor | 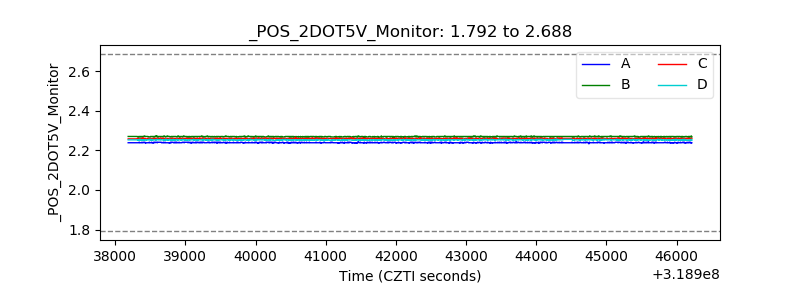 |
| +5 Volts monitor |  |
| _ROLL_ROT | 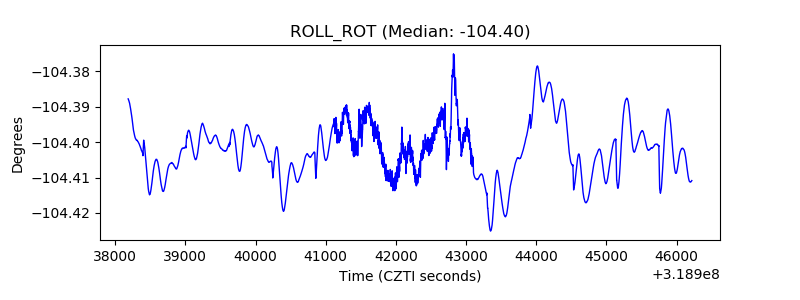 |
| _Roll_DEC | 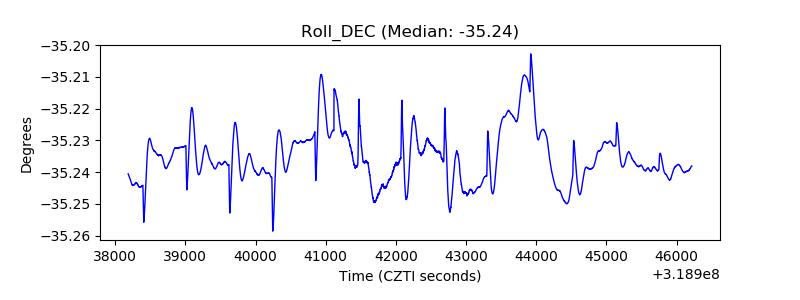 |
| _Roll_RA | 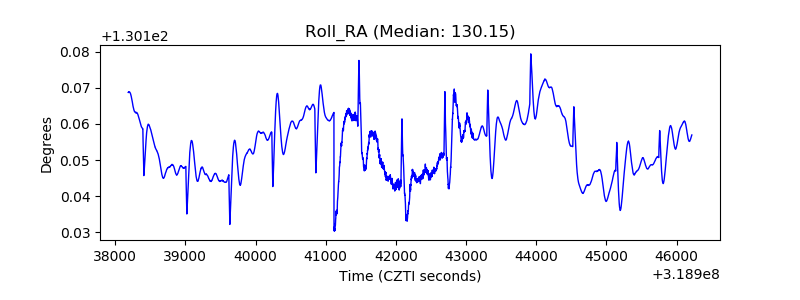 |
| Veto Counter | 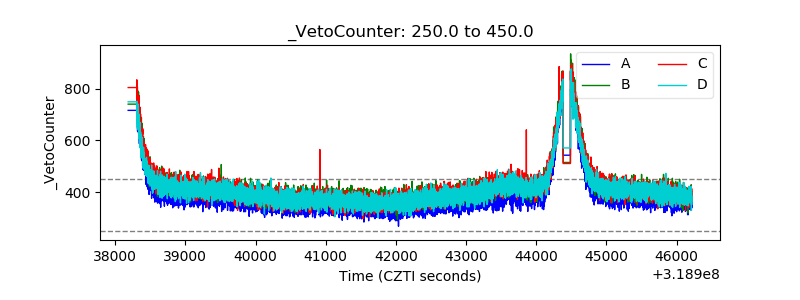 |