| Param | Original file | Final file |
|---|---|---|
| Filename | modeM0/AS1T03_178T01_9000003488_23614cztM0_level2.evt | modeM0/AS1T03_178T01_9000003488_23614cztM0_level2_quad_clean.evt |
| Size (bytes) | 654,624,000 | 84,807,360 |
| Size | 624.3 MB | 80.9 MB |
| Events in quadrant A | 3,520,849 | 537,685 |
| Events in quadrant B | 8,494,290 | 453,836 |
| Events in quadrant C | 3,630,629 | 530,780 |
| Events in quadrant D | 3,670,365 | 522,820 |
| Mode M0 | |||
|---|---|---|---|
| Quadrant | BADHDUFLAG | Total packets | Discarded packets |
| A | 0 | 15343 | 1 |
| B | 0 | 30239 | 1 |
| C | 0 | 15542 | 1 |
| D | 0 | 15886 | 1 |
| Mode M9 | |||
|---|---|---|---|
| Quadrant | BADHDUFLAG | Total packets | Discarded packets |
| A | 0 | 4 | 0 |
| B | 0 | 4 | 0 |
| C | 0 | 4 | 0 |
| D | 0 | 4 | 0 |
| Mode SS | |||
|---|---|---|---|
| Quadrant | BADHDUFLAG | Total packets | Discarded packets |
| A | 0 | 152 | 0 |
| B | 0 | 152 | 0 |
| C | 0 | 152 | 0 |
| D | 0 | 152 | 0 |
| Quadrant | Total seconds | Saturated seconds | Saturation percentage |
|---|---|---|---|
| A | 7509 | 94 | 1.251831% |
| B | 7509 | 2012 | 26.794513% |
| C | 7510 | 129 | 1.717710% |
| D | 7510 | 69 | 0.918775% |
Noise dominated data is calculated using 1-second bins in cleaned event files. If a bin has >2000 counts, and if more than 50% of those come from <1% of pixels, then it is considered to be noise-dominated and hence unusable.
| Quadrant | # 1 sec bins | Bins with >0 counts | Bins with >2000 counts | High rate bins dominated by noise | Noise dominated (total time) | Noise dominated (detector-on time) | Marked lightcurve |
|---|---|---|---|---|---|---|---|
| A | 7889 | 7509 | 0 | 0 | 0.00% | 0.00% | 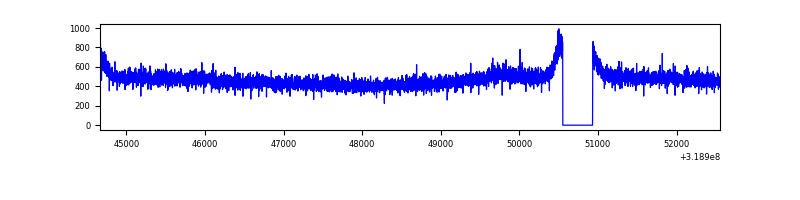 |
| B | 7889 | 7509 | 1477 | 1477 | 18.72% | 19.67% | 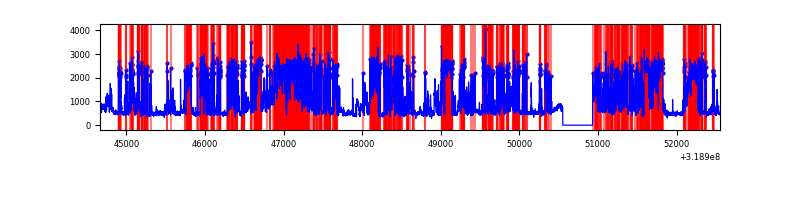 |
| C | 7890 | 7510 | 0 | 0 | 0.00% | 0.00% | 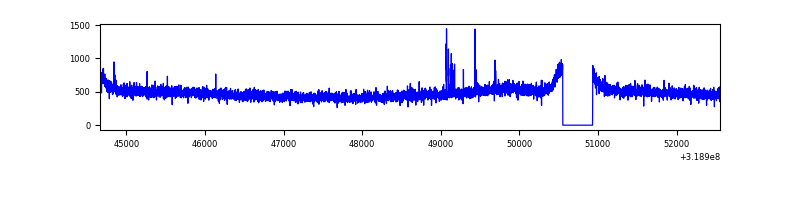 |
| D | 7890 | 7510 | 6 | 6 | 0.08% | 0.08% | 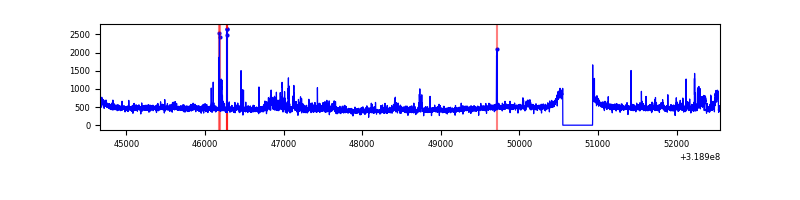 |
Top three noisy pixels from each quadrant. If the there are fewer than three noisy pixels in the level2.evt file, extra rows are filled as -1
| Pixel properties | Quadrant properties | ||||||
|---|---|---|---|---|---|---|---|
| Quadrant | DetID | PixID | Counts | Sigma | Mean | Median | Sigma |
| A | 13 | 254 | 11366 | 57.09 | 913 | 892 | 183.5 |
| A | 3 | 137 | 8726 | 42.7 | 913 | 892 | 183.5 |
| A | 0 | 226 | 7952 | 38.48 | 913 | 892 | 183.5 |
| B | 3 | 64 | 5111181 | 32924.27 | 797 | 775 | 155.2 |
| B | 0 | 229 | 237062 | 1522.3 | 797 | 775 | 155.2 |
| B | 12 | 111 | 19475 | 120.48 | 797 | 775 | 155.2 |
| C | 14 | 238 | 138175 | 659.14 | 882 | 884 | 208.3 |
| C | 10 | 9 | 17376 | 79.18 | 882 | 884 | 208.3 |
| C | 8 | 128 | 14123 | 63.56 | 882 | 884 | 208.3 |
| D | 1 | 52 | 110500 | 502.71 | 895 | 868 | 218.1 |
| D | 9 | 85 | 110071 | 500.75 | 895 | 868 | 218.1 |
| D | 2 | 234 | 30998 | 138.16 | 895 | 868 | 218.1 |
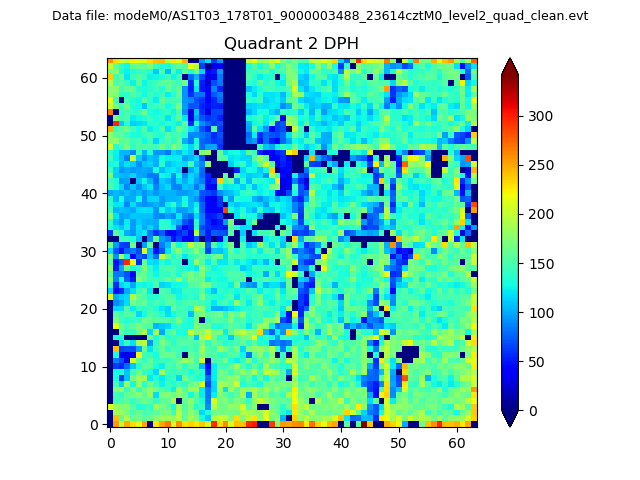
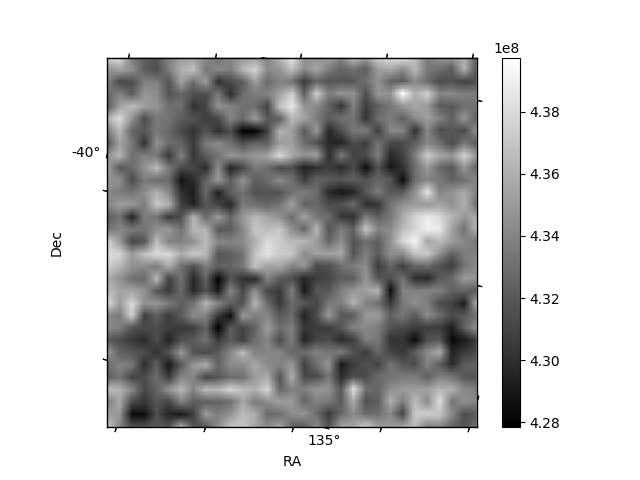
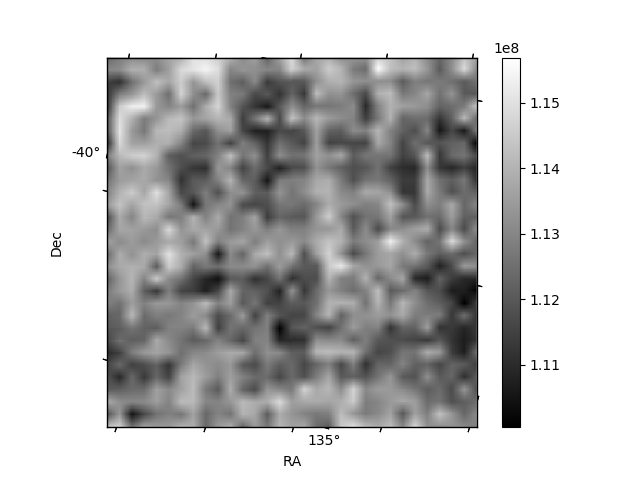
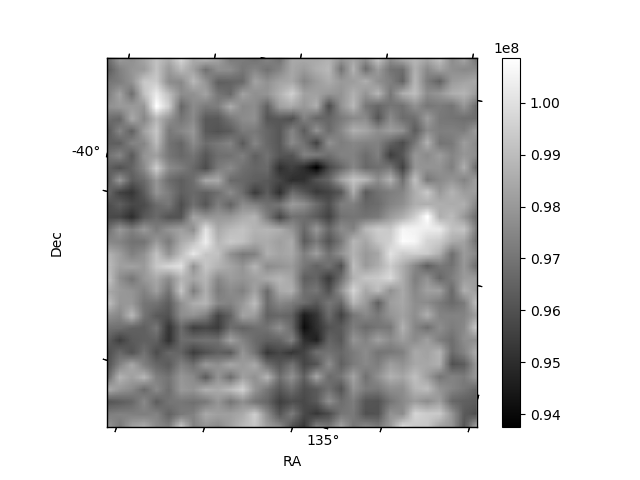
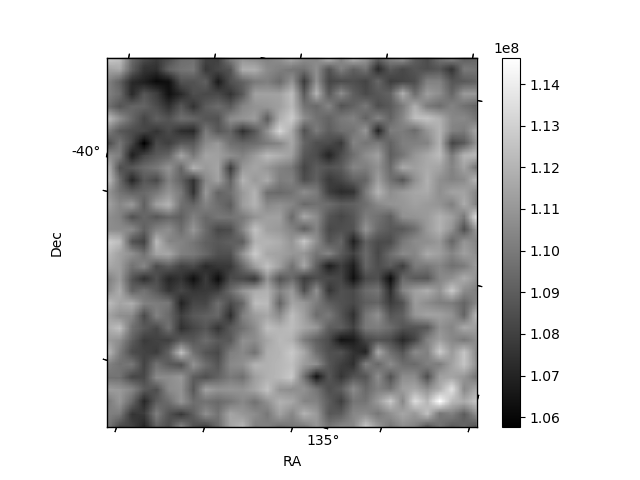
Histogram calculated using DETX and DETY for each event in the final _common_clean file
| Quadrant A | 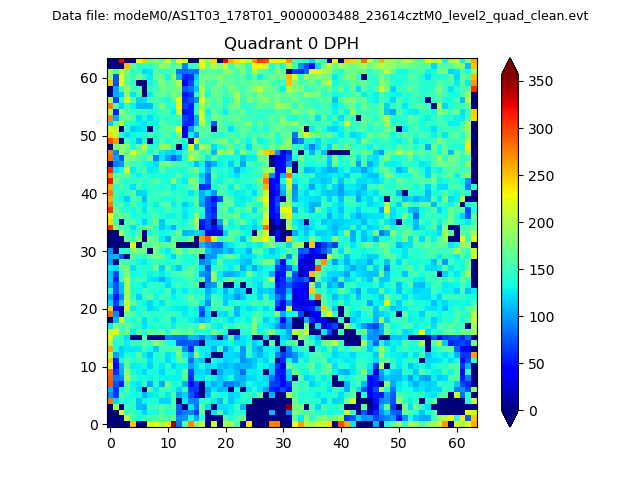 |
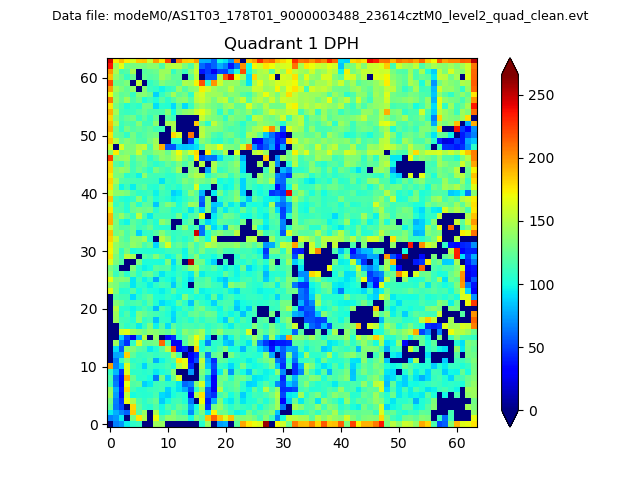 |
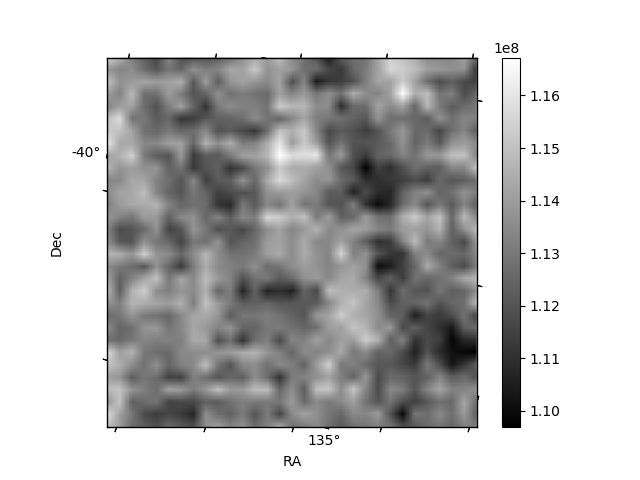
Quadrant B |
|---|---|---|---|
| Quadrant D | 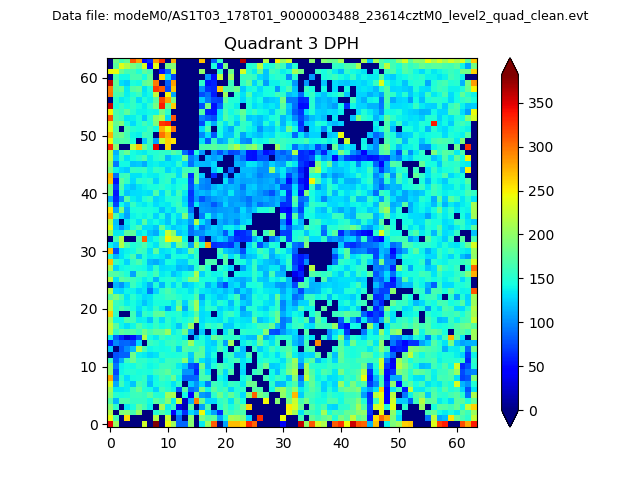 |
 |
Quadrant C |
| Plot type | Count rate plots | Images |
|---|---|---|
| Comparison with Poisson distribution Blue bars denote a histogram of data divided into 1 sec bins. Red curve is a Poisson curve with rate = median count rate of data. |
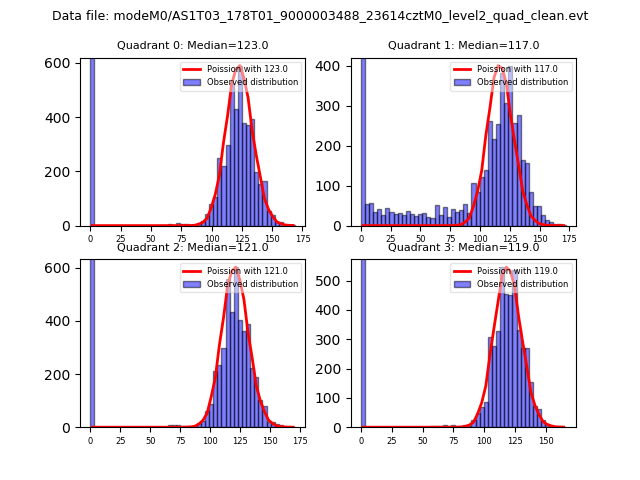 |
 |
| Quadrant-wise count rates Data is divided into 100 sec bins |
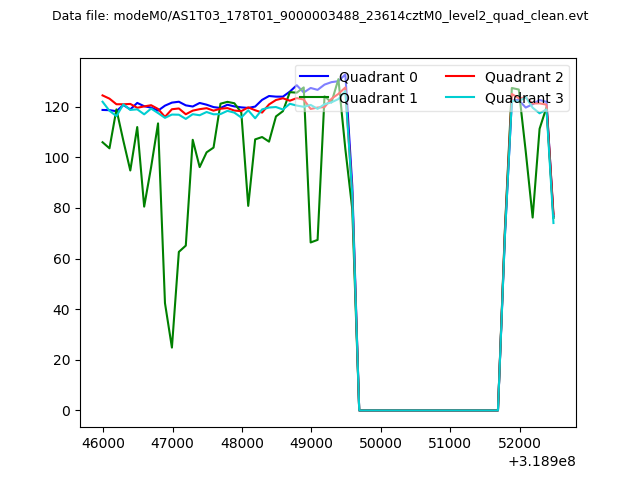 |
|
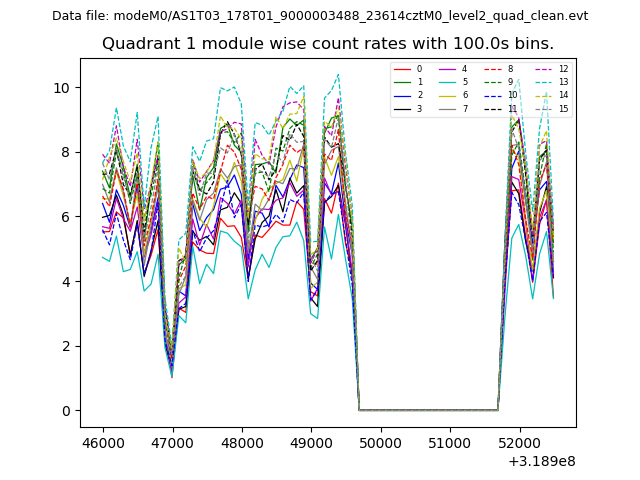
| Module-wise count rates for Quadrant A Data is divided into 100 sec bins |
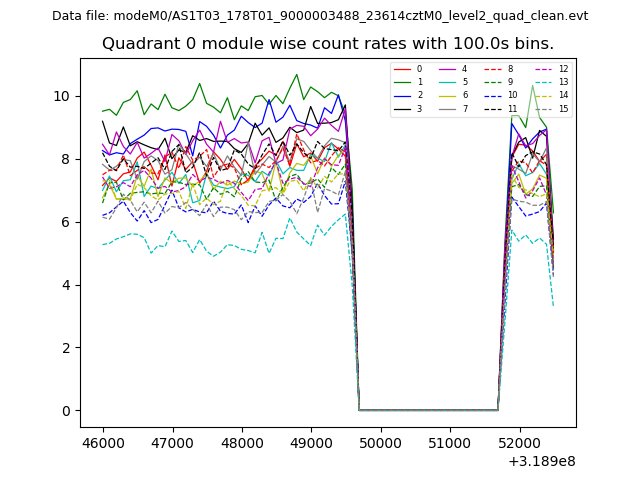 |
 |
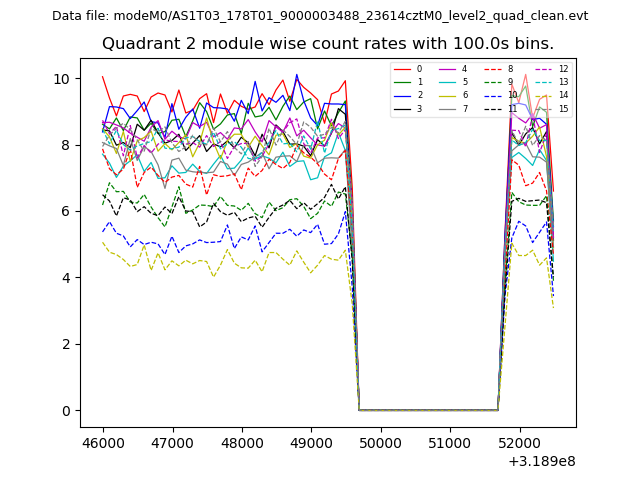
| Module-wise count rates for Quadrant B Data is divided into 100 sec bins |
 |
 |
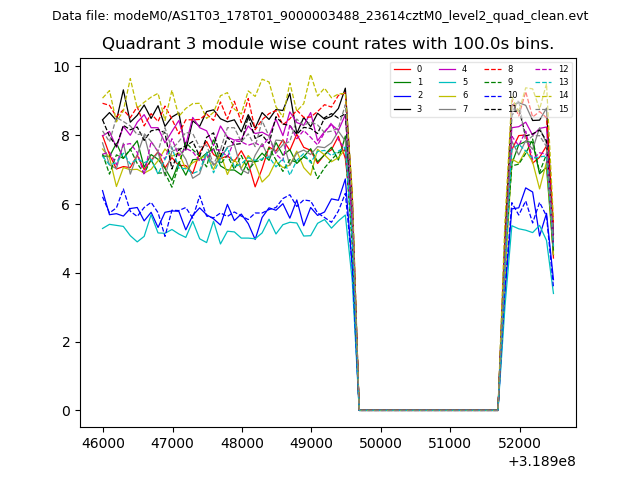
| Module-wise count rates for Quadrant C Data is divided into 100 sec bins |
 |
 |
| Module-wise count rates for Quadrant D Data is divided into 100 sec bins |
 |
 |
| Parameter | Plot |
|---|---|
| CZT HV Monitor | 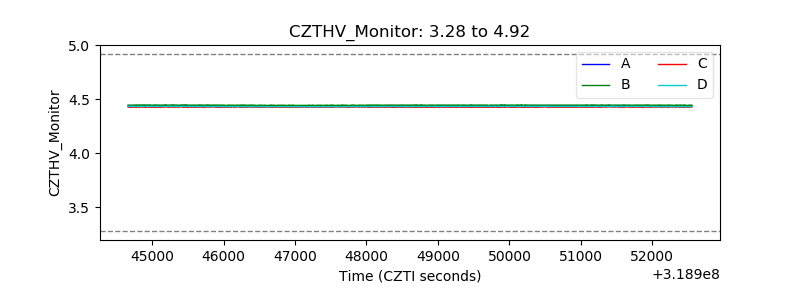 |
| D_VDD | 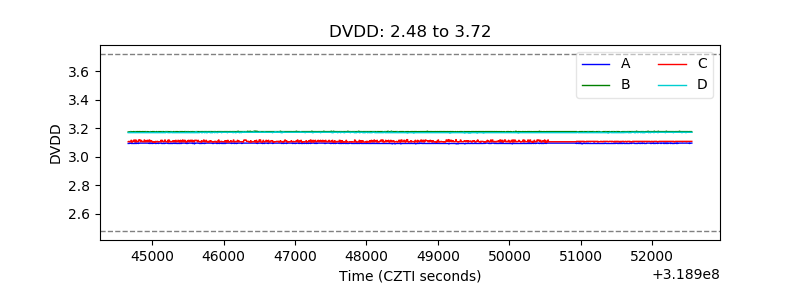 |
| Temperature 1 | 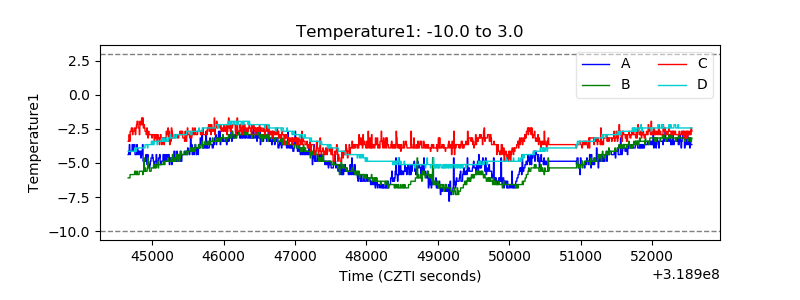 |
| Veto HV Monitor | 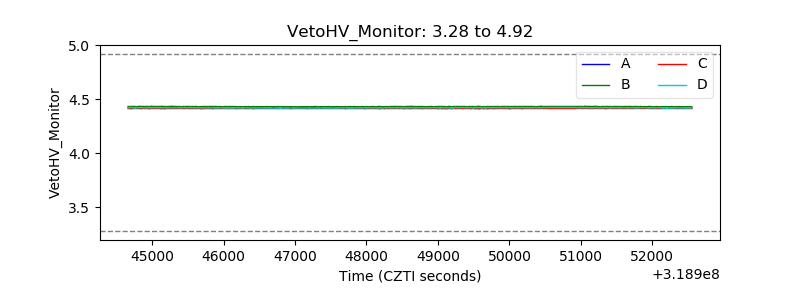 |
| Veto LLD | 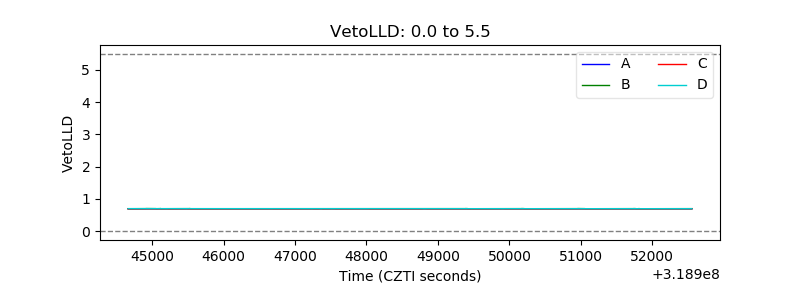 |
| Alpha Counter | 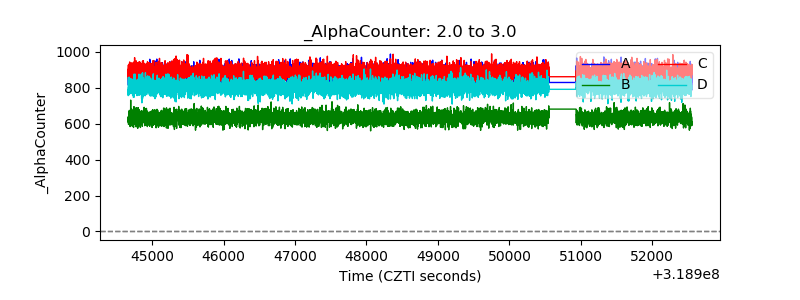 |
| _CPM_Rate | 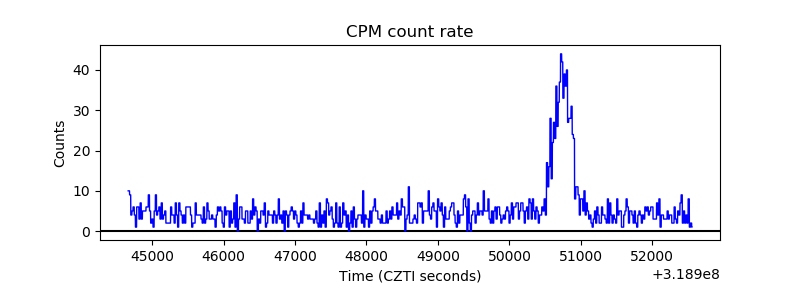 |
| CZT Counter | 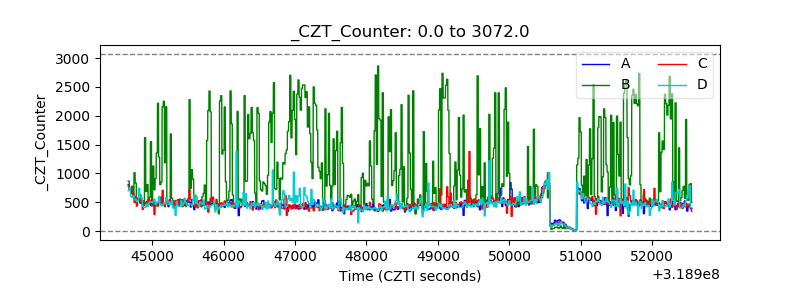 |
| +2.5 Volts monitor | 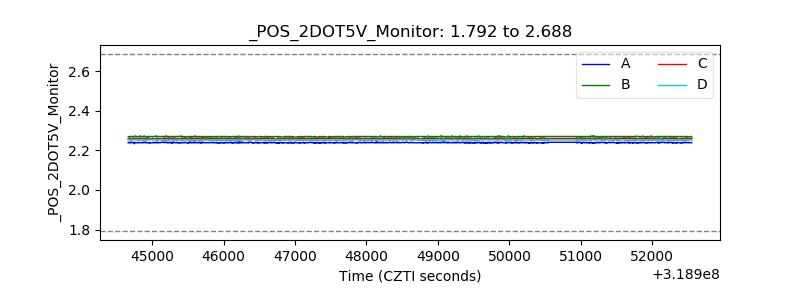 |
| +5 Volts monitor |  |
| _ROLL_ROT | 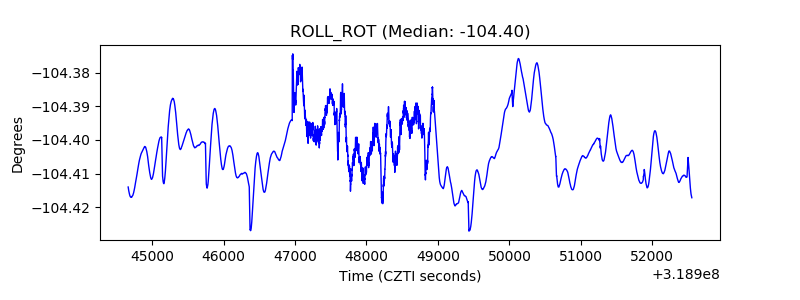 |
| _Roll_DEC | 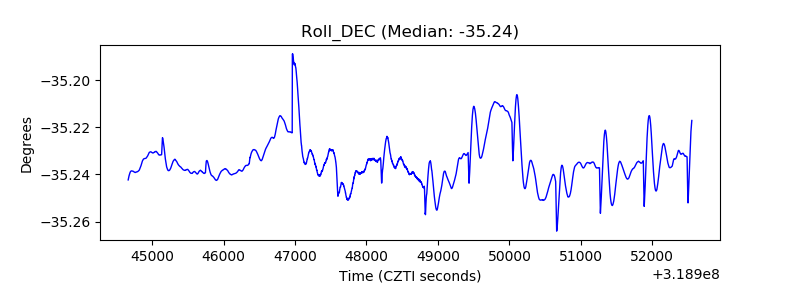 |
| _Roll_RA | 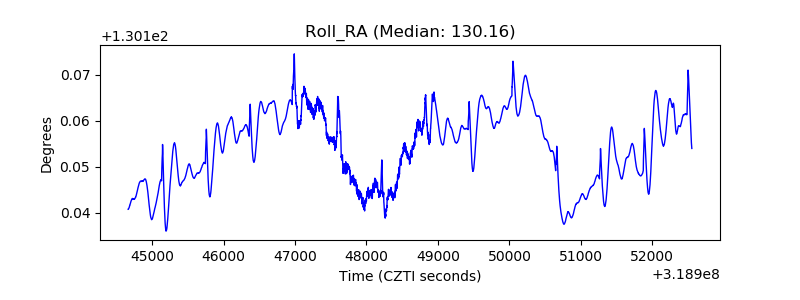 |
| Veto Counter | 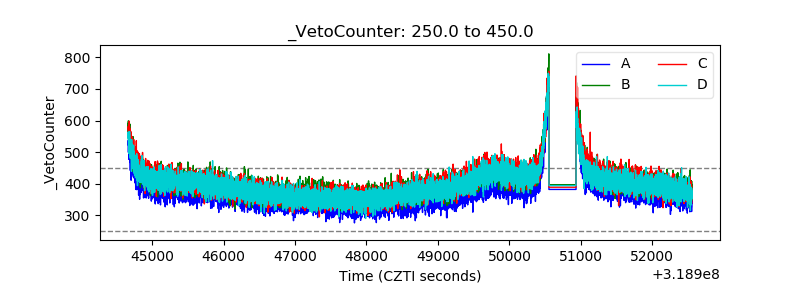 |