| Param | Original file | Final file |
|---|---|---|
| Filename | modeM0/AS1T03_178T01_9000003488_23616cztM0_level2.evt | modeM0/AS1T03_178T01_9000003488_23616cztM0_level2_quad_clean.evt |
| Size (bytes) | 1,008,040,320 | 165,559,680 |
| Size | 961.3 MB | 157.9 MB |
| Events in quadrant A | 5,622,012 | 1,092,089 |
| Events in quadrant B | 12,127,822 | 967,966 |
| Events in quadrant C | 5,714,885 | 1,067,033 |
| Events in quadrant D | 6,235,160 | 1,039,418 |
| Mode M0 | |||
|---|---|---|---|
| Quadrant | BADHDUFLAG | Total packets | Discarded packets |
| A | 0 | 24864 | 2 |
| B | 0 | 44166 | 2 |
| C | 0 | 25035 | 2 |
| D | 0 | 26945 | 2 |
| Mode M9 | |||
|---|---|---|---|
| Quadrant | BADHDUFLAG | Total packets | Discarded packets |
| A | 0 | 12 | 0 |
| B | 0 | 12 | 0 |
| C | 0 | 12 | 0 |
| D | 0 | 12 | 0 |
| Mode SS | |||
|---|---|---|---|
| Quadrant | BADHDUFLAG | Total packets | Discarded packets |
| A | 0 | 252 | 0 |
| B | 0 | 252 | 0 |
| C | 0 | 252 | 0 |
| D | 0 | 252 | 0 |
| Quadrant | Total seconds | Saturated seconds | Saturation percentage |
|---|---|---|---|
| A | 12241 | 42 | 0.343109% |
| B | 12241 | 2508 | 20.488522% |
| C | 12242 | 106 | 0.865872% |
| D | 12242 | 79 | 0.645319% |
Noise dominated data is calculated using 1-second bins in cleaned event files. If a bin has >2000 counts, and if more than 50% of those come from <1% of pixels, then it is considered to be noise-dominated and hence unusable.
| Quadrant | # 1 sec bins | Bins with >0 counts | Bins with >2000 counts | High rate bins dominated by noise | Noise dominated (total time) | Noise dominated (detector-on time) | Marked lightcurve |
|---|---|---|---|---|---|---|---|
| A | 13571 | 12241 | 0 | 0 | 0.00% | 0.00% | 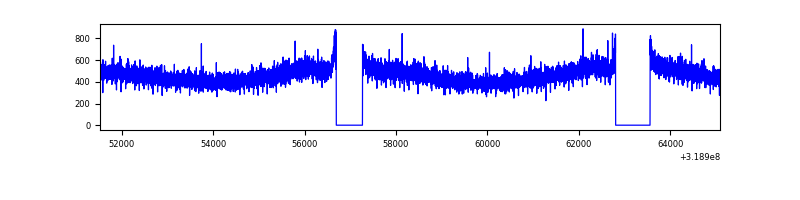 |
| B | 13570 | 12240 | 1806 | 1806 | 13.31% | 14.75% | 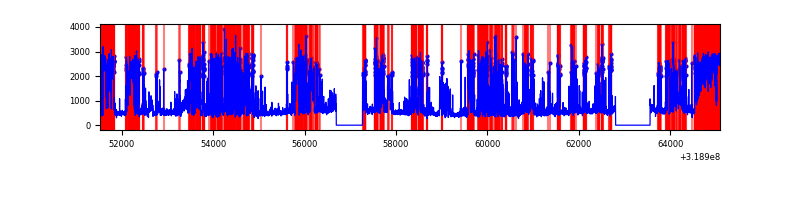 |
| C | 13572 | 12242 | 1 | 1 | 0.01% | 0.01% | 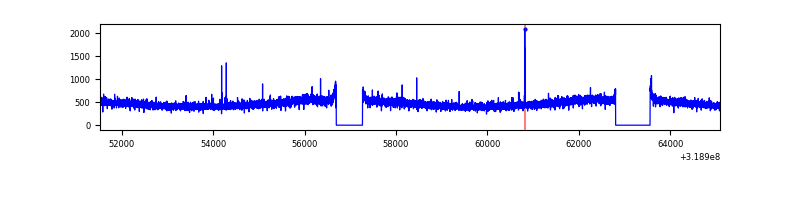 |
| D | 13572 | 12244 | 73 | 73 | 0.54% | 0.60% | 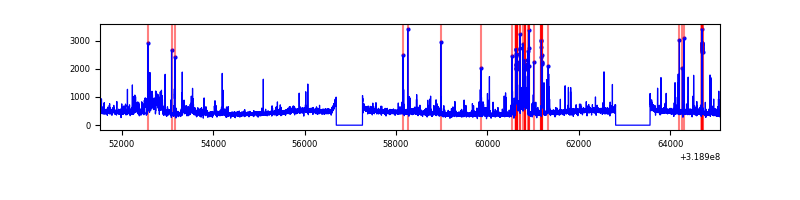 |
Top three noisy pixels from each quadrant. If the there are fewer than three noisy pixels in the level2.evt file, extra rows are filled as -1
| Pixel properties | Quadrant properties | ||||||
|---|---|---|---|---|---|---|---|
| Quadrant | DetID | PixID | Counts | Sigma | Mean | Median | Sigma |
| A | 13 | 254 | 18108 | 56.73 | 1459 | 1430 | 294.0 |
| A | 3 | 137 | 13583 | 41.33 | 1459 | 1430 | 294.0 |
| A | 0 | 226 | 12212 | 36.67 | 1459 | 1430 | 294.0 |
| B | 3 | 64 | 6824682 | 27173.49 | 1308 | 1275 | 251.1 |
| B | 0 | 229 | 87870 | 344.85 | 1308 | 1275 | 251.1 |
| B | 0 | 189 | 55601 | 216.35 | 1308 | 1275 | 251.1 |
| C | 14 | 238 | 221128 | 665.35 | 1402 | 1408 | 330.2 |
| C | 7 | 247 | 23630 | 67.29 | 1402 | 1408 | 330.2 |
| C | 13 | 61 | 9488 | 24.47 | 1402 | 1408 | 330.2 |
| D | 1 | 52 | 819800 | 2363.45 | 1414 | 1375 | 346.3 |
| D | 9 | 85 | 68269 | 193.18 | 1414 | 1375 | 346.3 |
| D | 2 | 234 | 49673 | 139.47 | 1414 | 1375 | 346.3 |
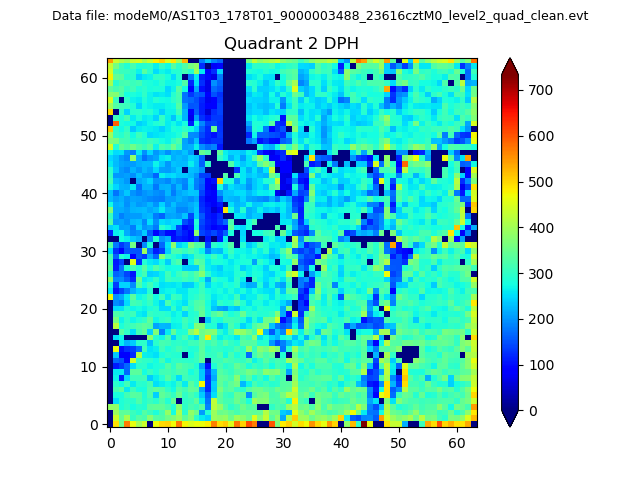
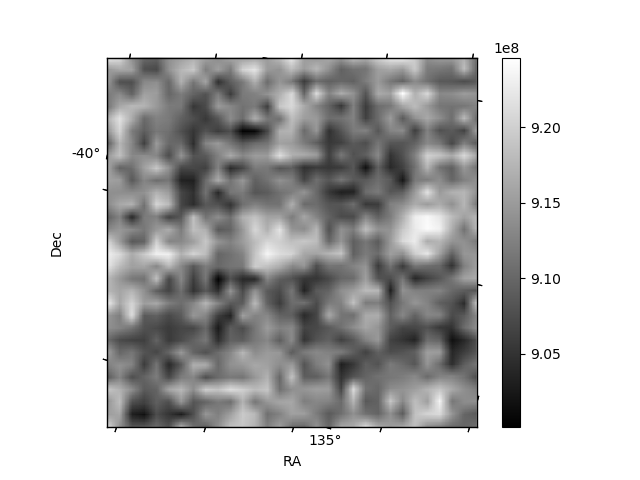
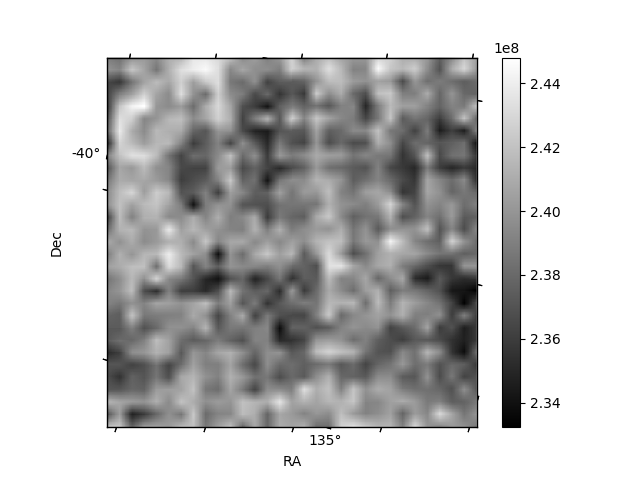
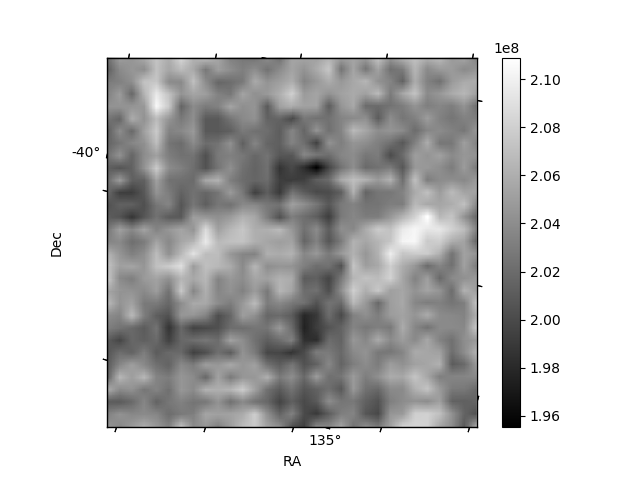
Histogram calculated using DETX and DETY for each event in the final _common_clean file
| Quadrant A | 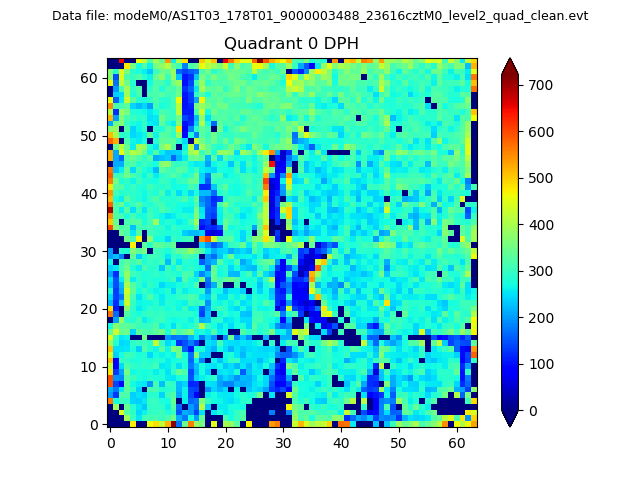 |
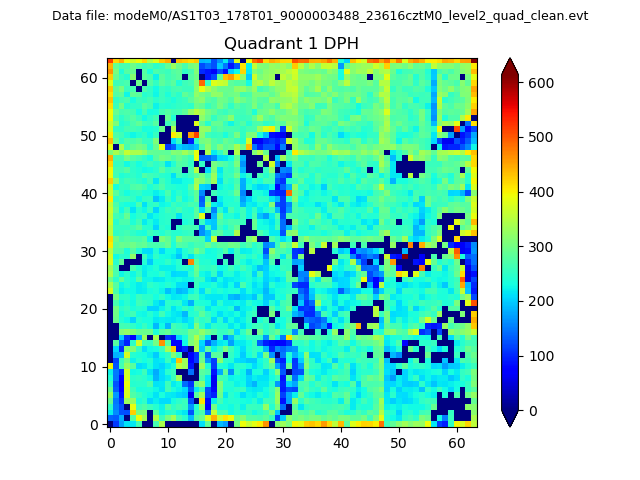 |
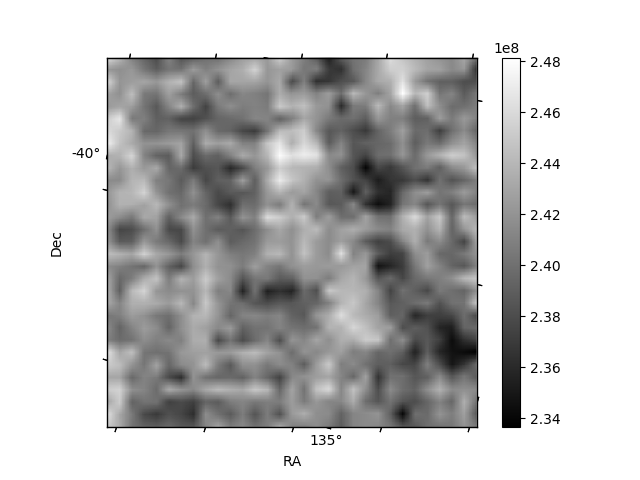
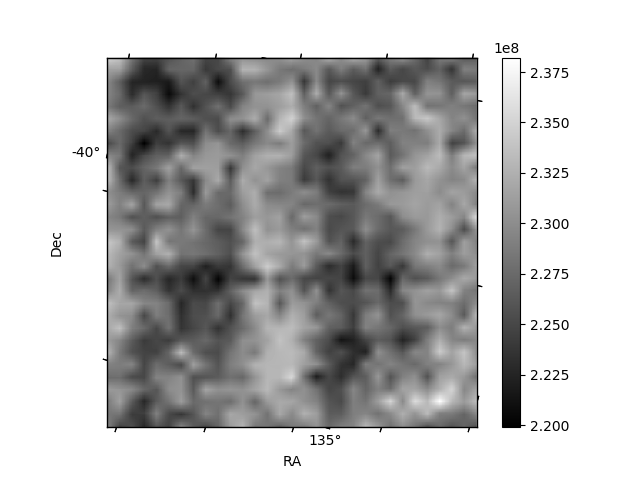
Quadrant B |
|---|---|---|---|
| Quadrant D | 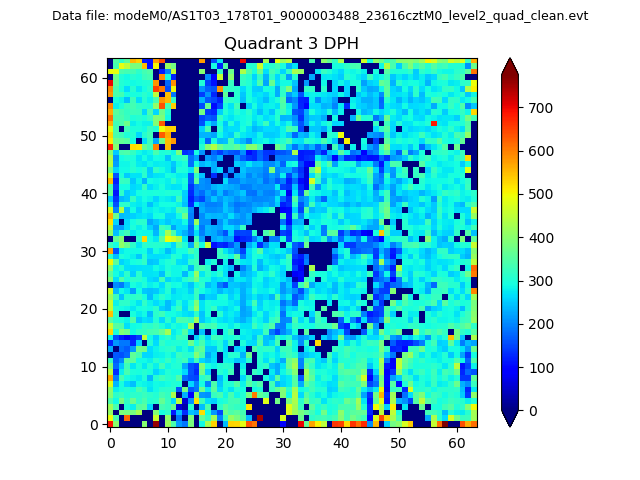 |
 |
Quadrant C |
| Plot type | Count rate plots | Images |
|---|---|---|
| Comparison with Poisson distribution Blue bars denote a histogram of data divided into 1 sec bins. Red curve is a Poisson curve with rate = median count rate of data. |
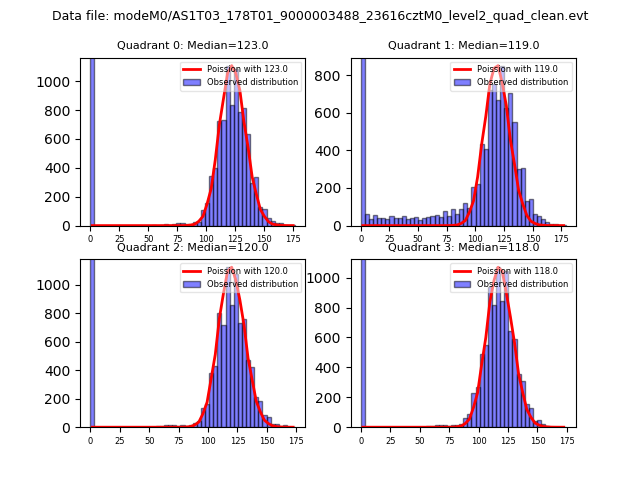 |
 |
| Quadrant-wise count rates Data is divided into 100 sec bins |
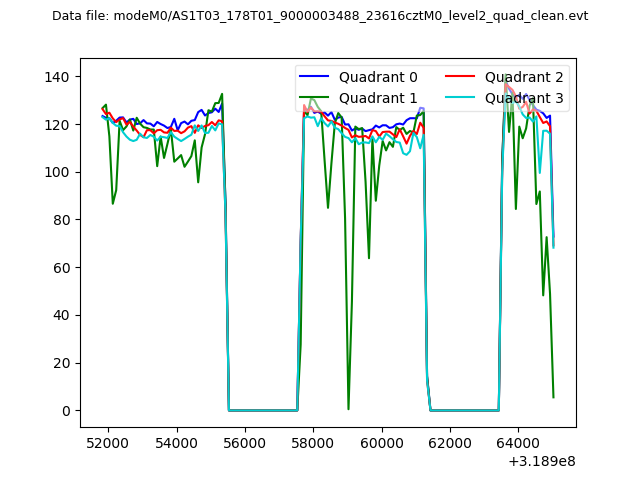 |
|
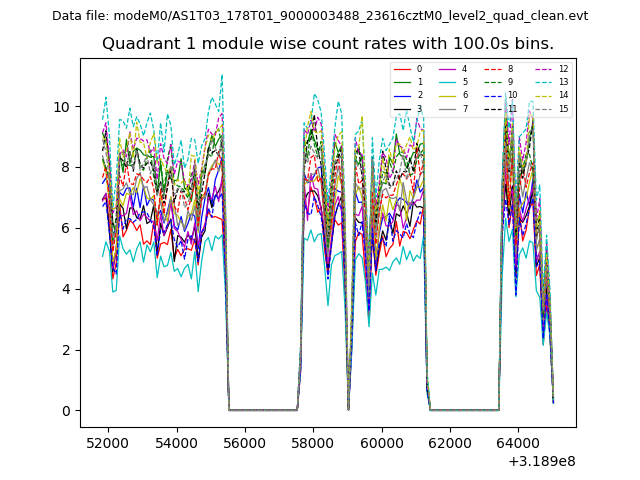
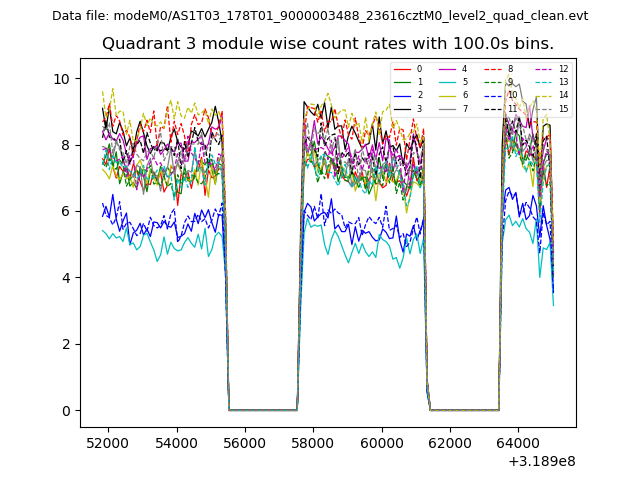
| Module-wise count rates for Quadrant A Data is divided into 100 sec bins |
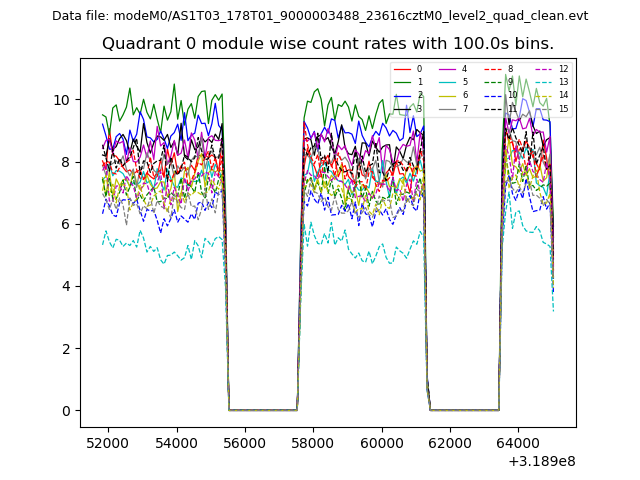 |
 |
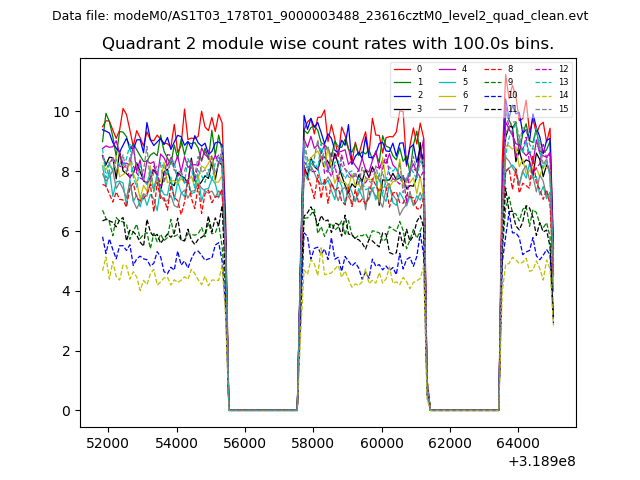
| Module-wise count rates for Quadrant B Data is divided into 100 sec bins |
 |
 |
| Module-wise count rates for Quadrant C Data is divided into 100 sec bins |
 |
 |
| Module-wise count rates for Quadrant D Data is divided into 100 sec bins |
 |
 |
| Parameter | Plot |
|---|---|
| CZT HV Monitor | 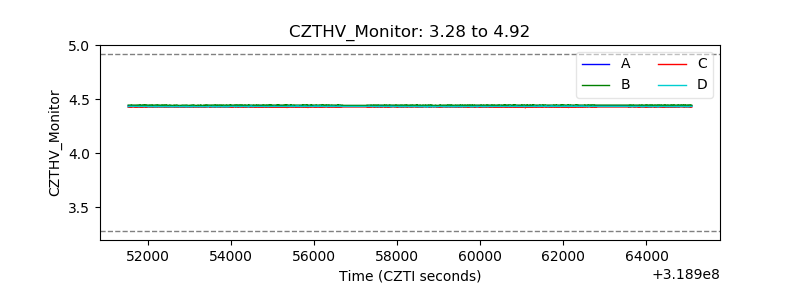 |
| D_VDD | 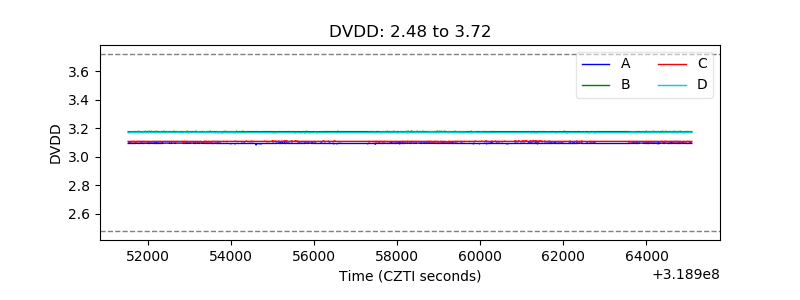 |
| Temperature 1 | 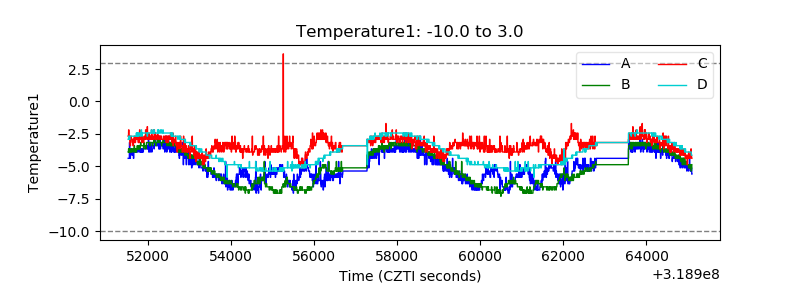 |
| Veto HV Monitor | 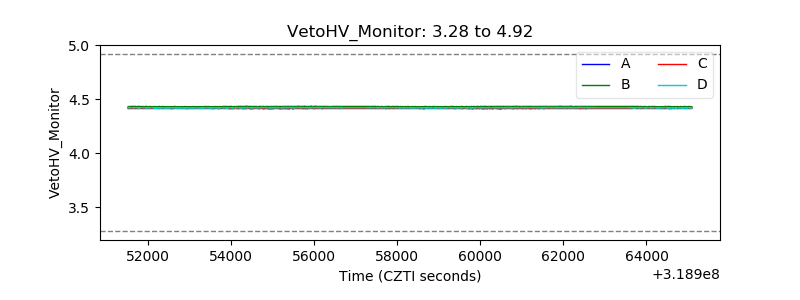 |
| Veto LLD | 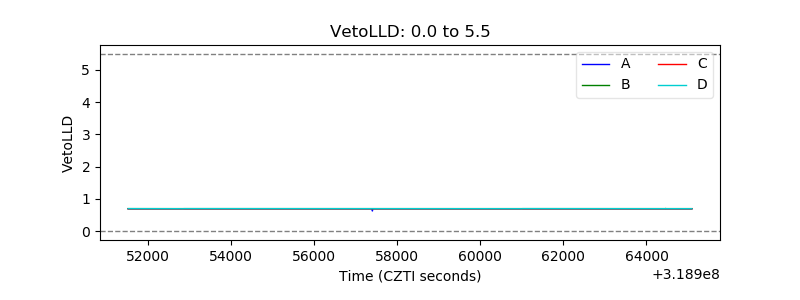 |
| Alpha Counter | 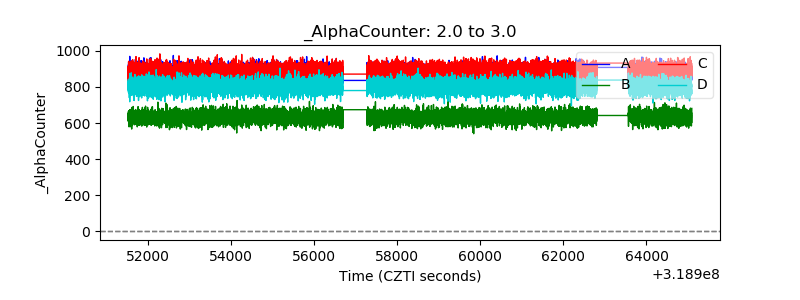 |
| _CPM_Rate | 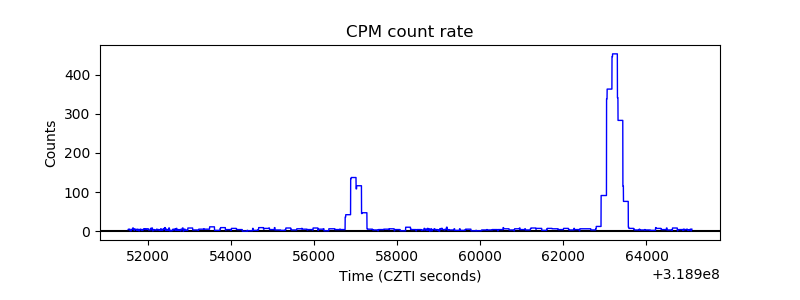 |
| CZT Counter | 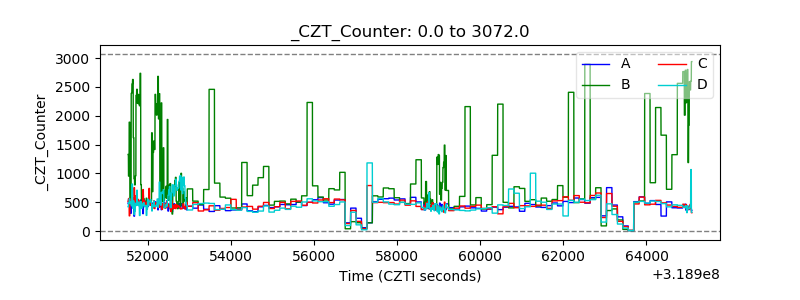 |
| +2.5 Volts monitor | 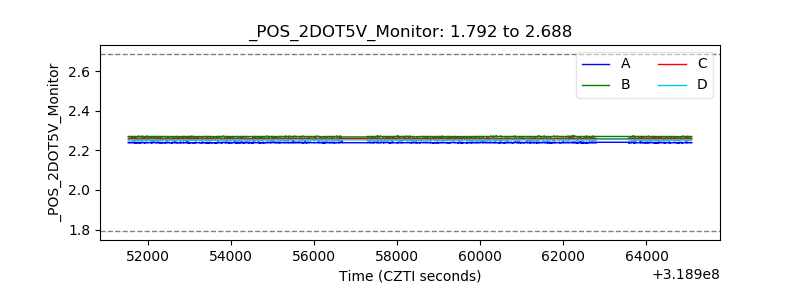 |
| +5 Volts monitor |  |
| _ROLL_ROT | 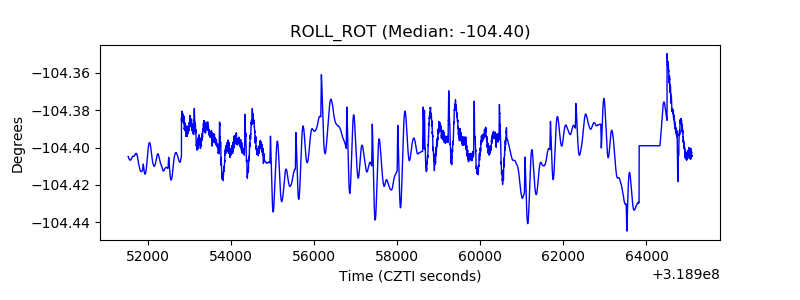 |
| _Roll_DEC | 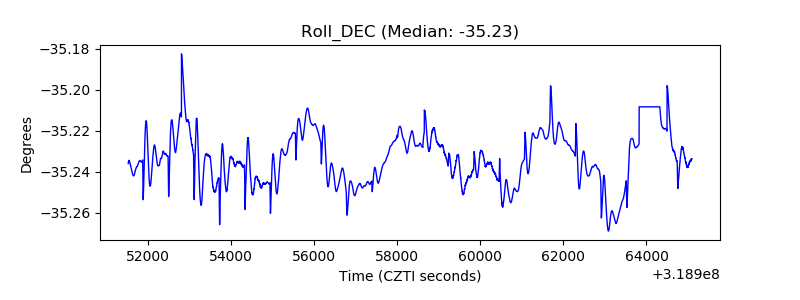 |
| _Roll_RA | 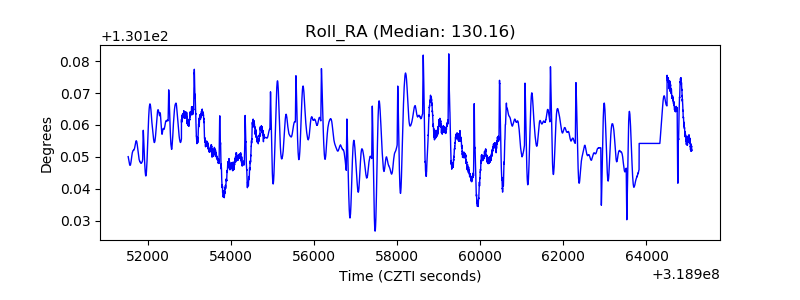 |
| Veto Counter | 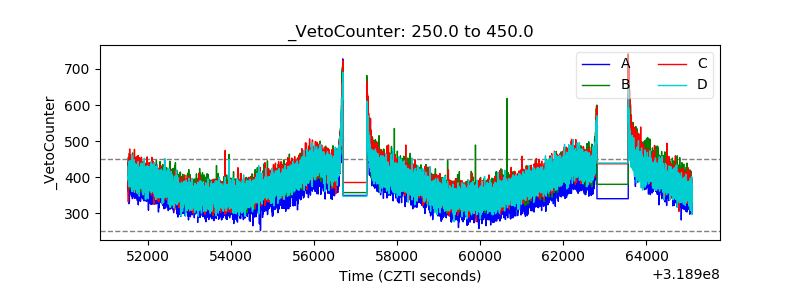 |