| Param | Original file | Final file |
|---|---|---|
| Filename | modeM0/AS1T03_178T01_9000003488_23617cztM0_level2.evt | modeM0/AS1T03_178T01_9000003488_23617cztM0_level2_quad_clean.evt |
| Size (bytes) | 585,774,720 | 92,350,080 |
| Size | 558.6 MB | 88.1 MB |
| Events in quadrant A | 3,102,514 | 618,950 |
| Events in quadrant B | 6,211,009 | 538,094 |
| Events in quadrant C | 3,164,365 | 600,612 |
| Events in quadrant D | 4,810,102 | 573,448 |
| Mode M0 | |||
|---|---|---|---|
| Quadrant | BADHDUFLAG | Total packets | Discarded packets |
| A | 0 | 13609 | 1 |
| B | 0 | 22857 | 1 |
| C | 0 | 13759 | 1 |
| D | 0 | 19097 | 1 |
| Mode M9 | |||
|---|---|---|---|
| Quadrant | BADHDUFLAG | Total packets | Discarded packets |
| A | 0 | 9 | 0 |
| B | 0 | 9 | 0 |
| C | 0 | 9 | 0 |
| D | 0 | 9 | 0 |
| Mode SS | |||
|---|---|---|---|
| Quadrant | BADHDUFLAG | Total packets | Discarded packets |
| A | 0 | 134 | 0 |
| B | 0 | 134 | 0 |
| C | 0 | 134 | 0 |
| D | 0 | 134 | 0 |
| Quadrant | Total seconds | Saturated seconds | Saturation percentage |
|---|---|---|---|
| A | 6673 | 30 | 0.449573% |
| B | 6674 | 1210 | 18.130057% |
| C | 6674 | 68 | 1.018879% |
| D | 6674 | 318 | 4.764759% |
Noise dominated data is calculated using 1-second bins in cleaned event files. If a bin has >2000 counts, and if more than 50% of those come from <1% of pixels, then it is considered to be noise-dominated and hence unusable.
| Quadrant | # 1 sec bins | Bins with >0 counts | Bins with >2000 counts | High rate bins dominated by noise | Noise dominated (total time) | Noise dominated (detector-on time) | Marked lightcurve |
|---|---|---|---|---|---|---|---|
| A | 7568 | 6673 | 0 | 0 | 0.00% | 0.00% | 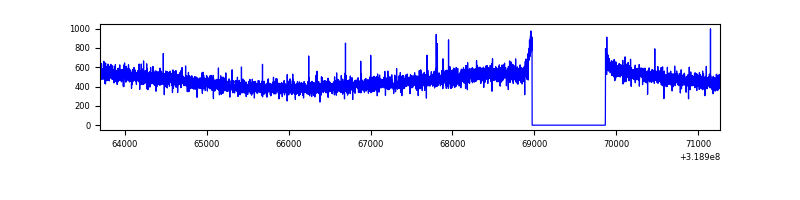 |
| B | 7569 | 6674 | 1053 | 1053 | 13.91% | 15.78% | 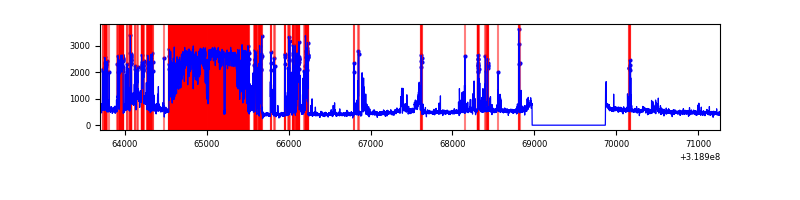 |
| C | 7569 | 6674 | 1 | 1 | 0.01% | 0.01% | 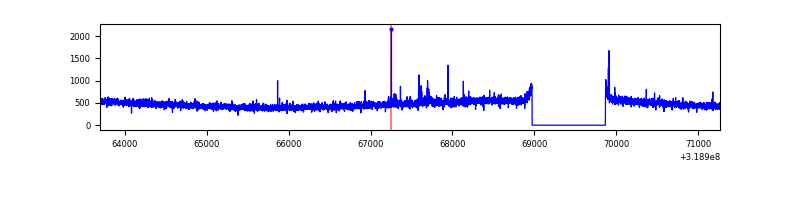 |
| D | 7569 | 6674 | 286 | 286 | 3.78% | 4.29% | 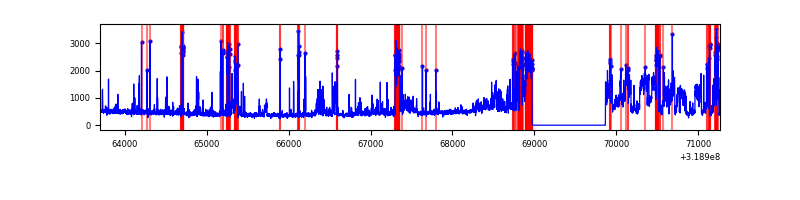 |
Top three noisy pixels from each quadrant. If the there are fewer than three noisy pixels in the level2.evt file, extra rows are filled as -1
| Pixel properties | Quadrant properties | ||||||
|---|---|---|---|---|---|---|---|
| Quadrant | DetID | PixID | Counts | Sigma | Mean | Median | Sigma |
| A | 13 | 254 | 9369 | 52.8 | 805 | 790 | 162.5 |
| A | 3 | 137 | 7451 | 40.99 | 805 | 790 | 162.5 |
| A | 0 | 226 | 6676 | 36.22 | 805 | 790 | 162.5 |
| B | 3 | 64 | 3229870 | 22755.88 | 731 | 713 | 141.9 |
| B | 0 | 229 | 74019 | 516.59 | 731 | 713 | 141.9 |
| B | 14 | 207 | 19166 | 130.04 | 731 | 713 | 141.9 |
| C | 14 | 238 | 122010 | 667.36 | 769 | 772 | 181.7 |
| C | 0 | 10 | 20957 | 111.11 | 769 | 772 | 181.7 |
| C | 7 | 247 | 13229 | 68.57 | 769 | 772 | 181.7 |
| D | 1 | 52 | 1954666 | 10644.0 | 754 | 732 | 183.6 |
| D | 2 | 234 | 26374 | 139.68 | 754 | 732 | 183.6 |
| D | 9 | 85 | 7392 | 36.28 | 754 | 732 | 183.6 |
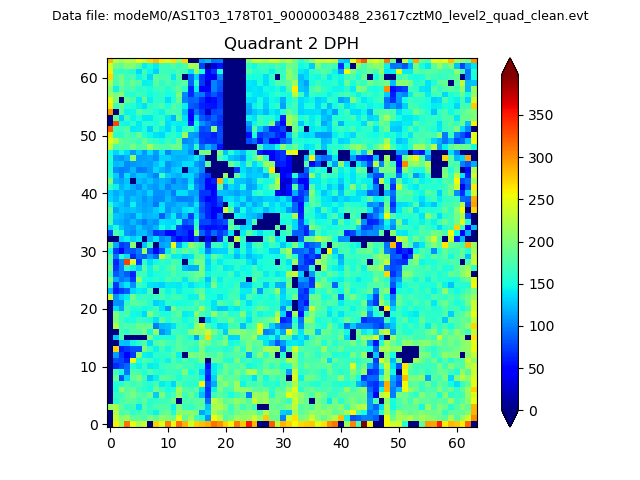
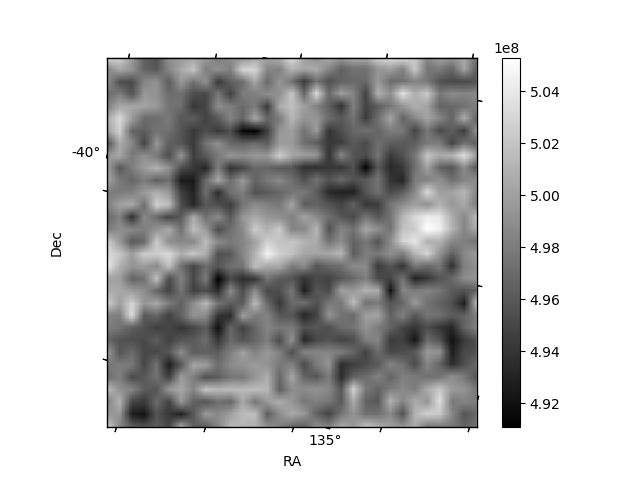
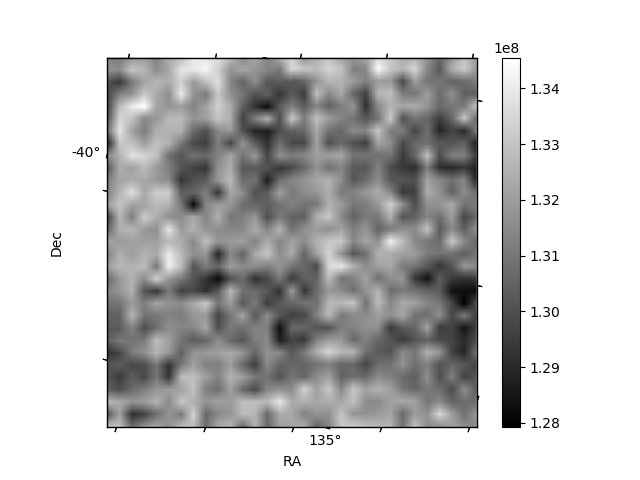
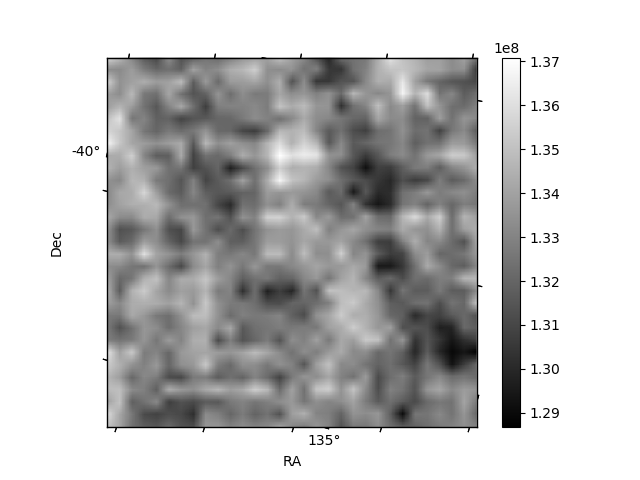
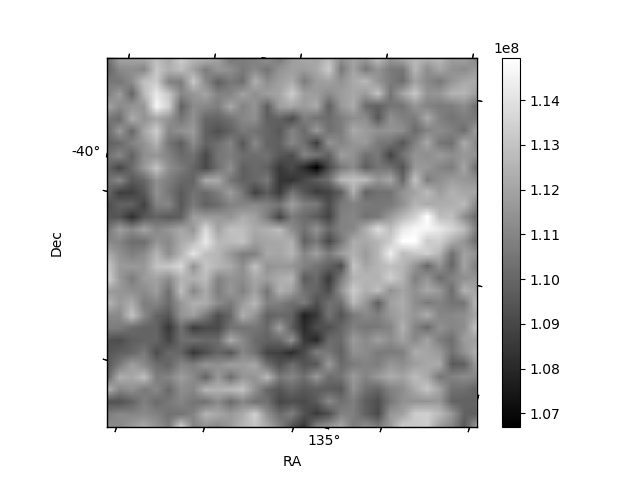
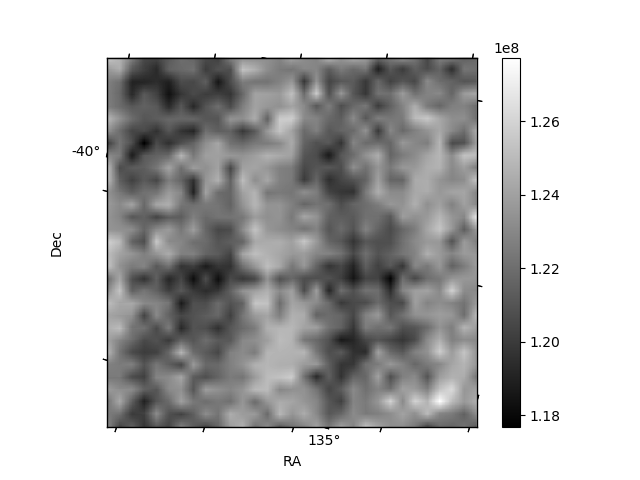
Histogram calculated using DETX and DETY for each event in the final _common_clean file
| Quadrant A | 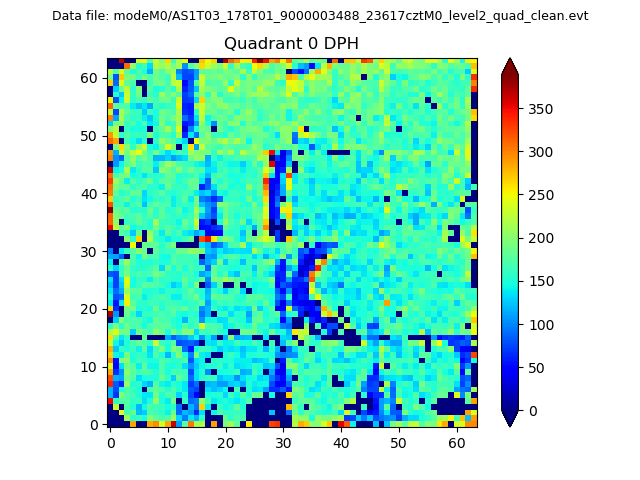 |
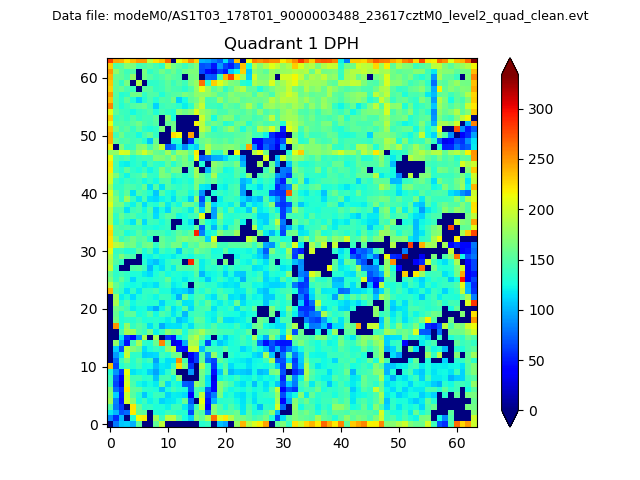 |
Quadrant B |
|---|---|---|---|
| Quadrant D | 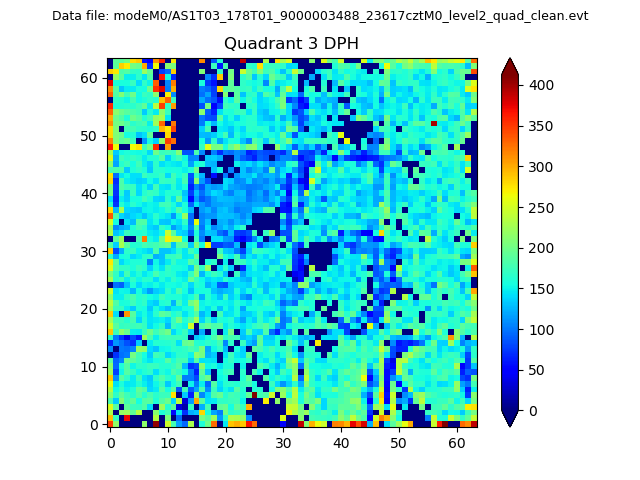 |
 |
Quadrant C |
| Plot type | Count rate plots | Images |
|---|---|---|
| Comparison with Poisson distribution Blue bars denote a histogram of data divided into 1 sec bins. Red curve is a Poisson curve with rate = median count rate of data. |
 |
 |
| Quadrant-wise count rates Data is divided into 100 sec bins |
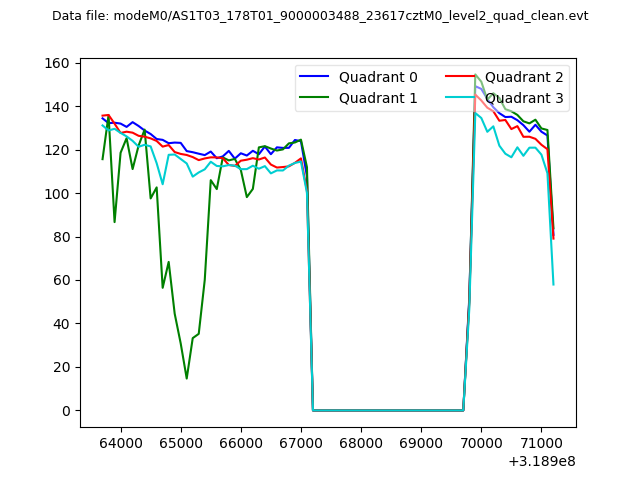 |
|
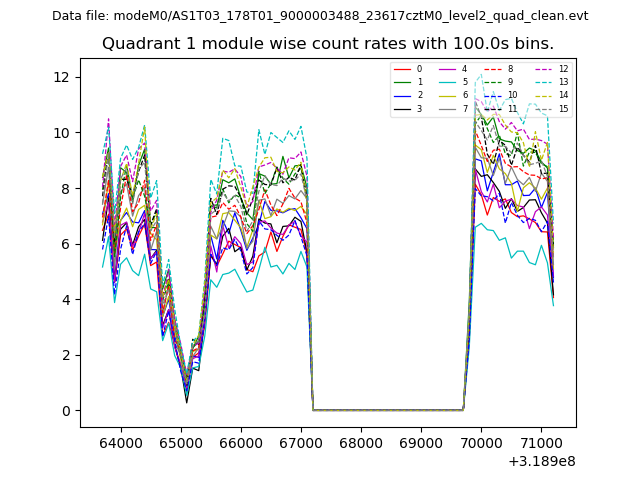
| Module-wise count rates for Quadrant A Data is divided into 100 sec bins |
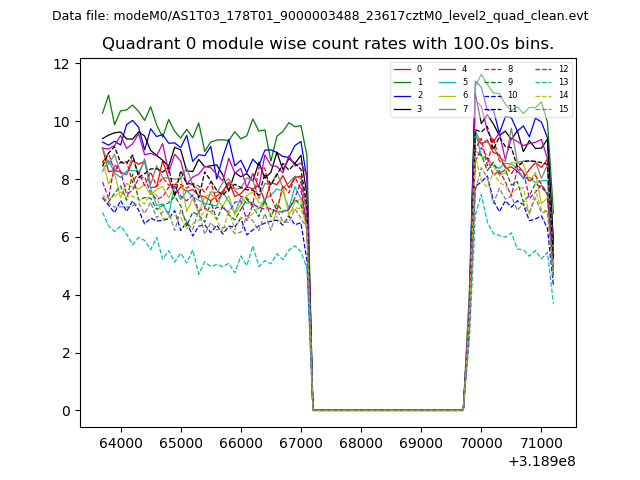 |
 |
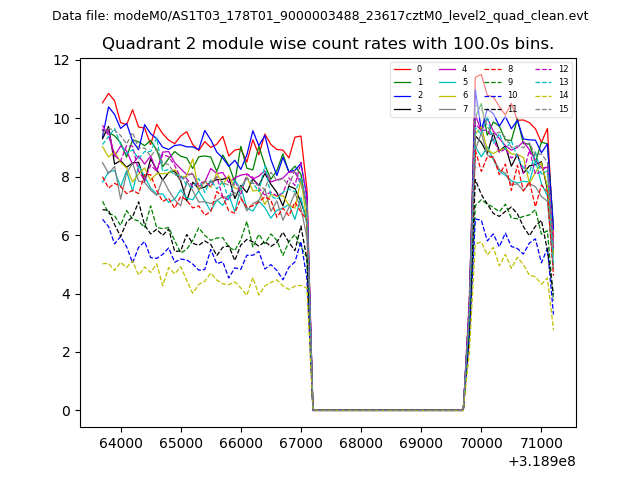
| Module-wise count rates for Quadrant B Data is divided into 100 sec bins |
 |
 |
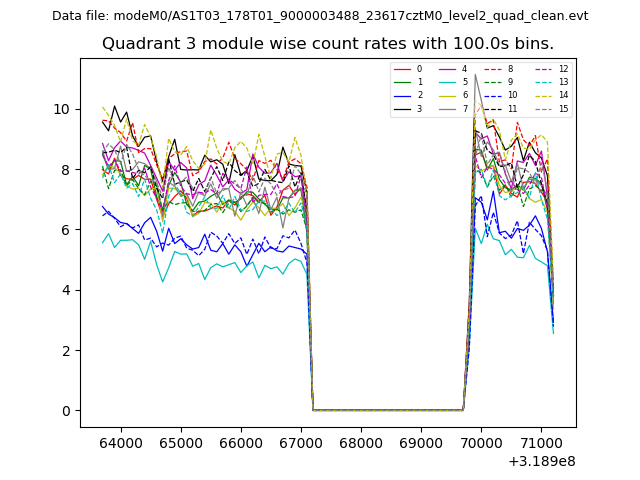
| Module-wise count rates for Quadrant C Data is divided into 100 sec bins |
 |
 |
| Module-wise count rates for Quadrant D Data is divided into 100 sec bins |
 |
 |
| Parameter | Plot |
|---|---|
| CZT HV Monitor | 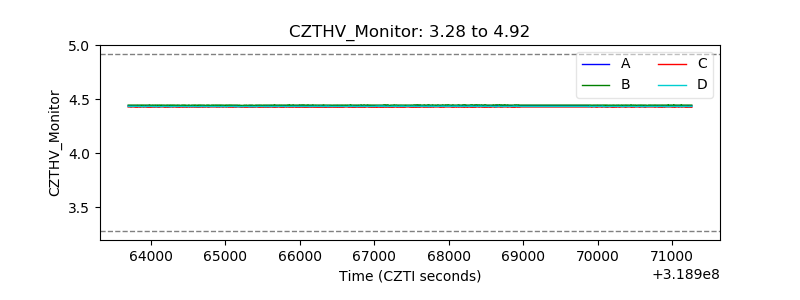 |
| D_VDD | 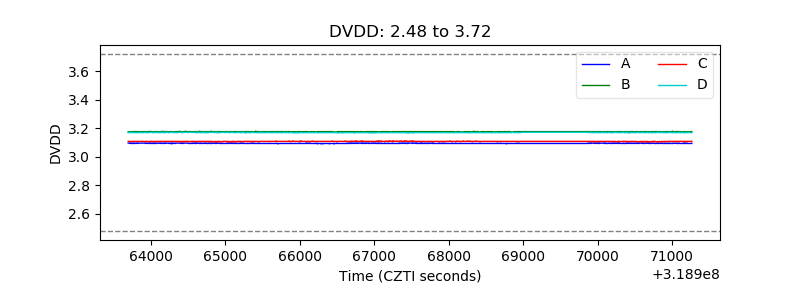 |
| Temperature 1 | 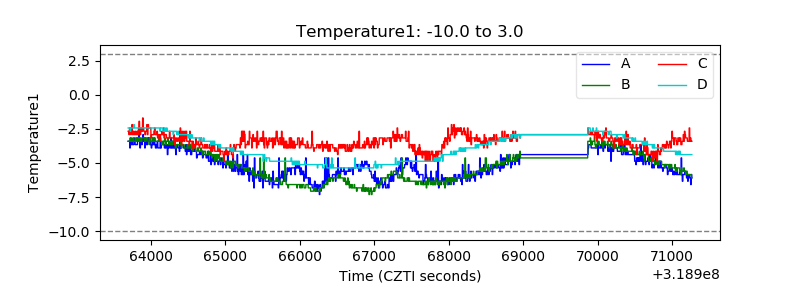 |
| Veto HV Monitor | 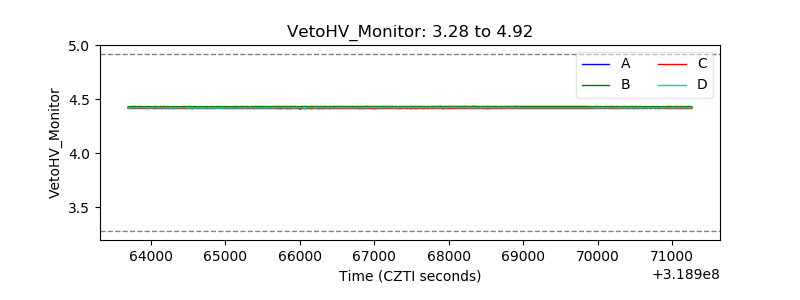 |
| Veto LLD | 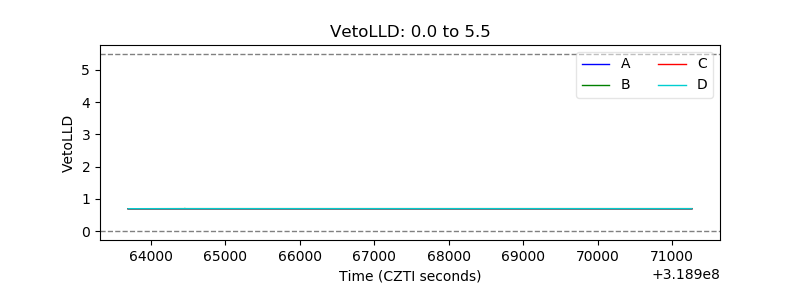 |
| Alpha Counter | 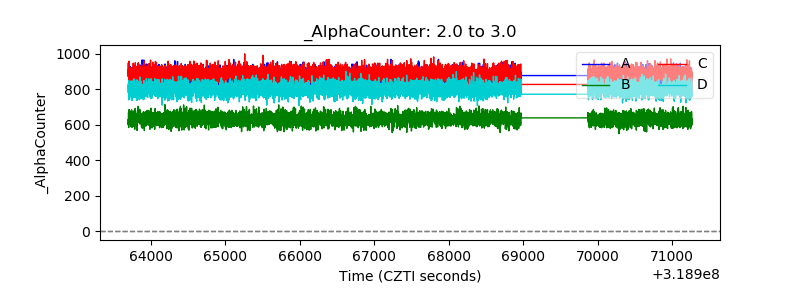 |
| _CPM_Rate | 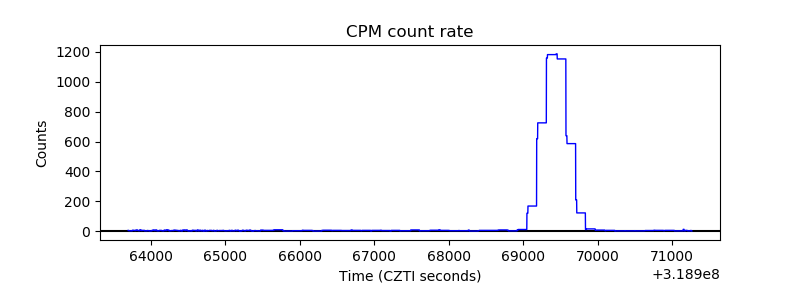 |
| CZT Counter | 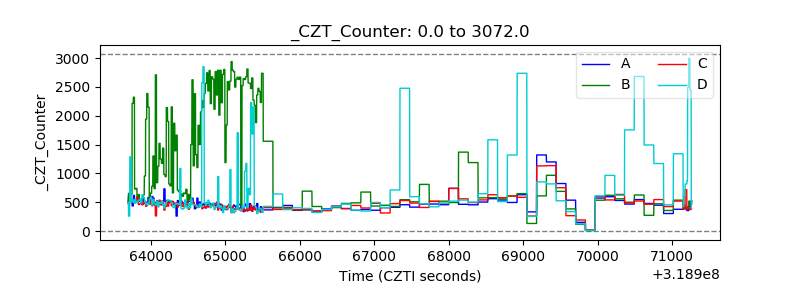 |
| +2.5 Volts monitor |  |
| +5 Volts monitor | 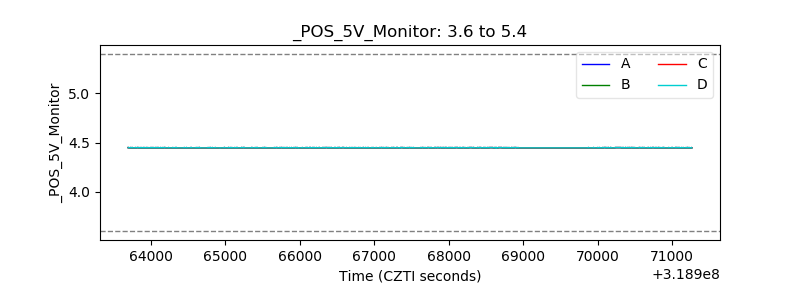 |
| _ROLL_ROT | 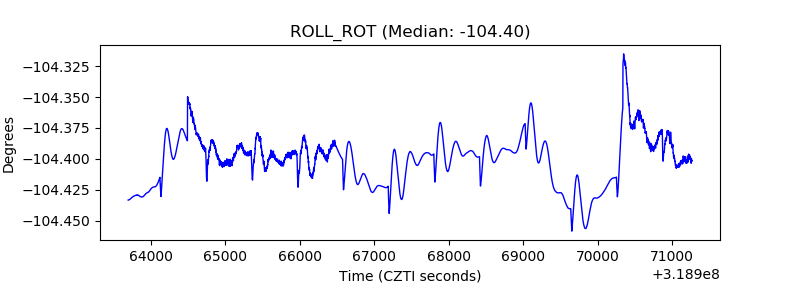 |
| _Roll_DEC | 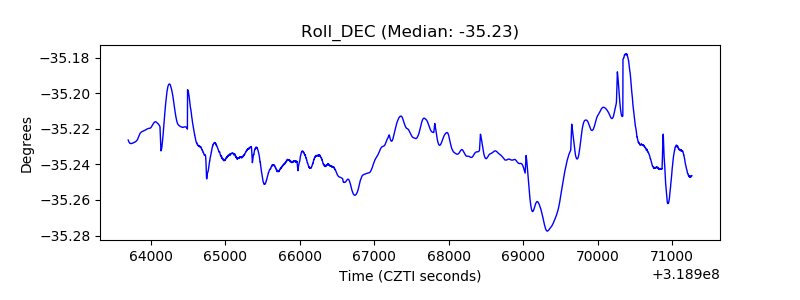 |
| _Roll_RA | 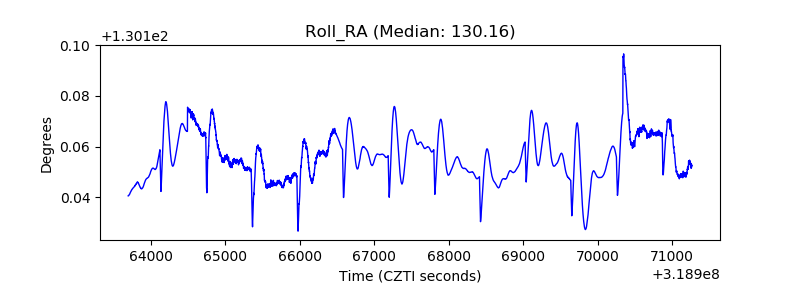 |
| Veto Counter | 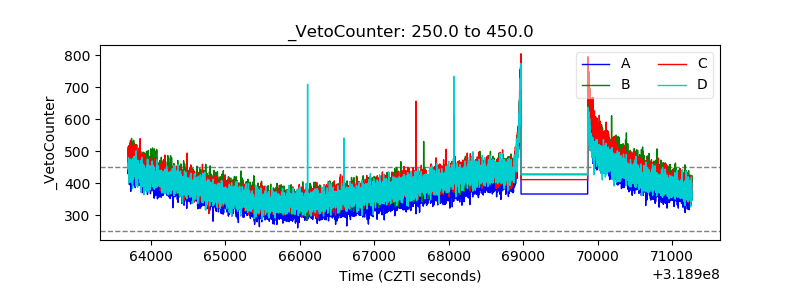 |