| Param | Original file | Final file |
|---|---|---|
| Filename | modeM0/AS1T03_178T01_9000003488_23618cztM0_level2.evt | modeM0/AS1T03_178T01_9000003488_23618cztM0_level2_quad_clean.evt |
| Size (bytes) | 740,839,680 | 89,965,440 |
| Size | 706.5 MB | 85.8 MB |
| Events in quadrant A | 3,254,720 | 608,517 |
| Events in quadrant B | 5,306,211 | 573,919 |
| Events in quadrant C | 3,334,063 | 589,979 |
| Events in quadrant D | 10,077,736 | 473,265 |
| Mode M0 | |||
|---|---|---|---|
| Quadrant | BADHDUFLAG | Total packets | Discarded packets |
| A | 0 | 14165 | 2 |
| B | 0 | 20307 | 2 |
| C | 0 | 14290 | 2 |
| D | 0 | 34672 | 4 |
| Mode M9 | |||
|---|---|---|---|
| Quadrant | BADHDUFLAG | Total packets | Discarded packets |
| A | 0 | 19 | 0 |
| B | 0 | 19 | 0 |
| C | 0 | 19 | 0 |
| D | 0 | 19 | 0 |
| Mode SS | |||
|---|---|---|---|
| Quadrant | BADHDUFLAG | Total packets | Discarded packets |
| A | 0 | 142 | 0 |
| B | 0 | 142 | 0 |
| C | 0 | 142 | 0 |
| D | 0 | 142 | 0 |
| Quadrant | Total seconds | Saturated seconds | Saturation percentage |
|---|---|---|---|
| A | 6855 | 39 | 0.568928% |
| B | 6856 | 795 | 11.595683% |
| C | 6856 | 77 | 1.123104% |
| D | 6855 | 2230 | 32.530999% |
Noise dominated data is calculated using 1-second bins in cleaned event files. If a bin has >2000 counts, and if more than 50% of those come from <1% of pixels, then it is considered to be noise-dominated and hence unusable.
| Quadrant | # 1 sec bins | Bins with >0 counts | Bins with >2000 counts | High rate bins dominated by noise | Noise dominated (total time) | Noise dominated (detector-on time) | Marked lightcurve |
|---|---|---|---|---|---|---|---|
| A | 8795 | 6856 | 0 | 0 | 0.00% | 0.00% | 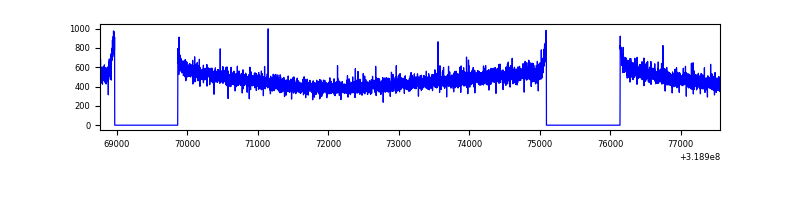 |
| B | 8796 | 6856 | 526 | 526 | 5.98% | 7.67% | 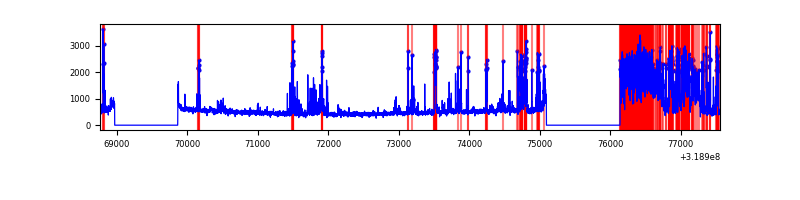 |
| C | 8796 | 6857 | 0 | 0 | 0.00% | 0.00% | 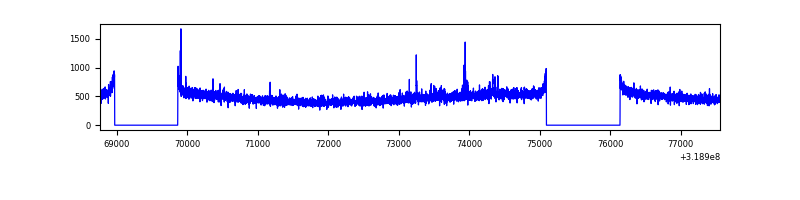 |
| D | 8795 | 6856 | 2179 | 2179 | 24.78% | 31.78% | 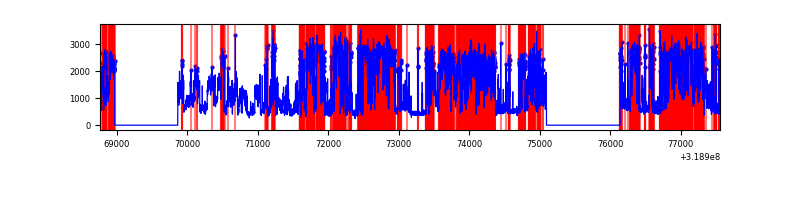 |
Top three noisy pixels from each quadrant. If the there are fewer than three noisy pixels in the level2.evt file, extra rows are filled as -1
| Pixel properties | Quadrant properties | ||||||
|---|---|---|---|---|---|---|---|
| Quadrant | DetID | PixID | Counts | Sigma | Mean | Median | Sigma |
| A | 13 | 254 | 9888 | 53.46 | 844 | 827 | 169.5 |
| A | 3 | 137 | 7887 | 41.65 | 844 | 827 | 169.5 |
| A | 0 | 226 | 7220 | 37.72 | 844 | 827 | 169.5 |
| B | 3 | 64 | 2092423 | 13564.35 | 804 | 782 | 154.2 |
| B | 0 | 189 | 20773 | 129.64 | 804 | 782 | 154.2 |
| B | 12 | 111 | 19317 | 120.2 | 804 | 782 | 154.2 |
| C | 14 | 238 | 128131 | 665.59 | 810 | 815 | 191.3 |
| C | 7 | 247 | 29529 | 150.11 | 810 | 815 | 191.3 |
| C | 0 | 10 | 23533 | 118.77 | 810 | 815 | 191.3 |
| D | 1 | 52 | 7409800 | 43493.44 | 704 | 684 | 170.4 |
| D | 2 | 234 | 23437 | 133.57 | 704 | 684 | 170.4 |
| D | 12 | 233 | 17116 | 96.46 | 704 | 684 | 170.4 |
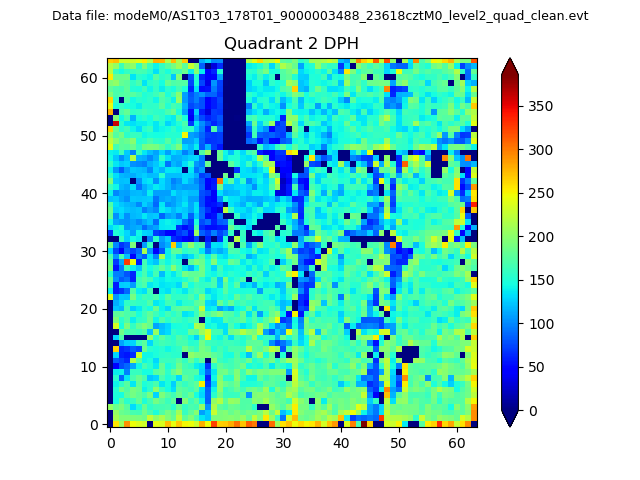
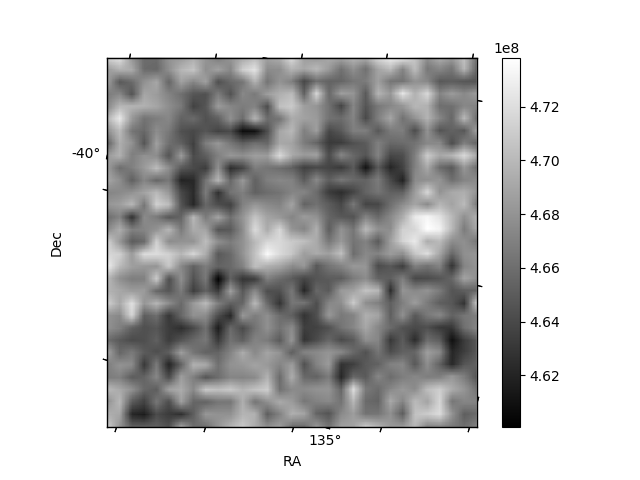
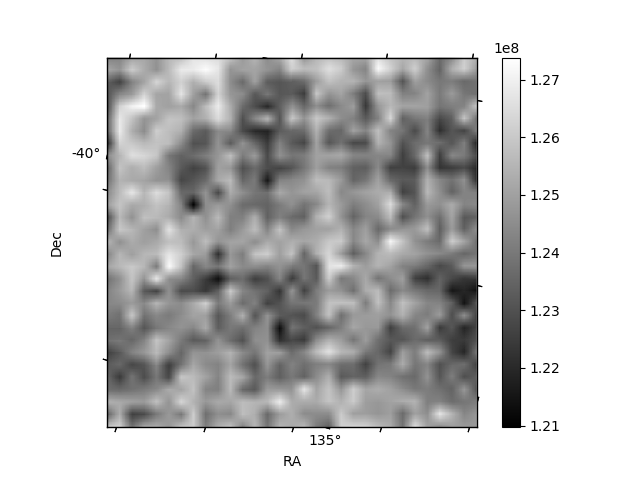
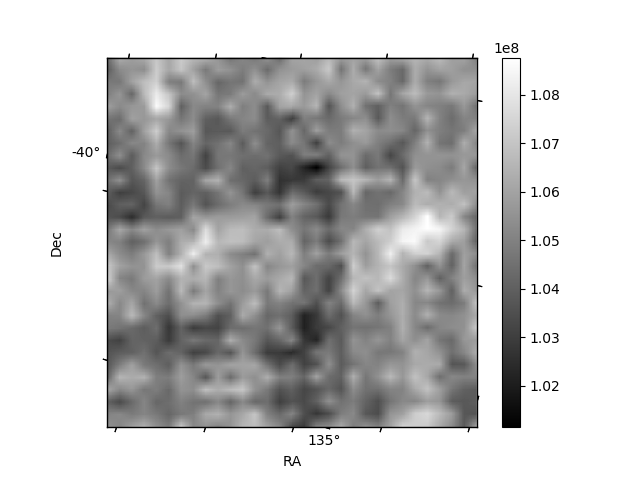
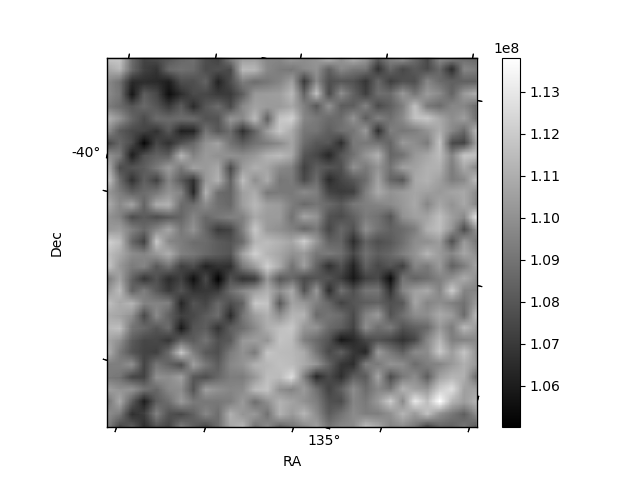
Histogram calculated using DETX and DETY for each event in the final _common_clean file
| Quadrant A | 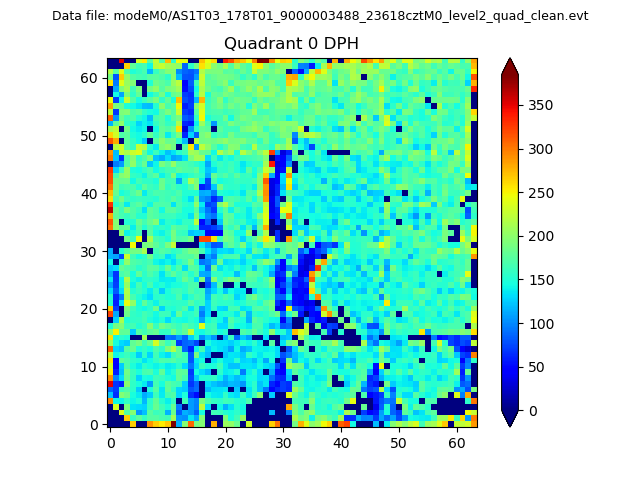 |
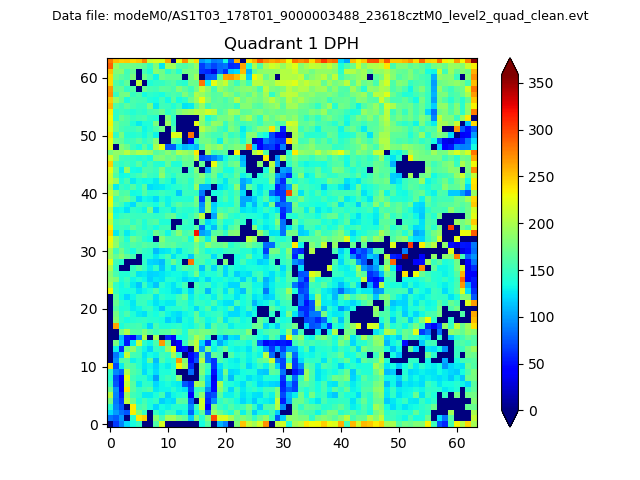 |
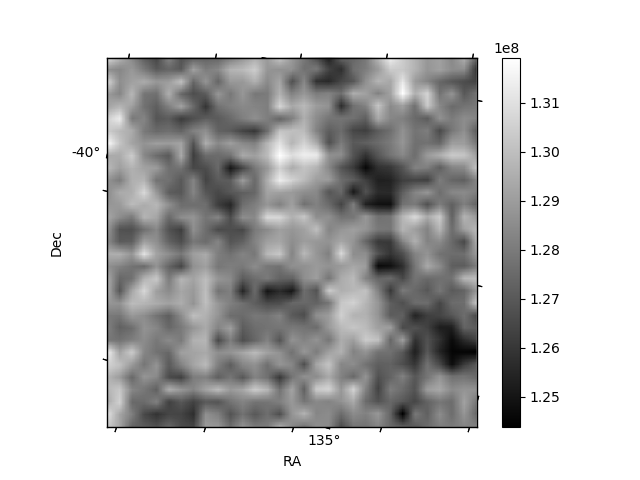
Quadrant B |
|---|---|---|---|
| Quadrant D | 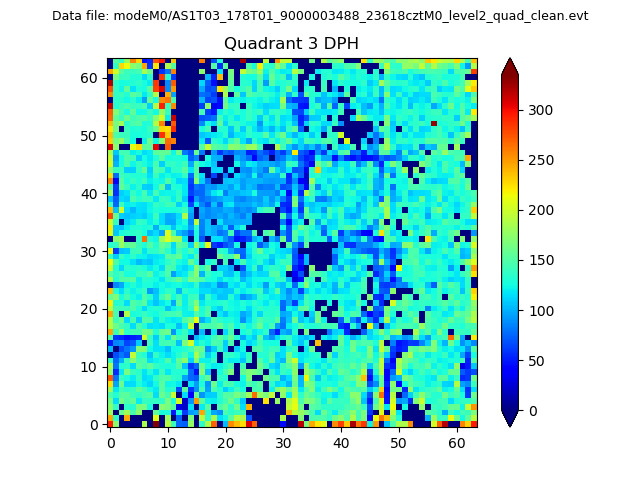 |
 |
Quadrant C |
| Plot type | Count rate plots | Images |
|---|---|---|
| Comparison with Poisson distribution Blue bars denote a histogram of data divided into 1 sec bins. Red curve is a Poisson curve with rate = median count rate of data. |
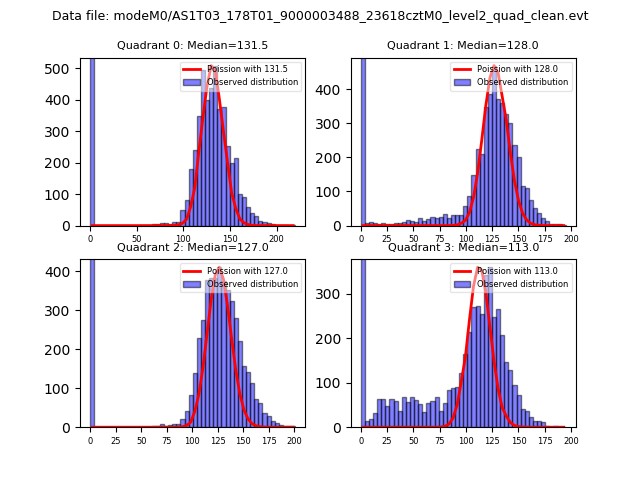 |
 |
| Quadrant-wise count rates Data is divided into 100 sec bins |
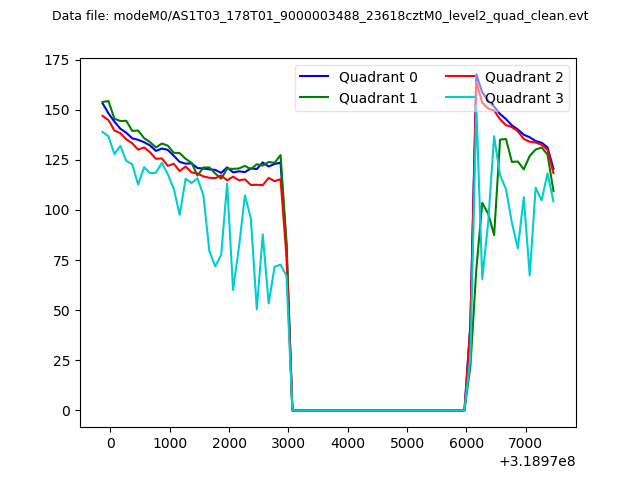 |
|
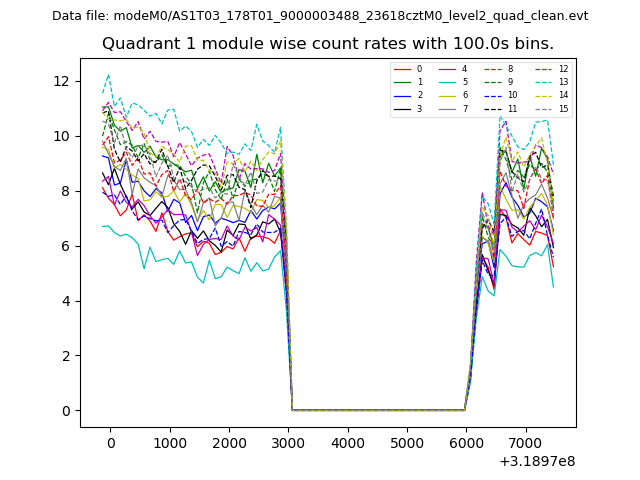
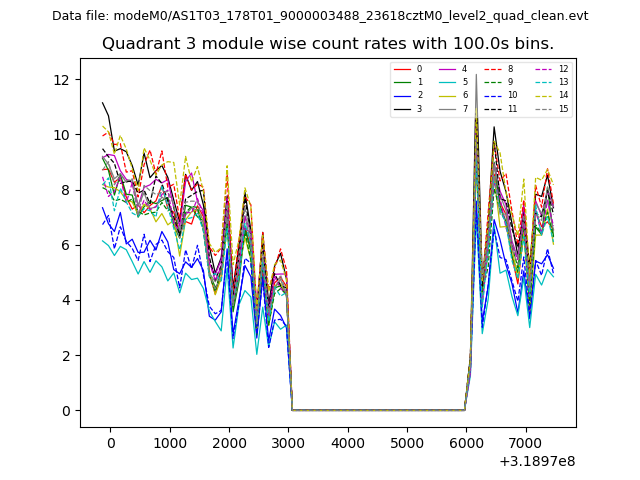
| Module-wise count rates for Quadrant A Data is divided into 100 sec bins |
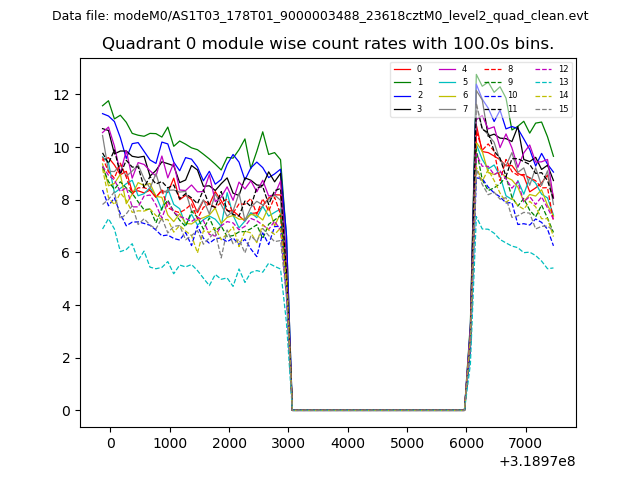 |
 |
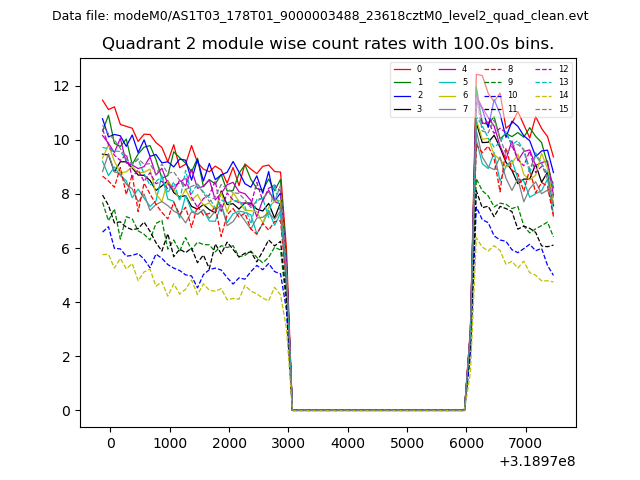
| Module-wise count rates for Quadrant B Data is divided into 100 sec bins |
 |
 |
| Module-wise count rates for Quadrant C Data is divided into 100 sec bins |
 |
 |
| Module-wise count rates for Quadrant D Data is divided into 100 sec bins |
 |
 |
| Parameter | Plot |
|---|---|
| CZT HV Monitor | 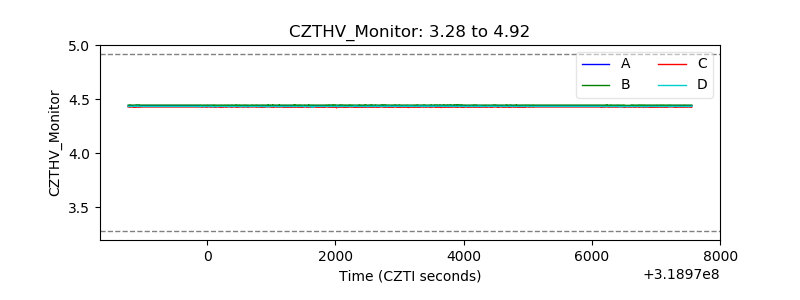 |
| D_VDD | 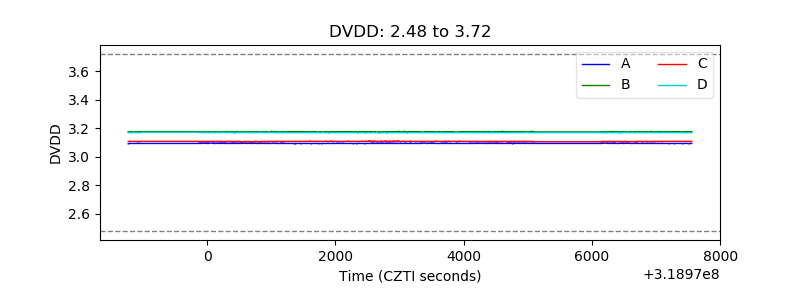 |
| Temperature 1 | 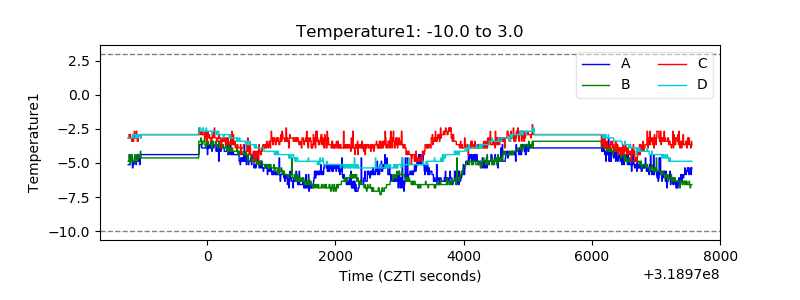 |
| Veto HV Monitor | 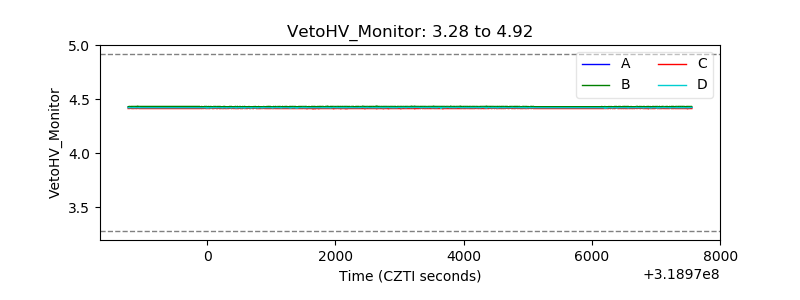 |
| Veto LLD | 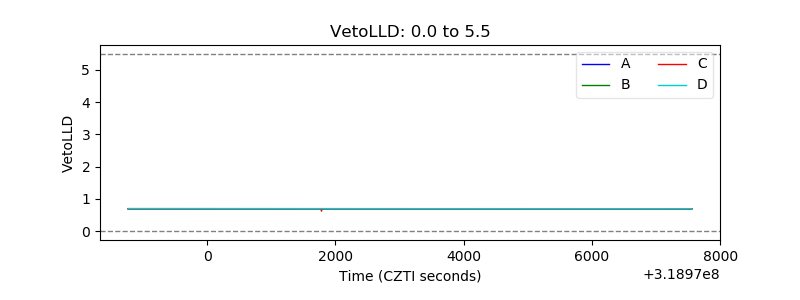 |
| Alpha Counter | 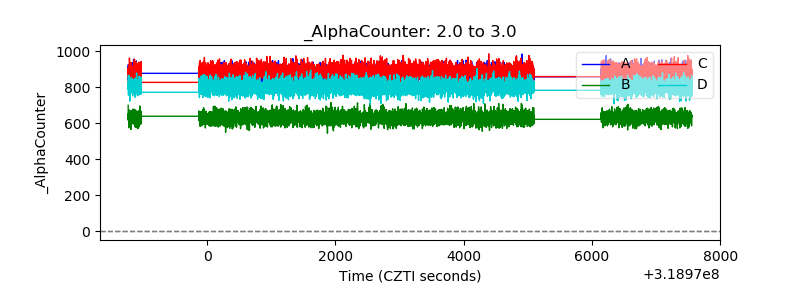 |
| _CPM_Rate | 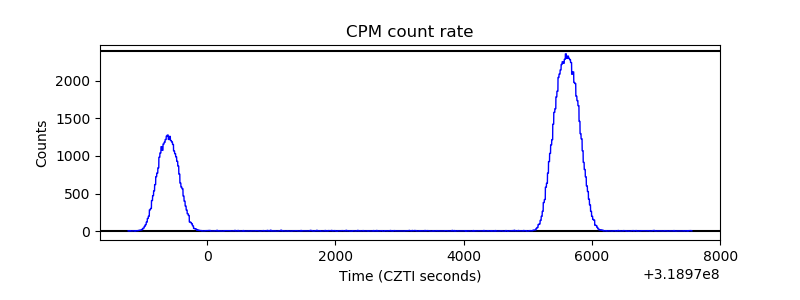 |
| CZT Counter | 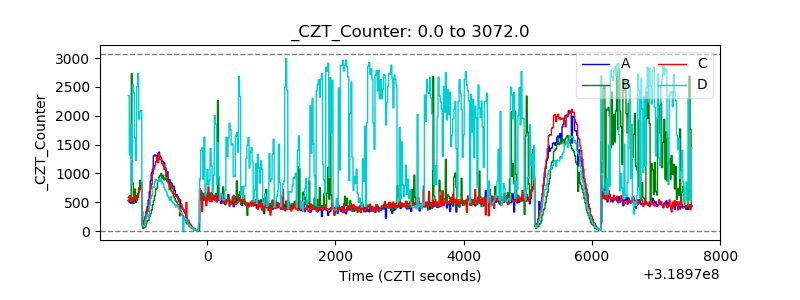 |
| +2.5 Volts monitor |  |
| +5 Volts monitor | 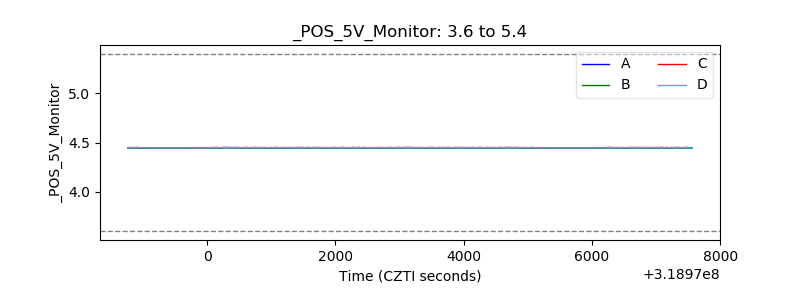 |
| _ROLL_ROT | 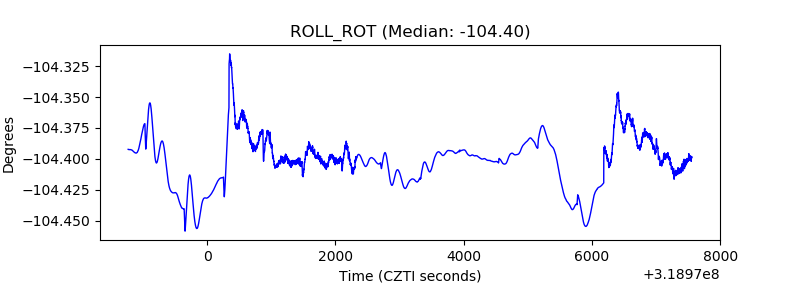 |
| _Roll_DEC | 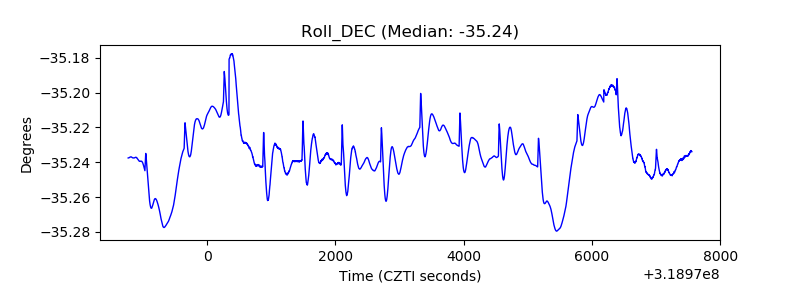 |
| _Roll_RA | 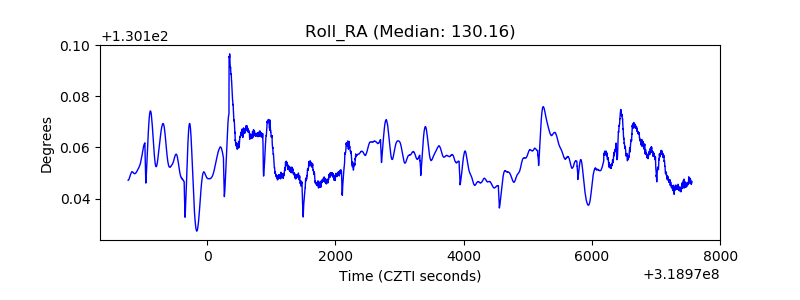 |
| Veto Counter | 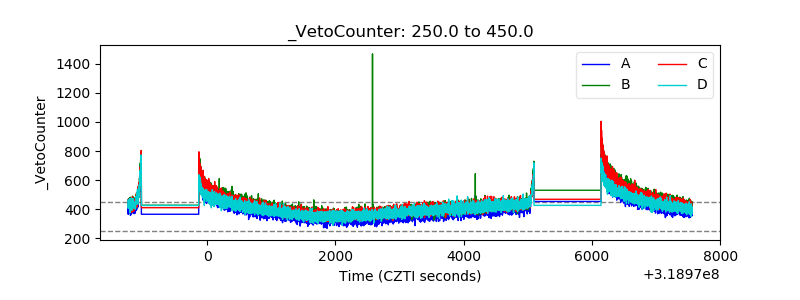 |