| Param | Original file | Final file |
|---|---|---|
| Filename | modeM0/AS1T03_178T01_9000003488_23620cztM0_level2.evt | modeM0/AS1T03_178T01_9000003488_23620cztM0_level2_quad_clean.evt |
| Size (bytes) | 719,432,640 | 86,929,920 |
| Size | 686.1 MB | 82.9 MB |
| Events in quadrant A | 3,113,668 | 609,340 |
| Events in quadrant B | 5,665,056 | 567,372 |
| Events in quadrant C | 3,202,600 | 598,872 |
| Events in quadrant D | 9,368,677 | 403,859 |
| Mode M0 | |||
|---|---|---|---|
| Quadrant | BADHDUFLAG | Total packets | Discarded packets |
| A | 0 | 13413 | 2 |
| B | 0 | 21162 | 2 |
| C | 0 | 13525 | 2 |
| D | 0 | 32346 | 2 |
| Mode M9 | |||
|---|---|---|---|
| Quadrant | BADHDUFLAG | Total packets | Discarded packets |
| A | 0 | 18 | 0 |
| B | 0 | 19 | 0 |
| C | 0 | 19 | 0 |
| D | 0 | 19 | 0 |
| Mode SS | |||
|---|---|---|---|
| Quadrant | BADHDUFLAG | Total packets | Discarded packets |
| A | 0 | 132 | 0 |
| B | 0 | 132 | 0 |
| C | 0 | 132 | 0 |
| D | 0 | 132 | 0 |
| Quadrant | Total seconds | Saturated seconds | Saturation percentage |
|---|---|---|---|
| A | 6475 | 20 | 0.308880% |
| B | 6475 | 905 | 13.976834% |
| C | 6474 | 43 | 0.664195% |
| D | 6474 | 2294 | 35.434044% |
Noise dominated data is calculated using 1-second bins in cleaned event files. If a bin has >2000 counts, and if more than 50% of those come from <1% of pixels, then it is considered to be noise-dominated and hence unusable.
| Quadrant | # 1 sec bins | Bins with >0 counts | Bins with >2000 counts | High rate bins dominated by noise | Noise dominated (total time) | Noise dominated (detector-on time) | Marked lightcurve |
|---|---|---|---|---|---|---|---|
| A | 7650 | 6476 | 0 | 0 | 0.00% | 0.00% | 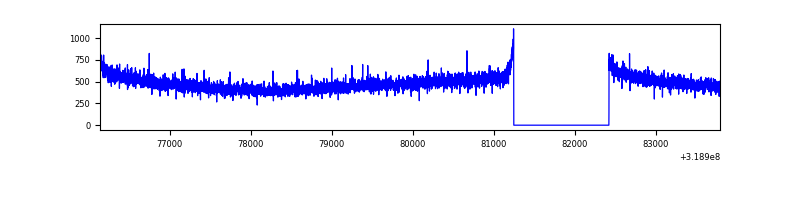 |
| B | 7650 | 6475 | 643 | 643 | 8.41% | 9.93% | 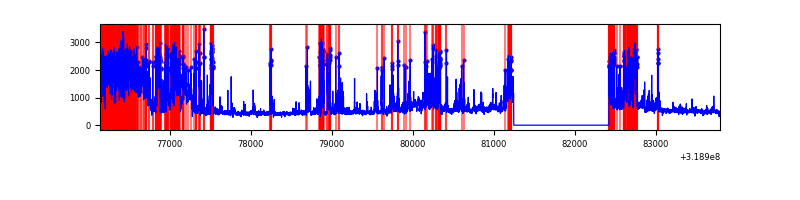 |
| C | 7649 | 6474 | 0 | 0 | 0.00% | 0.00% | 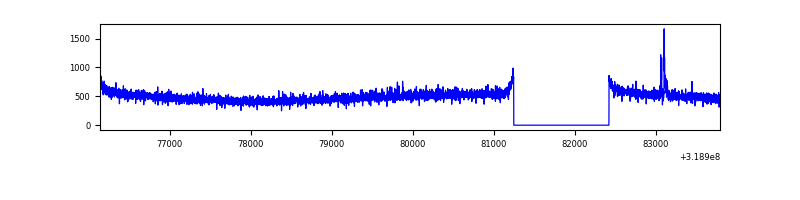 |
| D | 7648 | 6474 | 2312 | 2312 | 30.23% | 35.71% | 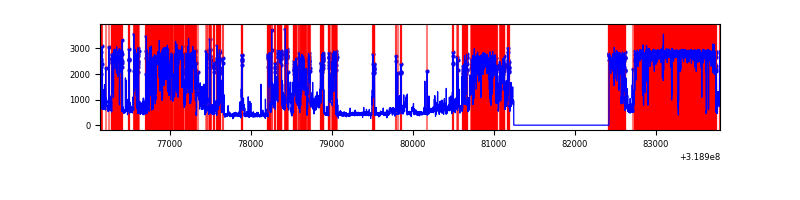 |
Top three noisy pixels from each quadrant. If the there are fewer than three noisy pixels in the level2.evt file, extra rows are filled as -1
| Pixel properties | Quadrant properties | ||||||
|---|---|---|---|---|---|---|---|
| Quadrant | DetID | PixID | Counts | Sigma | Mean | Median | Sigma |
| A | 13 | 254 | 10392 | 59.5 | 807 | 791 | 161.4 |
| A | 3 | 137 | 7375 | 40.8 | 807 | 791 | 161.4 |
| A | 0 | 226 | 6896 | 37.83 | 807 | 791 | 161.4 |
| B | 3 | 64 | 2542223 | 17697.42 | 763 | 746 | 143.6 |
| B | 0 | 229 | 77246 | 532.7 | 763 | 746 | 143.6 |
| B | 0 | 189 | 29657 | 201.32 | 763 | 746 | 143.6 |
| C | 14 | 238 | 124929 | 676.34 | 782 | 788 | 183.5 |
| C | 7 | 247 | 30131 | 159.87 | 782 | 788 | 183.5 |
| C | 13 | 61 | 5352 | 24.87 | 782 | 788 | 183.5 |
| D | 1 | 52 | 6907240 | 44715.31 | 637 | 619 | 154.5 |
| D | 12 | 233 | 59271 | 379.73 | 637 | 619 | 154.5 |
| D | 2 | 234 | 21017 | 132.06 | 637 | 619 | 154.5 |
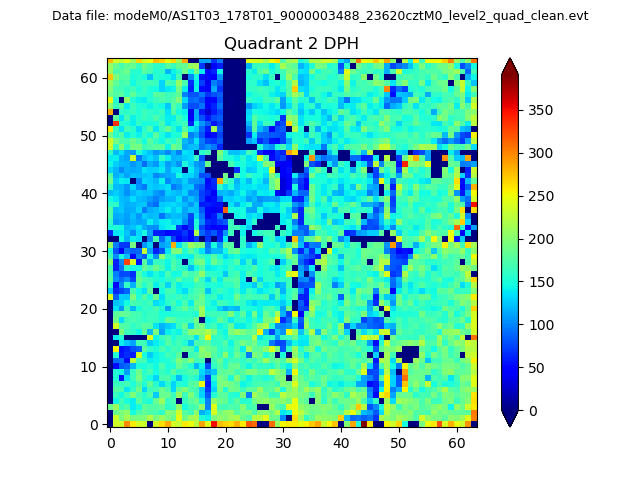
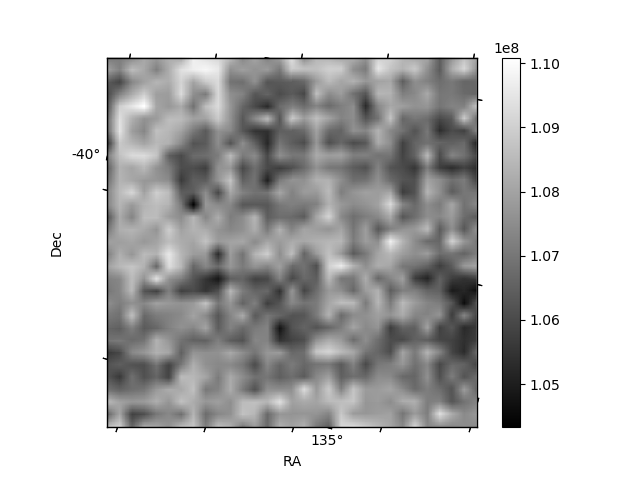
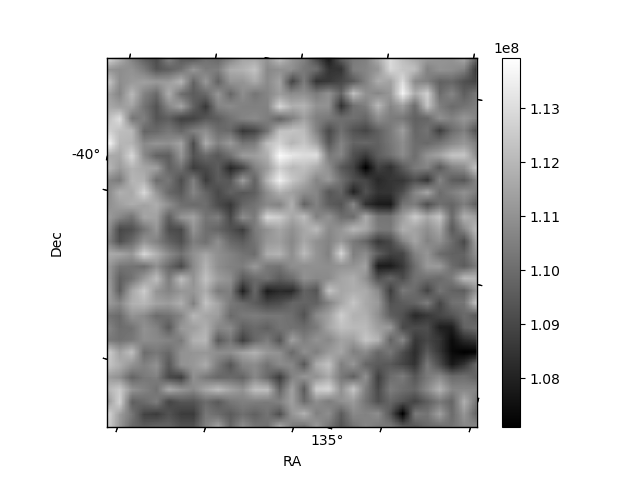
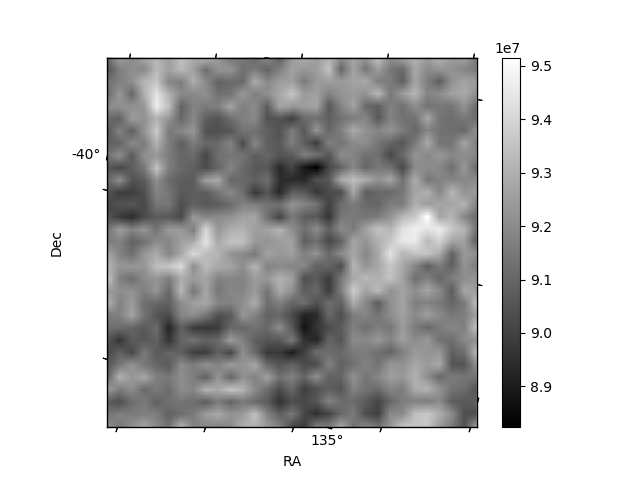
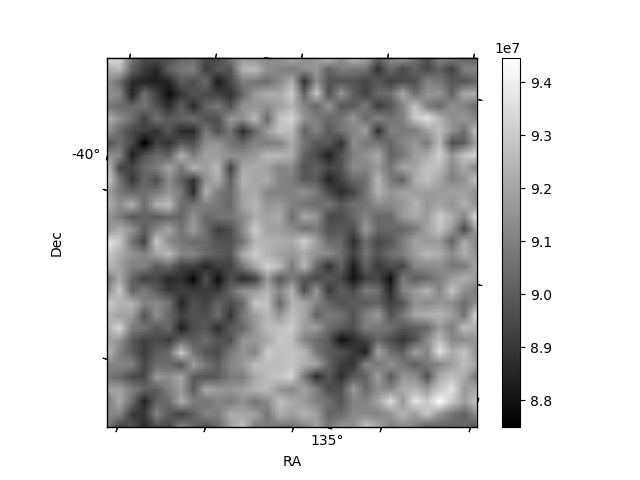
Histogram calculated using DETX and DETY for each event in the final _common_clean file
| Quadrant A | 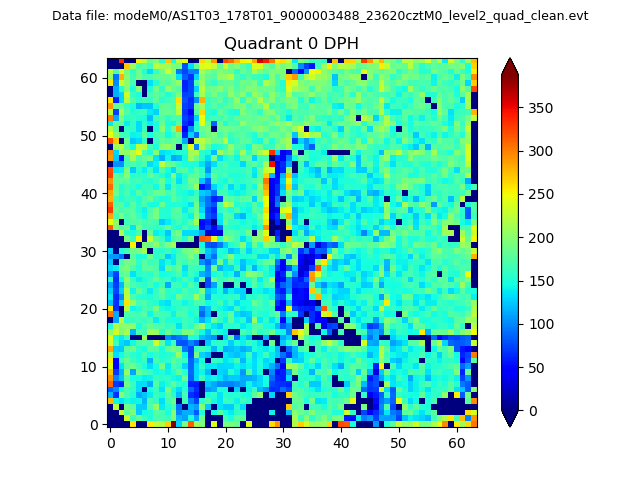 |
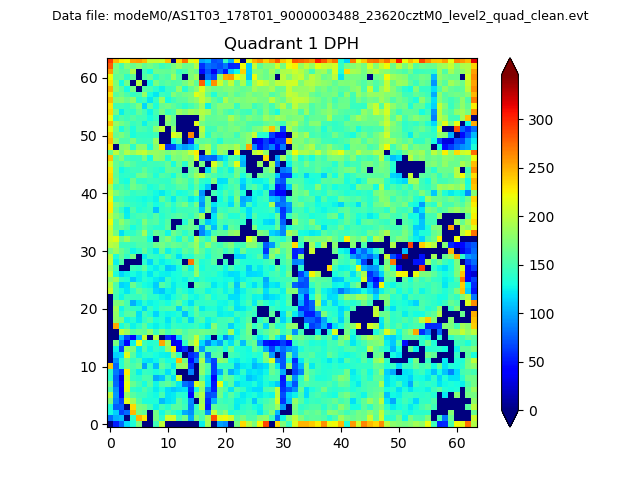 |
Quadrant B |
|---|---|---|---|
| Quadrant D | 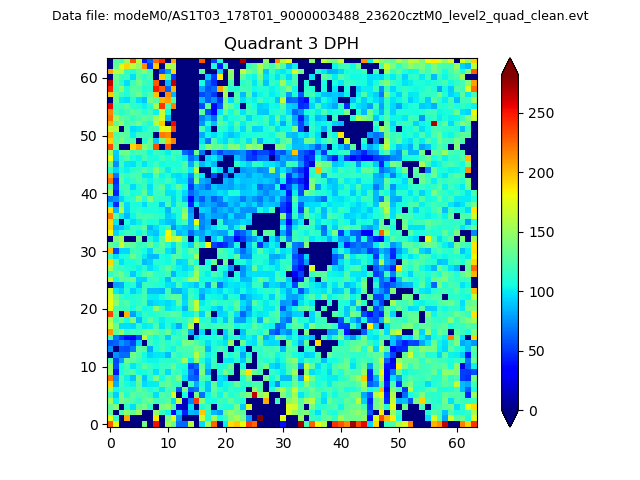 |
 |
Quadrant C |
| Plot type | Count rate plots | Images |
|---|---|---|
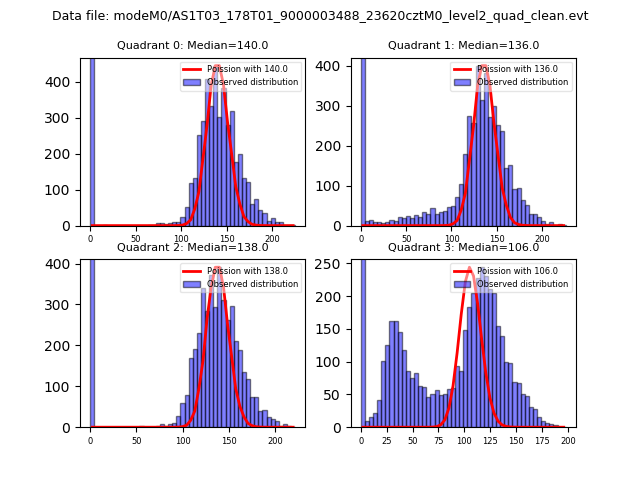
| Comparison with Poisson distribution Blue bars denote a histogram of data divided into 1 sec bins. Red curve is a Poisson curve with rate = median count rate of data. |
 |
 |
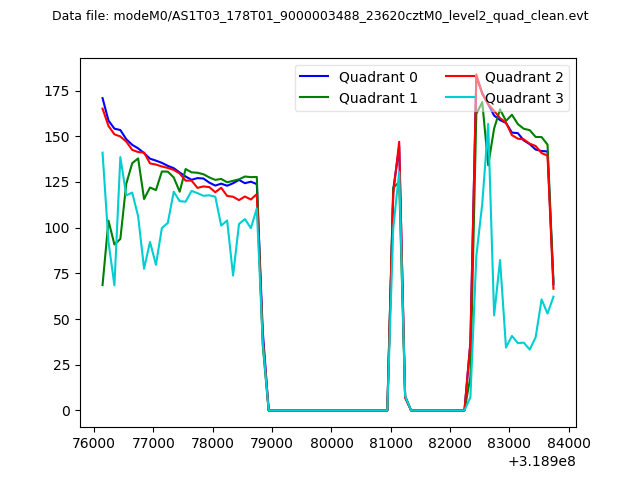
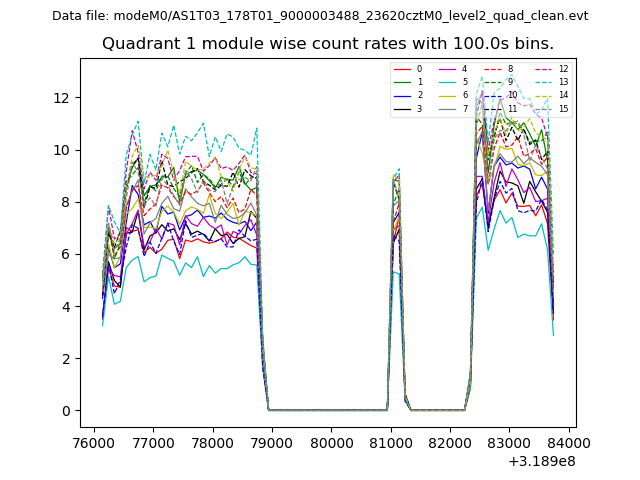
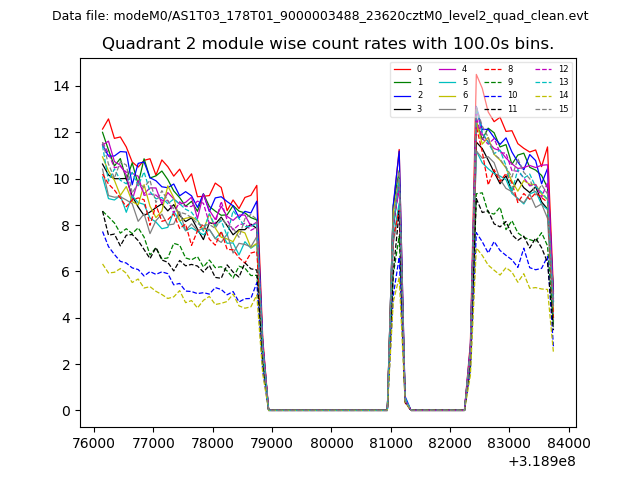
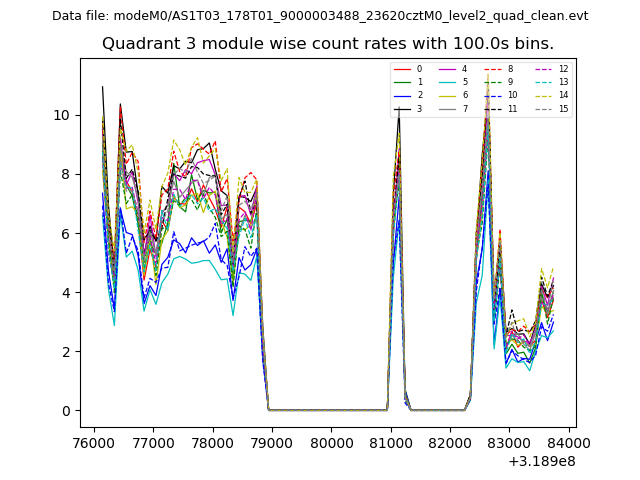
| Quadrant-wise count rates Data is divided into 100 sec bins |
 |
|
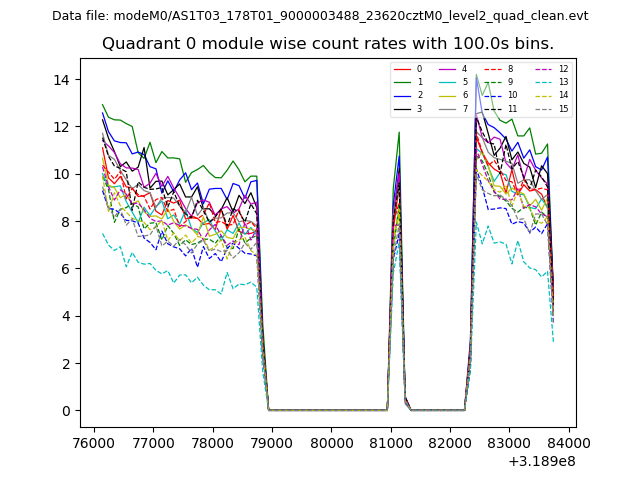
| Module-wise count rates for Quadrant A Data is divided into 100 sec bins |
 |
 |
| Module-wise count rates for Quadrant B Data is divided into 100 sec bins |
 |
 |
| Module-wise count rates for Quadrant C Data is divided into 100 sec bins |
 |
 |
| Module-wise count rates for Quadrant D Data is divided into 100 sec bins |
 |
 |
| Parameter | Plot |
|---|---|
| CZT HV Monitor | 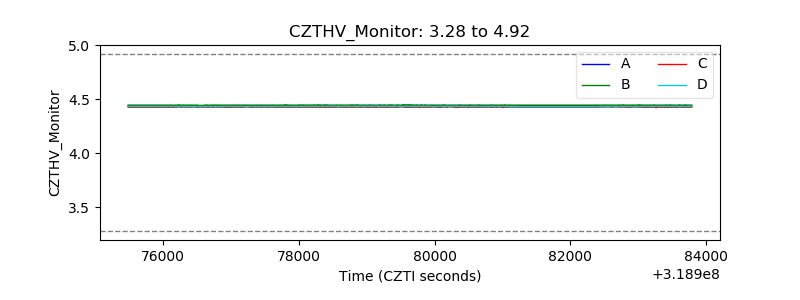 |
| D_VDD | 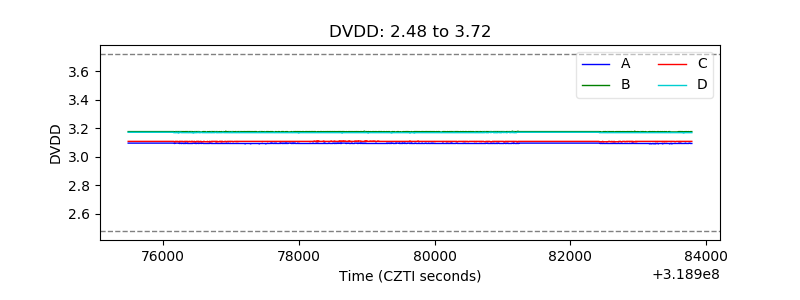 |
| Temperature 1 | 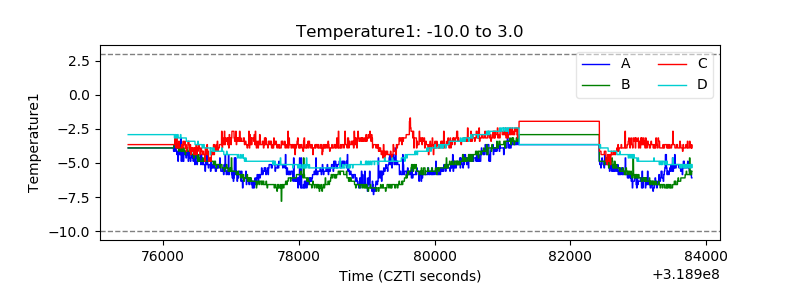 |
| Veto HV Monitor | 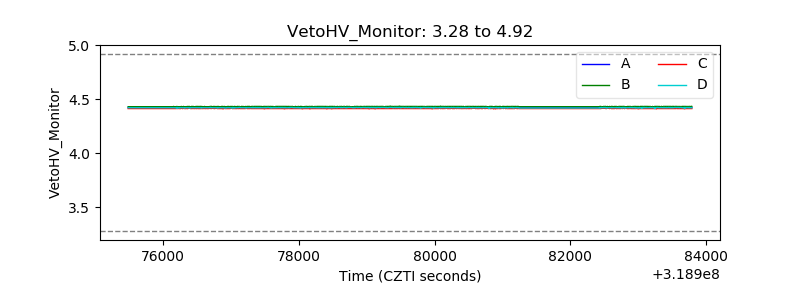 |
| Veto LLD | 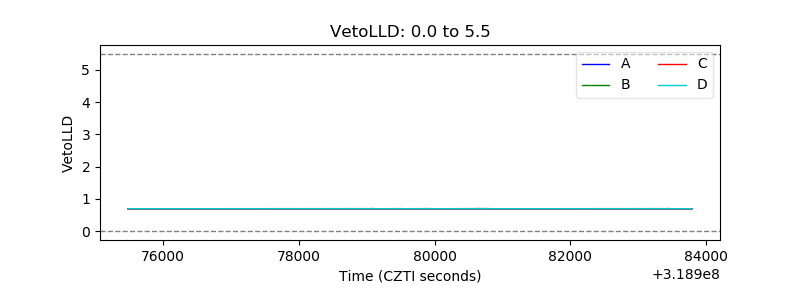 |
| Alpha Counter | 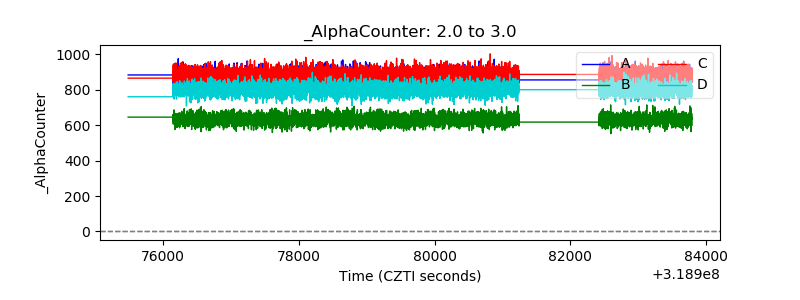 |
| _CPM_Rate | 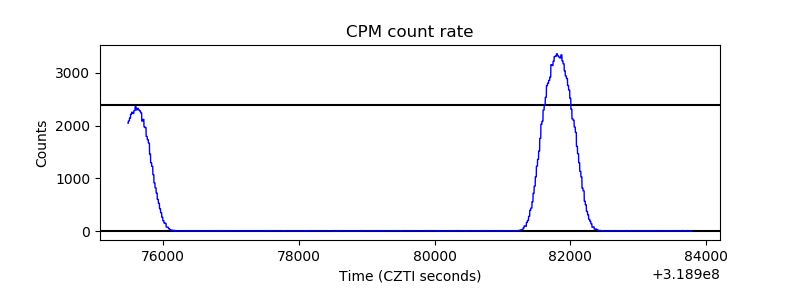 |
| CZT Counter |  |
| +2.5 Volts monitor |  |
| +5 Volts monitor | 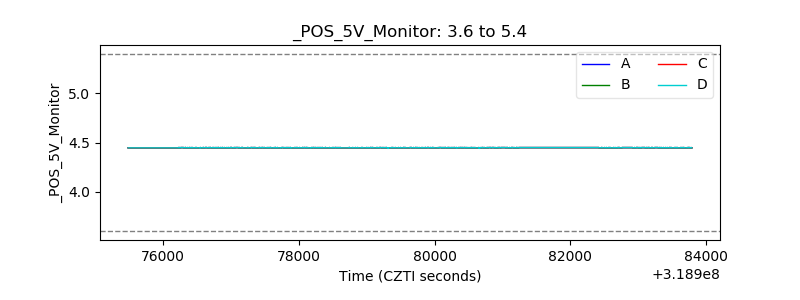 |
| _ROLL_ROT | 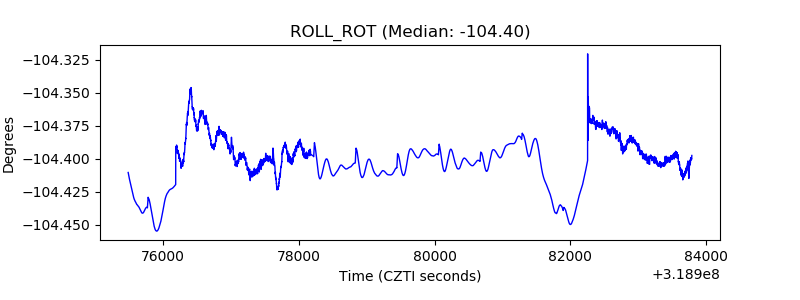 |
| _Roll_DEC | 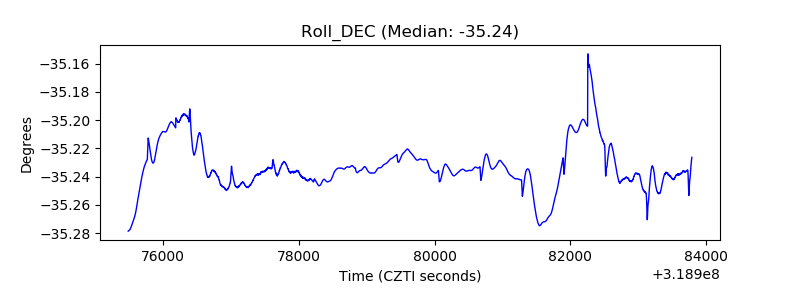 |
| _Roll_RA | 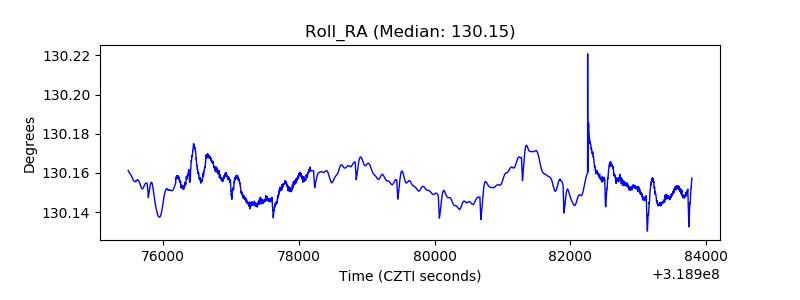 |
| Veto Counter | 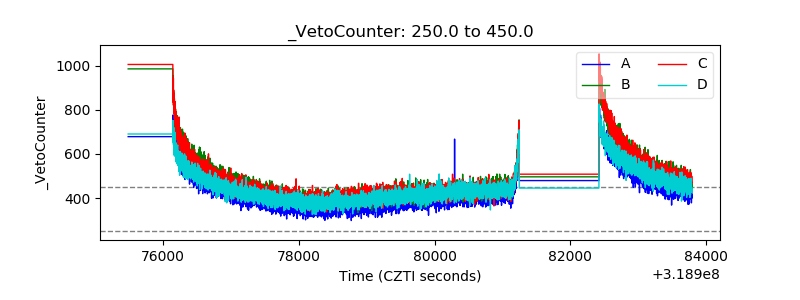 |