| Param | Original file | Final file |
|---|---|---|
| Filename | modeM0/AS1T03_178T01_9000003488_23621cztM0_level2.evt | modeM0/AS1T03_178T01_9000003488_23621cztM0_level2_quad_clean.evt |
| Size (bytes) | 797,898,240 | 89,199,360 |
| Size | 760.9 MB | 85.1 MB |
| Events in quadrant A | 3,162,546 | 635,414 |
| Events in quadrant B | 3,909,586 | 648,607 |
| Events in quadrant C | 3,450,063 | 632,117 |
| Events in quadrant D | 13,212,042 | 339,774 |
| Mode M0 | |||
|---|---|---|---|
| Quadrant | BADHDUFLAG | Total packets | Discarded packets |
| A | 0 | 13311 | 2 |
| B | 0 | 15475 | 2 |
| C | 0 | 14009 | 2 |
| D | 0 | 43462 | 8 |
| Mode M9 | |||
|---|---|---|---|
| Quadrant | BADHDUFLAG | Total packets | Discarded packets |
| A | 0 | 18 | 0 |
| B | 0 | 19 | 0 |
| C | 0 | 19 | 0 |
| D | 0 | 19 | 0 |
| Mode SS | |||
|---|---|---|---|
| Quadrant | BADHDUFLAG | Total packets | Discarded packets |
| A | 0 | 130 | 0 |
| B | 0 | 130 | 0 |
| C | 0 | 130 | 0 |
| D | 0 | 130 | 0 |
| Quadrant | Total seconds | Saturated seconds | Saturation percentage |
|---|---|---|---|
| A | 6359 | 31 | 0.487498% |
| B | 6359 | 242 | 3.805630% |
| C | 6359 | 90 | 1.415317% |
| D | 6358 | 4374 | 68.795219% |
Noise dominated data is calculated using 1-second bins in cleaned event files. If a bin has >2000 counts, and if more than 50% of those come from <1% of pixels, then it is considered to be noise-dominated and hence unusable.
| Quadrant | # 1 sec bins | Bins with >0 counts | Bins with >2000 counts | High rate bins dominated by noise | Noise dominated (total time) | Noise dominated (detector-on time) | Marked lightcurve |
|---|---|---|---|---|---|---|---|
| A | 7609 | 6360 | 0 | 0 | 0.00% | 0.00% | 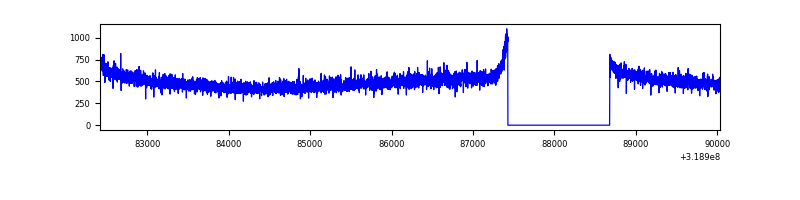 |
| B | 7609 | 6359 | 129 | 129 | 1.70% | 2.03% | 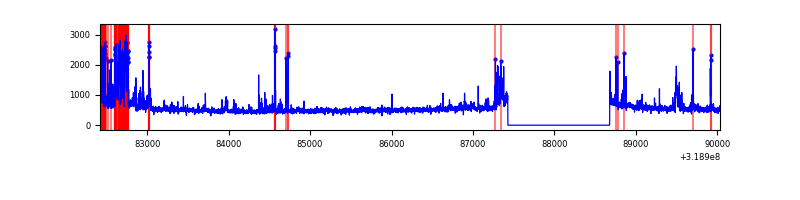 |
| C | 7609 | 6359 | 7 | 7 | 0.09% | 0.11% | 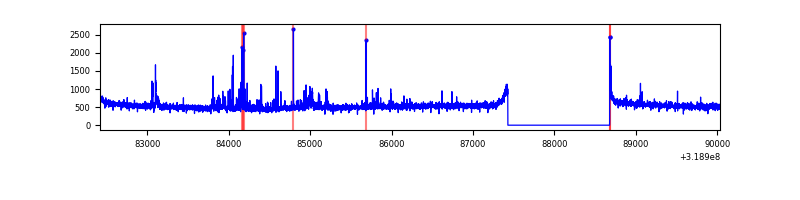 |
| D | 7607 | 6357 | 4331 | 4331 | 56.93% | 68.13% | 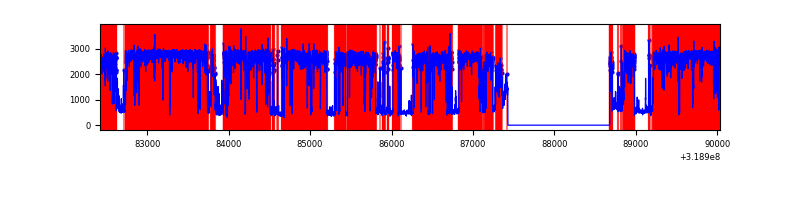 |
Top three noisy pixels from each quadrant. If the there are fewer than three noisy pixels in the level2.evt file, extra rows are filled as -1
| Pixel properties | Quadrant properties | ||||||
|---|---|---|---|---|---|---|---|
| Quadrant | DetID | PixID | Counts | Sigma | Mean | Median | Sigma |
| A | 13 | 254 | 9567 | 53.66 | 820 | 805 | 163.3 |
| A | 3 | 137 | 7164 | 38.95 | 820 | 805 | 163.3 |
| A | 0 | 226 | 6940 | 37.57 | 820 | 805 | 163.3 |
| B | 3 | 64 | 590688 | 3840.76 | 820 | 802 | 153.6 |
| B | 0 | 189 | 53207 | 341.21 | 820 | 802 | 153.6 |
| B | 0 | 229 | 41041 | 262.0 | 820 | 802 | 153.6 |
| C | 14 | 238 | 128591 | 684.52 | 805 | 815 | 186.7 |
| C | 10 | 9 | 116467 | 619.57 | 805 | 815 | 186.7 |
| C | 7 | 247 | 46316 | 243.75 | 805 | 815 | 186.7 |
| D | 1 | 52 | 11257667 | 93370.09 | 506 | 493 | 120.6 |
| D | 13 | 172 | 30430 | 248.31 | 506 | 493 | 120.6 |
| D | 2 | 234 | 14772 | 118.43 | 506 | 493 | 120.6 |
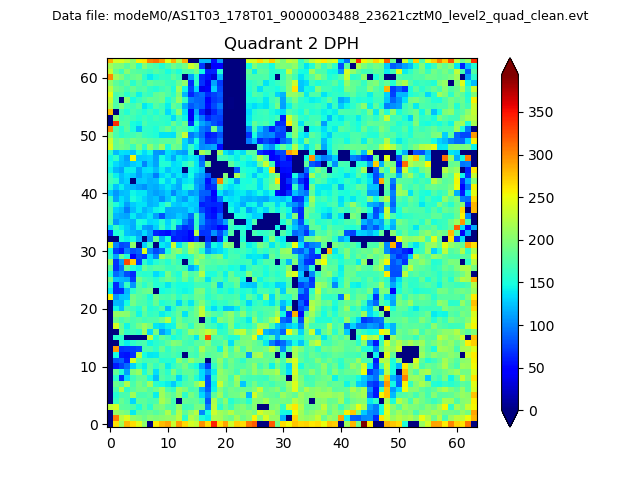
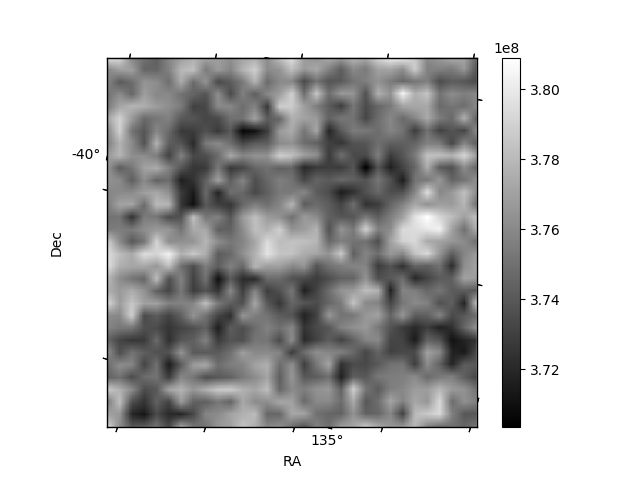
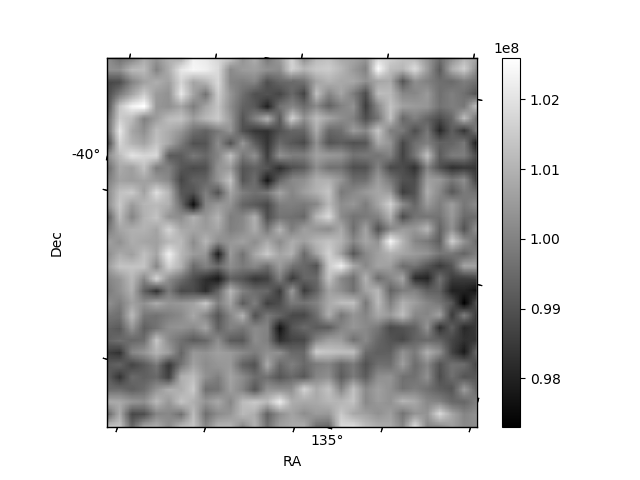
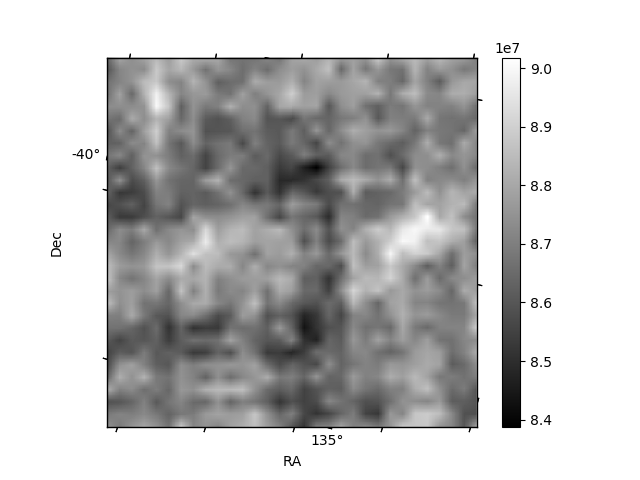
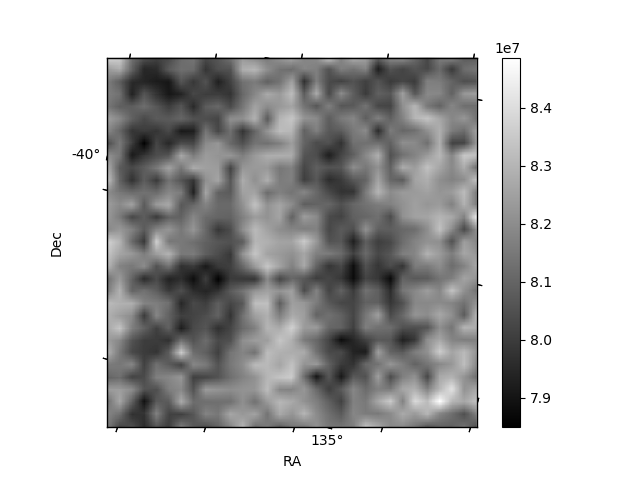
Histogram calculated using DETX and DETY for each event in the final _common_clean file
| Quadrant A | 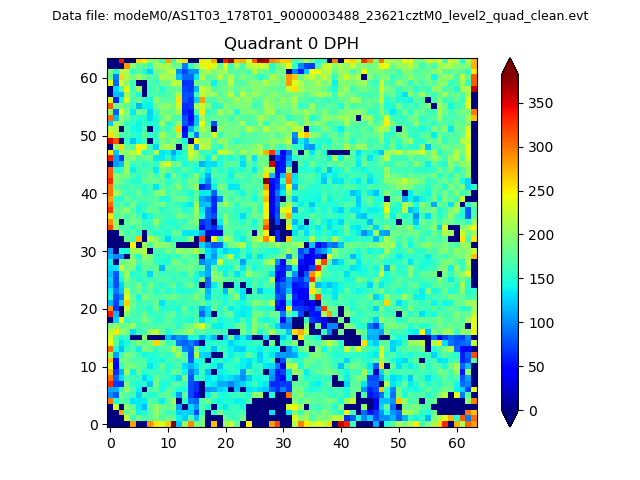 |
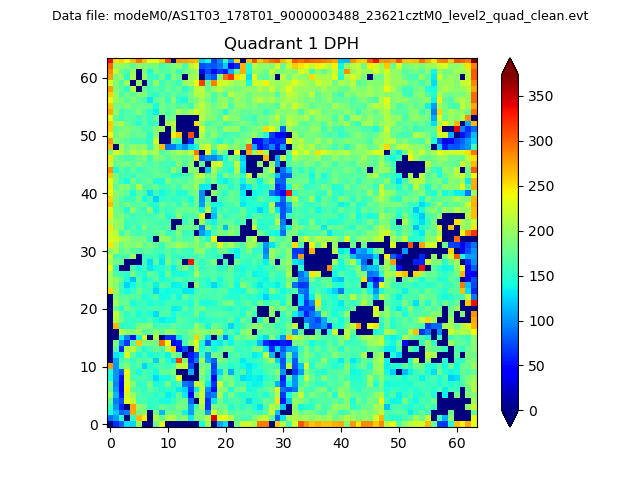 |
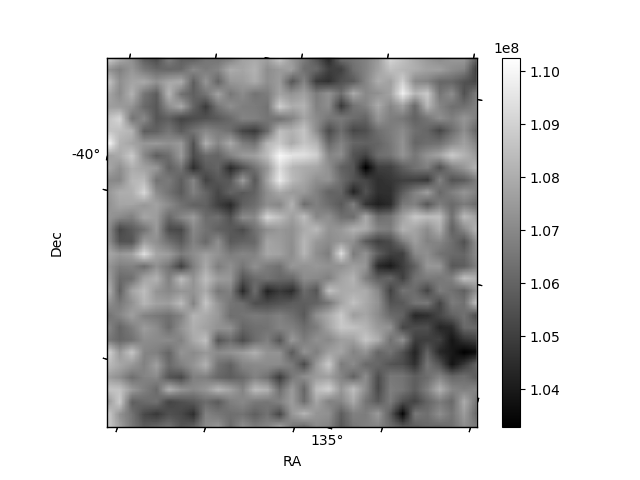
Quadrant B |
|---|---|---|---|
| Quadrant D | 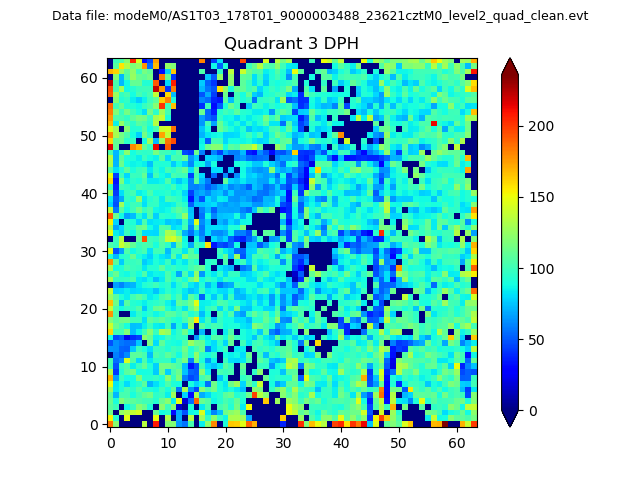 |
 |
Quadrant C |
| Plot type | Count rate plots | Images |
|---|---|---|
| Comparison with Poisson distribution Blue bars denote a histogram of data divided into 1 sec bins. Red curve is a Poisson curve with rate = median count rate of data. |
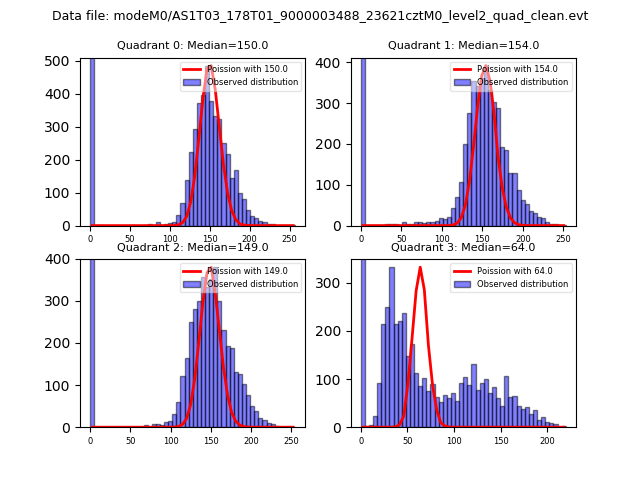 |
 |
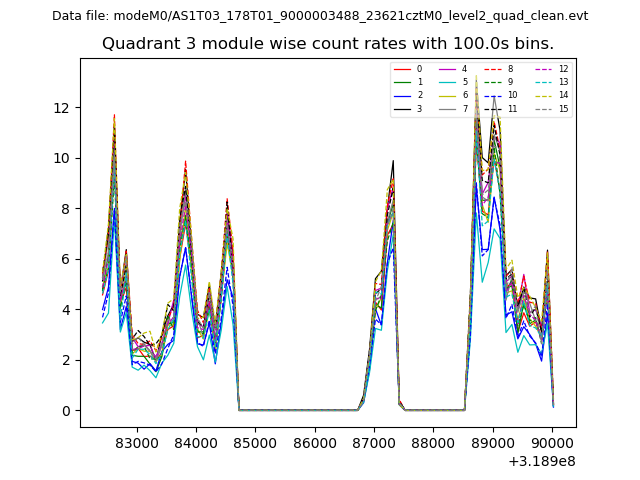
| Quadrant-wise count rates Data is divided into 100 sec bins |
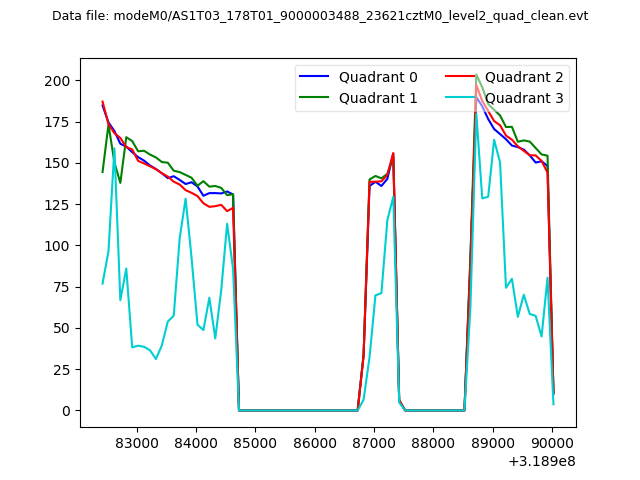 |
|
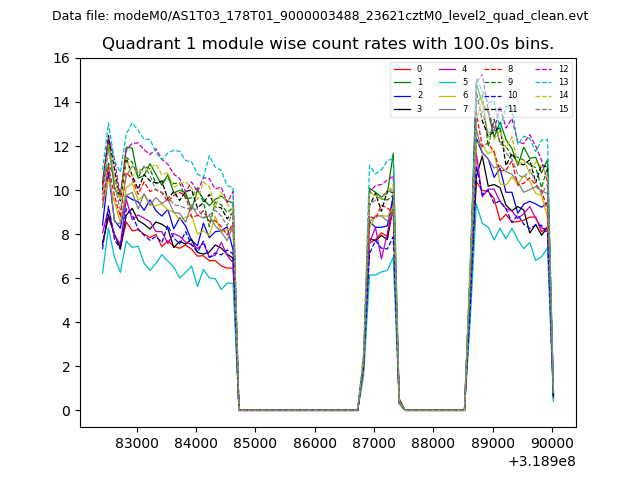
| Module-wise count rates for Quadrant A Data is divided into 100 sec bins |
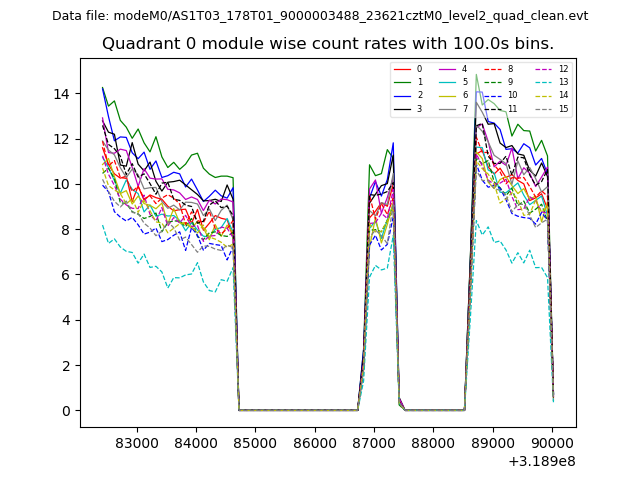 |
 |
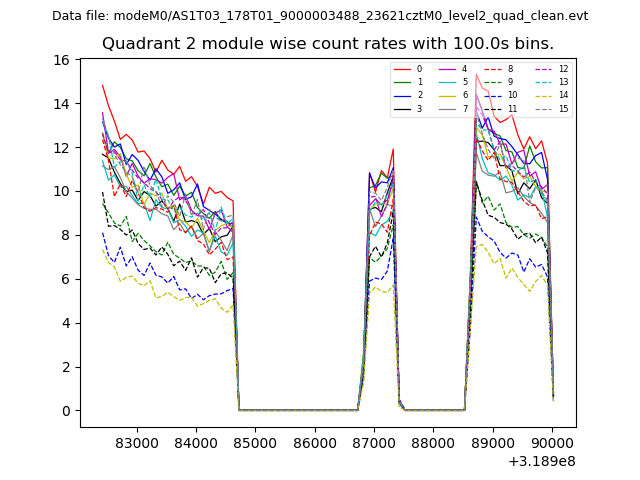
| Module-wise count rates for Quadrant B Data is divided into 100 sec bins |
 |
 |
| Module-wise count rates for Quadrant C Data is divided into 100 sec bins |
 |
 |
| Module-wise count rates for Quadrant D Data is divided into 100 sec bins |
 |
 |
| Parameter | Plot |
|---|---|
| CZT HV Monitor | 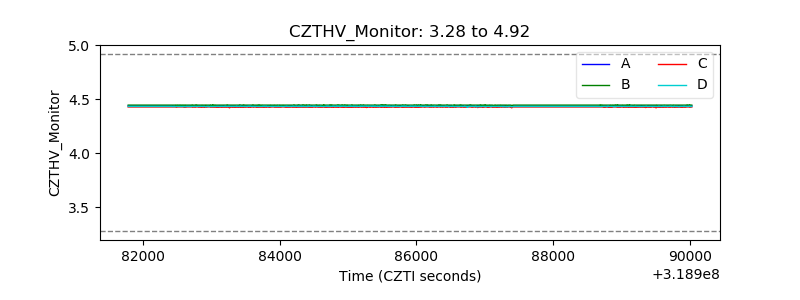 |
| D_VDD | 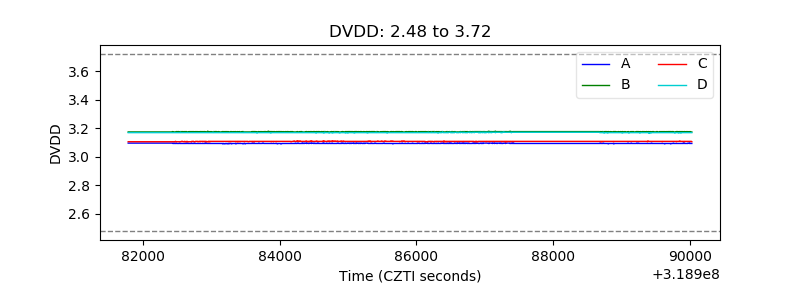 |
| Temperature 1 | 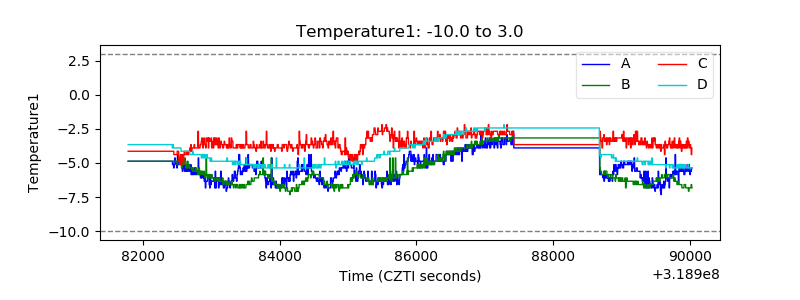 |
| Veto HV Monitor | 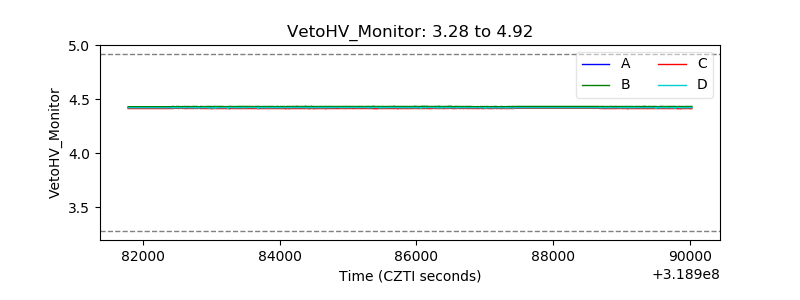 |
| Veto LLD | 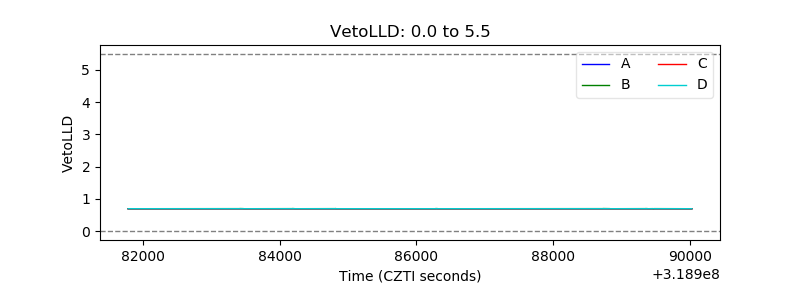 |
| Alpha Counter | 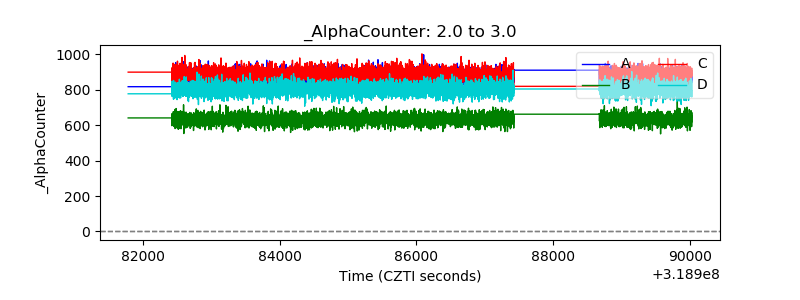 |
| _CPM_Rate | 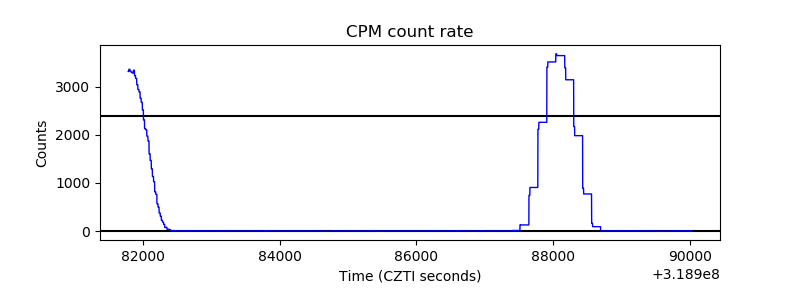 |
| CZT Counter |  |
| +2.5 Volts monitor |  |
| +5 Volts monitor |  |
| _ROLL_ROT | 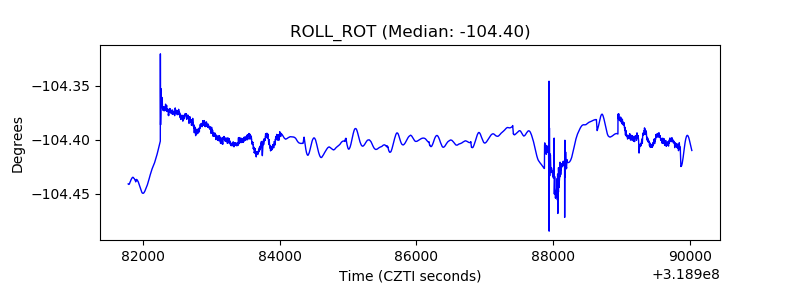 |
| _Roll_DEC | 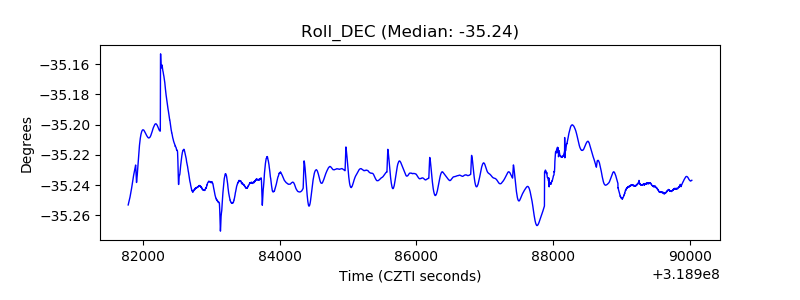 |
| _Roll_RA | 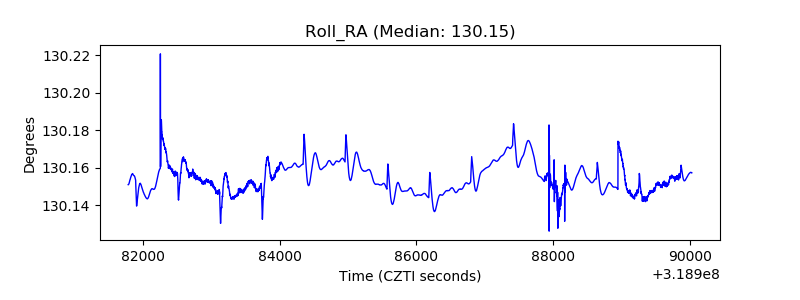 |
| Veto Counter | 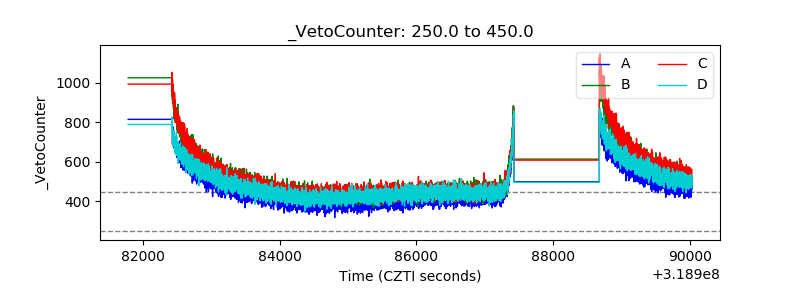 |