| Param | Original file | Final file |
|---|---|---|
| Filename | modeM0/AS1T03_178T01_9000003488_23622cztM0_level2.evt | modeM0/AS1T03_178T01_9000003488_23622cztM0_level2_quad_clean.evt |
| Size (bytes) | 684,734,400 | 96,744,960 |
| Size | 653.0 MB | 92.3 MB |
| Events in quadrant A | 3,218,170 | 657,189 |
| Events in quadrant B | 3,699,323 | 687,749 |
| Events in quadrant C | 3,394,320 | 662,321 |
| Events in quadrant D | 9,995,205 | 478,498 |
| Mode M0 | |||
|---|---|---|---|
| Quadrant | BADHDUFLAG | Total packets | Discarded packets |
| A | 0 | 13277 | 1 |
| B | 0 | 14850 | 1 |
| C | 0 | 13696 | 1 |
| D | 0 | 33825 | 2 |
| Mode M9 | |||
|---|---|---|---|
| Quadrant | BADHDUFLAG | Total packets | Discarded packets |
| A | 0 | 13 | 0 |
| B | 0 | 13 | 0 |
| C | 0 | 13 | 0 |
| D | 0 | 13 | 0 |
| Mode SS | |||
|---|---|---|---|
| Quadrant | BADHDUFLAG | Total packets | Discarded packets |
| A | 0 | 130 | 0 |
| B | 0 | 130 | 0 |
| C | 0 | 130 | 0 |
| D | 0 | 130 | 0 |
| Quadrant | Total seconds | Saturated seconds | Saturation percentage |
|---|---|---|---|
| A | 6350 | 36 | 0.566929% |
| B | 6350 | 113 | 1.779528% |
| C | 6350 | 76 | 1.196850% |
| D | 6350 | 2864 | 45.102362% |
Noise dominated data is calculated using 1-second bins in cleaned event files. If a bin has >2000 counts, and if more than 50% of those come from <1% of pixels, then it is considered to be noise-dominated and hence unusable.
| Quadrant | # 1 sec bins | Bins with >0 counts | Bins with >2000 counts | High rate bins dominated by noise | Noise dominated (total time) | Noise dominated (detector-on time) | Marked lightcurve |
|---|---|---|---|---|---|---|---|
| A | 7670 | 6350 | 0 | 0 | 0.00% | 0.00% | 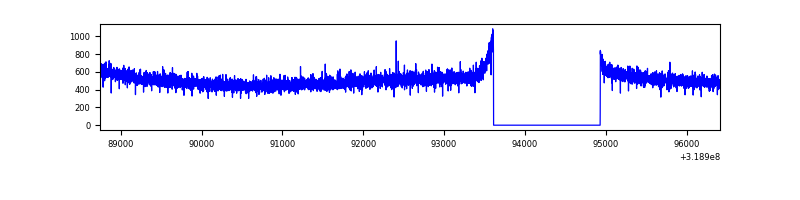 |
| B | 7670 | 6350 | 23 | 23 | 0.30% | 0.36% | 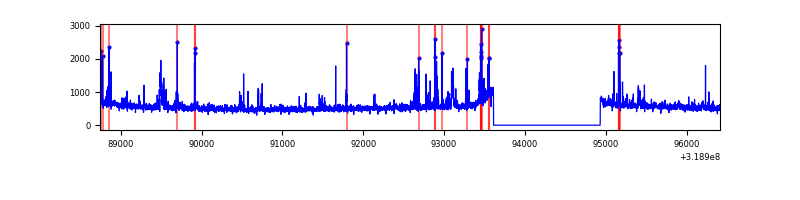 |
| C | 7670 | 6350 | 0 | 0 | 0.00% | 0.00% | 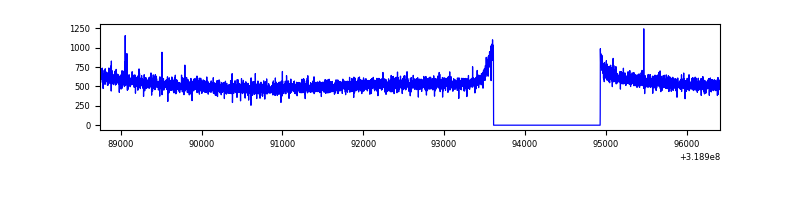 |
| D | 7670 | 6350 | 2804 | 2804 | 36.56% | 44.16% | 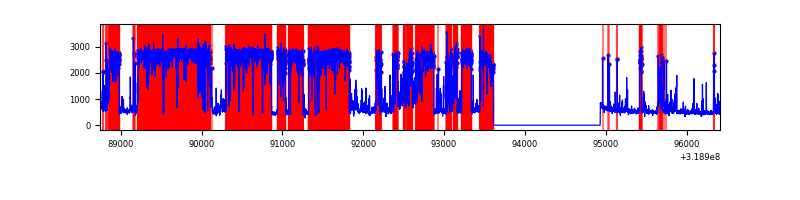 |
Top three noisy pixels from each quadrant. If the there are fewer than three noisy pixels in the level2.evt file, extra rows are filled as -1
| Pixel properties | Quadrant properties | ||||||
|---|---|---|---|---|---|---|---|
| Quadrant | DetID | PixID | Counts | Sigma | Mean | Median | Sigma |
| A | 13 | 254 | 9233 | 50.48 | 835 | 819 | 166.7 |
| A | 0 | 226 | 7073 | 37.52 | 835 | 819 | 166.7 |
| A | 3 | 137 | 6929 | 36.66 | 835 | 819 | 166.7 |
| B | 3 | 64 | 256794 | 1622.24 | 849 | 830 | 157.8 |
| B | 0 | 189 | 66057 | 413.39 | 849 | 830 | 157.8 |
| B | 0 | 229 | 43734 | 271.92 | 849 | 830 | 157.8 |
| C | 14 | 238 | 132061 | 687.7 | 829 | 839 | 190.8 |
| C | 7 | 247 | 15836 | 78.59 | 829 | 839 | 190.8 |
| C | 10 | 9 | 8580 | 40.57 | 829 | 839 | 190.8 |
| D | 1 | 52 | 7462622 | 48367.14 | 638 | 622 | 154.3 |
| D | 12 | 233 | 130285 | 840.45 | 638 | 622 | 154.3 |
| D | 2 | 234 | 17837 | 111.58 | 638 | 622 | 154.3 |
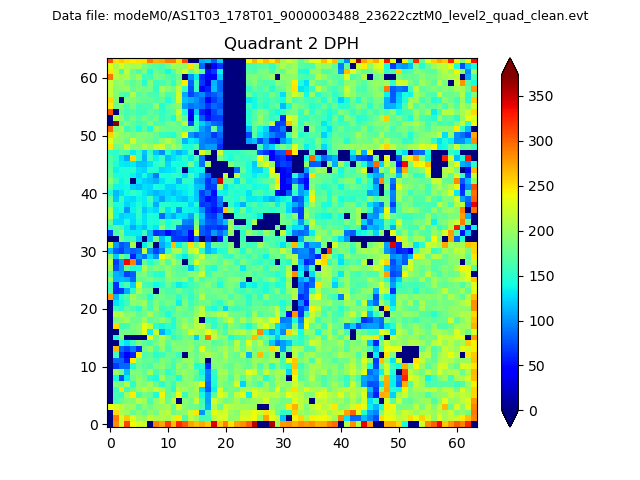
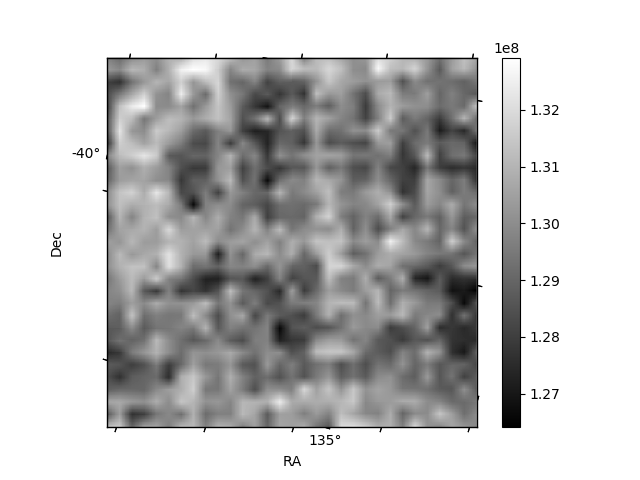
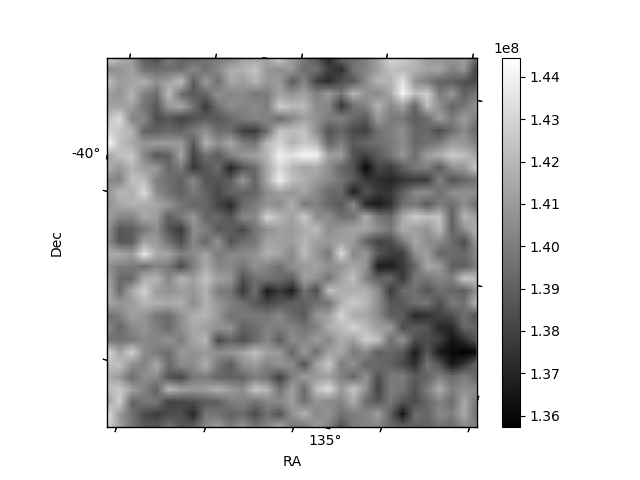
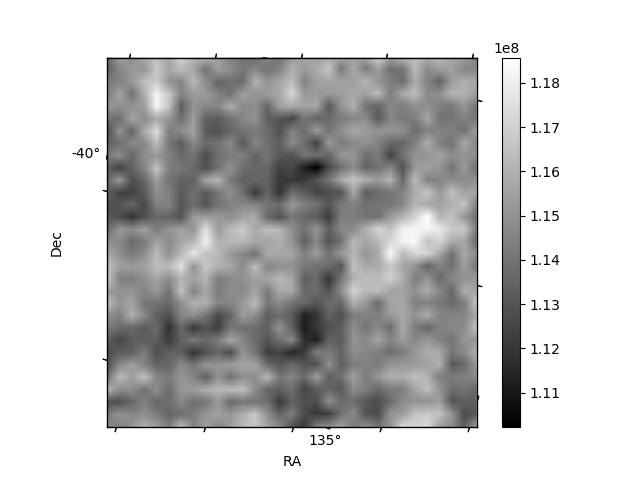
Histogram calculated using DETX and DETY for each event in the final _common_clean file
| Quadrant A | 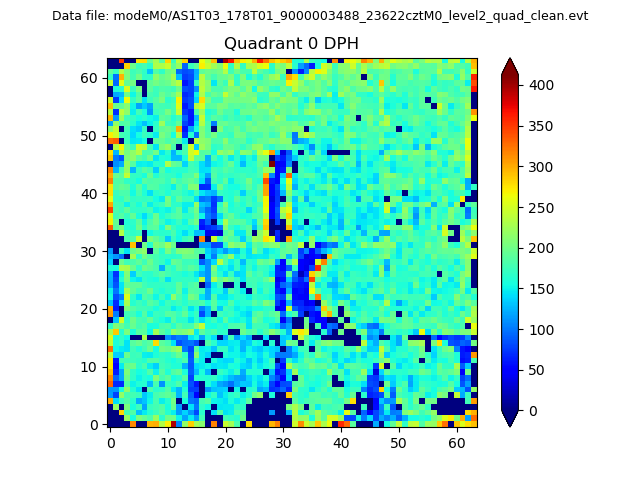 |
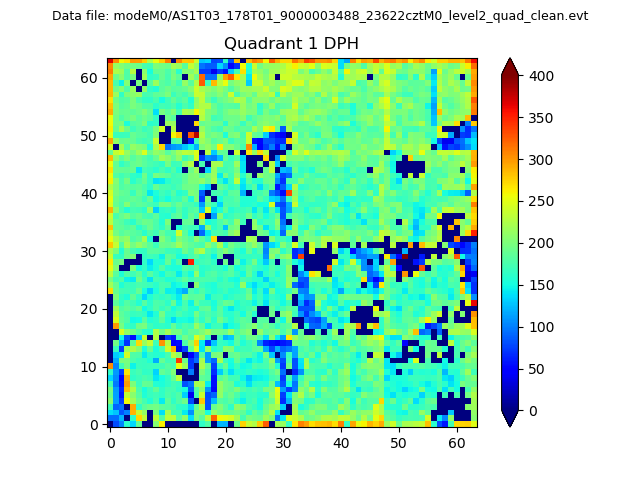 |
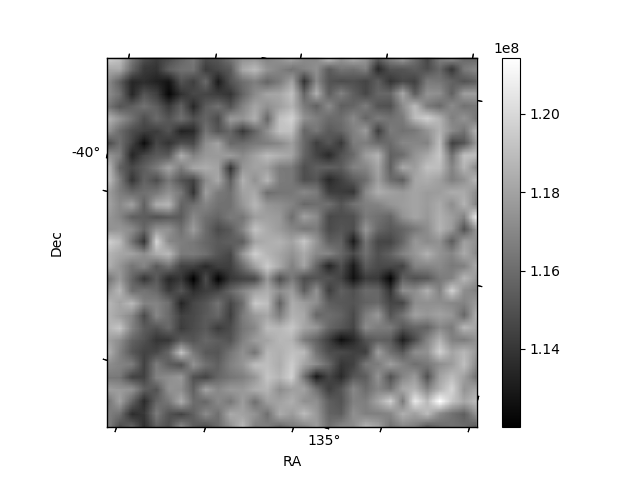
Quadrant B |
|---|---|---|---|
| Quadrant D | 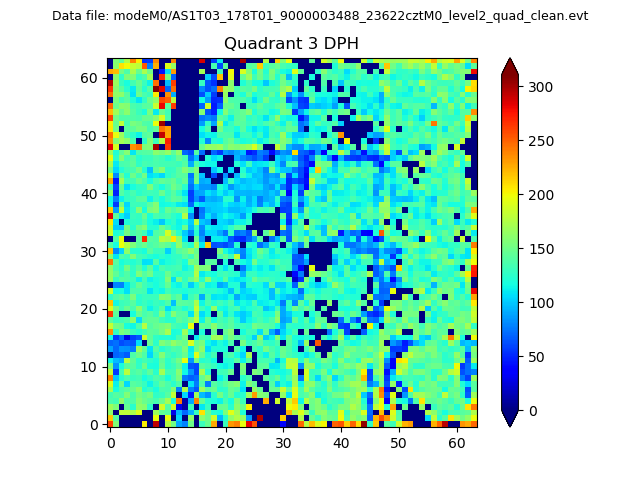 |
 |
Quadrant C |
| Plot type | Count rate plots | Images |
|---|---|---|
| Comparison with Poisson distribution Blue bars denote a histogram of data divided into 1 sec bins. Red curve is a Poisson curve with rate = median count rate of data. |
 |
 |
| Quadrant-wise count rates Data is divided into 100 sec bins |
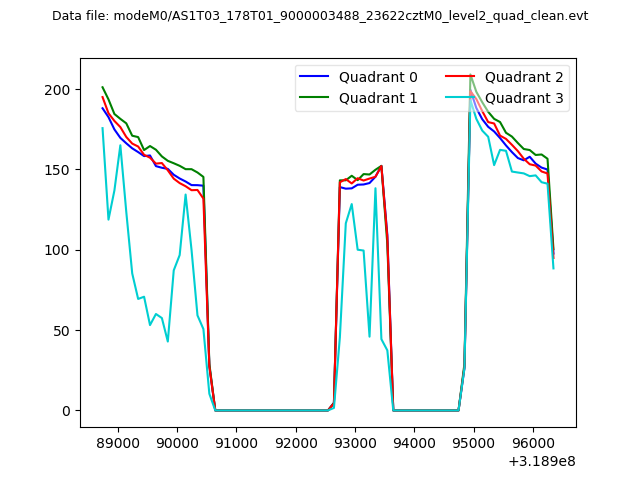 |
|
| Module-wise count rates for Quadrant A Data is divided into 100 sec bins |
 |
 |
| Module-wise count rates for Quadrant B Data is divided into 100 sec bins |
 |
 |
| Module-wise count rates for Quadrant C Data is divided into 100 sec bins |
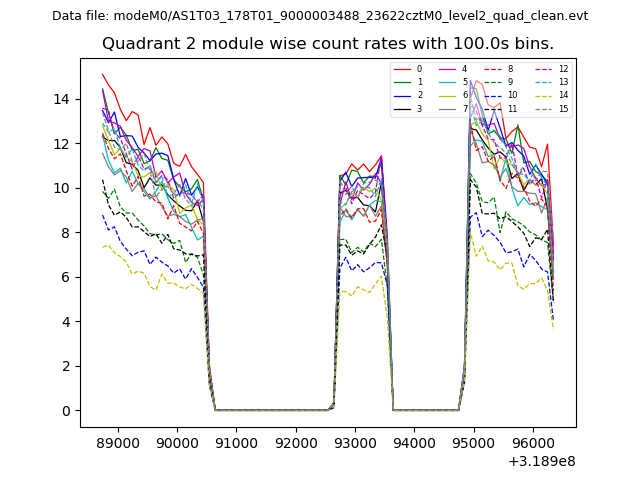 |
 |
| Module-wise count rates for Quadrant D Data is divided into 100 sec bins |
 |
 |
| Parameter | Plot |
|---|---|
| CZT HV Monitor | 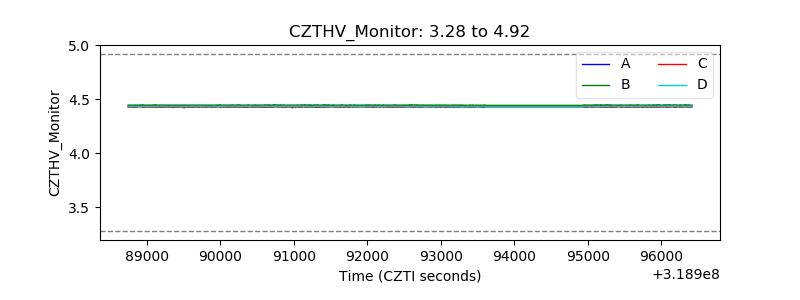 |
| D_VDD | 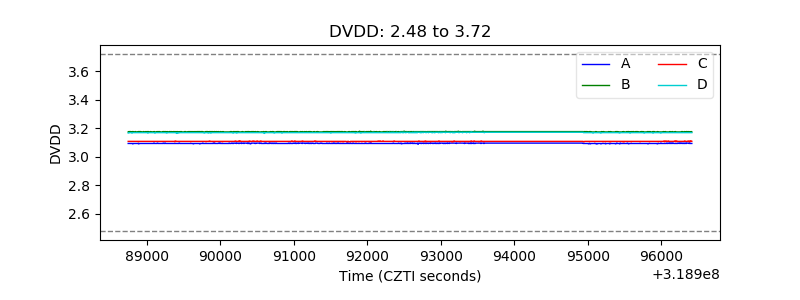 |
| Temperature 1 | 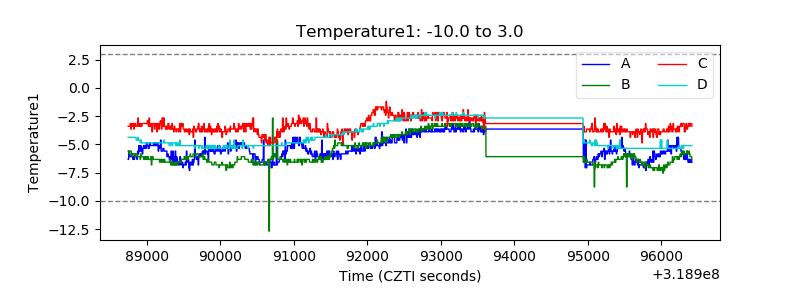 |
| Veto HV Monitor |  |
| Veto LLD | 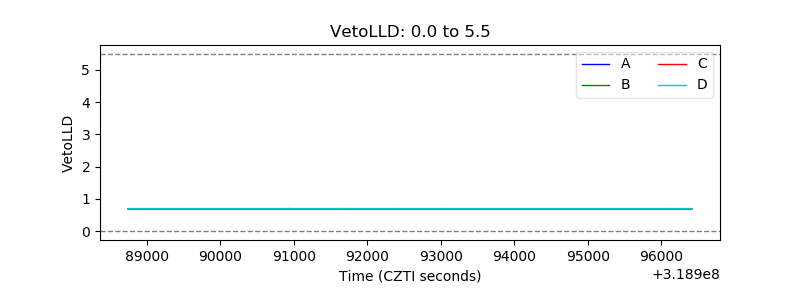 |
| Alpha Counter | 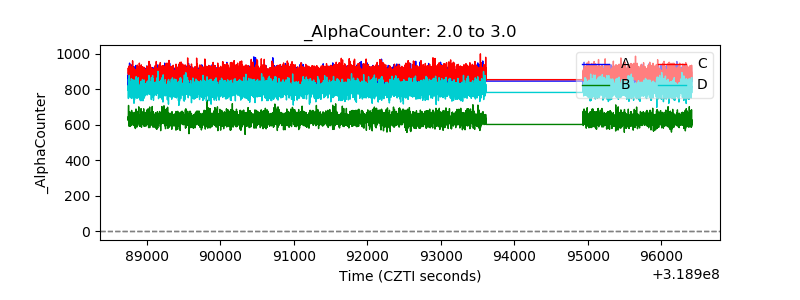 |
| _CPM_Rate | 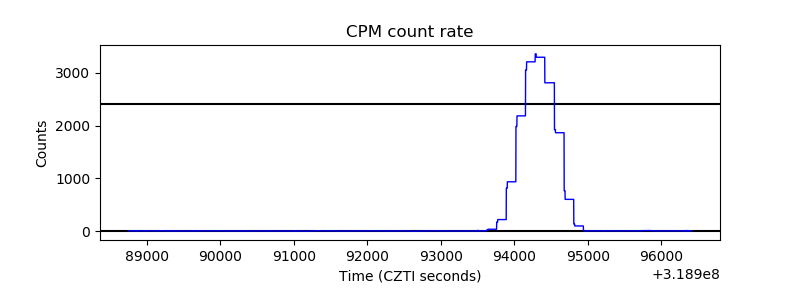 |
| CZT Counter |  |
| +2.5 Volts monitor | 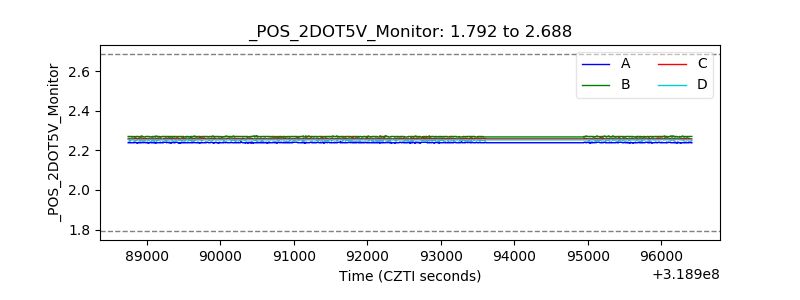 |
| +5 Volts monitor |  |
| _ROLL_ROT | 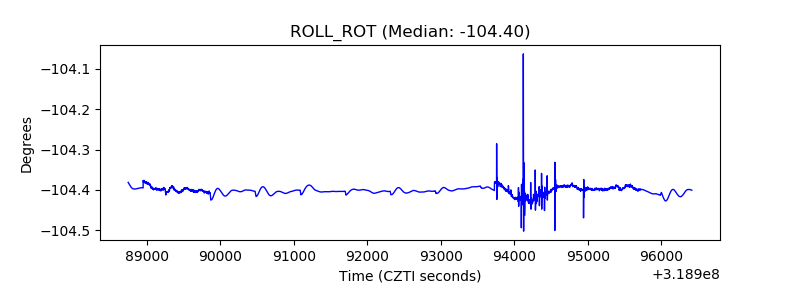 |
| _Roll_DEC |  |
| _Roll_RA |  |
| Veto Counter |  |