| Param | Original file | Final file |
|---|---|---|
| Filename | modeM0/AS1T03_178T01_9000003488_23623cztM0_level2.evt | modeM0/AS1T03_178T01_9000003488_23623cztM0_level2_quad_clean.evt |
| Size (bytes) | 618,431,040 | 93,242,880 |
| Size | 589.8 MB | 88.9 MB |
| Events in quadrant A | 3,209,689 | 600,276 |
| Events in quadrant B | 3,584,773 | 624,797 |
| Events in quadrant C | 3,415,638 | 603,367 |
| Events in quadrant D | 8,091,900 | 554,547 |
| Mode M0 | |||
|---|---|---|---|
| Quadrant | BADHDUFLAG | Total packets | Discarded packets |
| A | 0 | 13157 | 2 |
| B | 0 | 14369 | 2 |
| C | 0 | 13665 | 2 |
| D | 0 | 28303 | 2 |
| Mode M9 | |||
|---|---|---|---|
| Quadrant | BADHDUFLAG | Total packets | Discarded packets |
| A | 0 | 17 | 0 |
| B | 0 | 18 | 0 |
| C | 0 | 18 | 0 |
| D | 0 | 18 | 0 |
| Mode SS | |||
|---|---|---|---|
| Quadrant | BADHDUFLAG | Total packets | Discarded packets |
| A | 0 | 130 | 0 |
| B | 0 | 130 | 0 |
| C | 0 | 130 | 0 |
| D | 0 | 130 | 0 |
| Quadrant | Total seconds | Saturated seconds | Saturation percentage |
|---|---|---|---|
| A | 6308 | 14 | 0.221940% |
| B | 6308 | 70 | 1.109702% |
| C | 6308 | 55 | 0.871909% |
| D | 6308 | 1437 | 22.780596% |
Noise dominated data is calculated using 1-second bins in cleaned event files. If a bin has >2000 counts, and if more than 50% of those come from <1% of pixels, then it is considered to be noise-dominated and hence unusable.
| Quadrant | # 1 sec bins | Bins with >0 counts | Bins with >2000 counts | High rate bins dominated by noise | Noise dominated (total time) | Noise dominated (detector-on time) | Marked lightcurve |
|---|---|---|---|---|---|---|---|
| A | 7673 | 6309 | 0 | 0 | 0.00% | 0.00% | 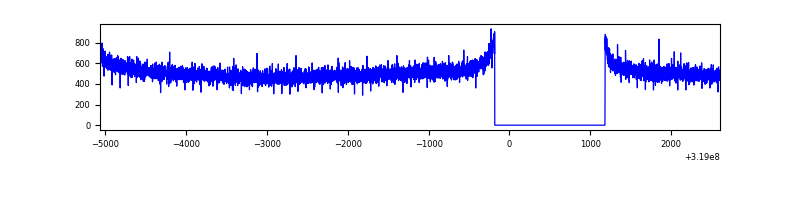 |
| B | 7673 | 6308 | 13 | 13 | 0.17% | 0.21% | 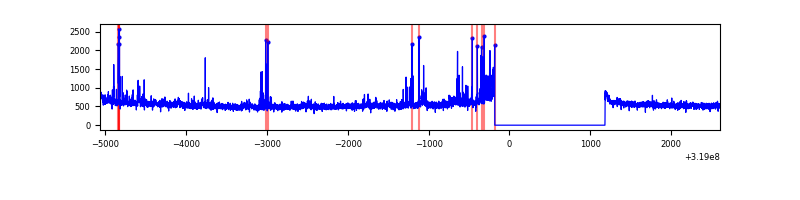 |
| C | 7673 | 6309 | 1 | 1 | 0.01% | 0.02% | 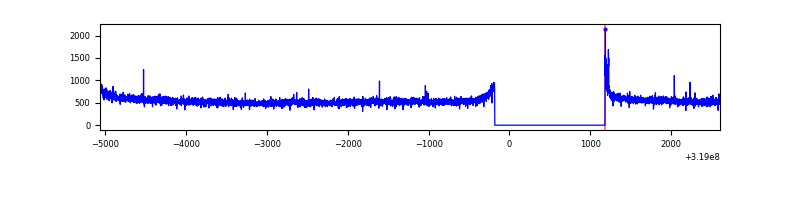 |
| D | 7673 | 6308 | 1397 | 1397 | 18.21% | 22.15% | 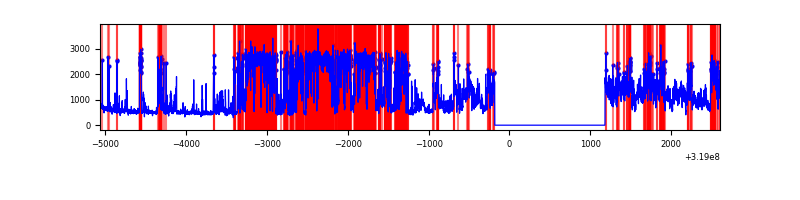 |
Top three noisy pixels from each quadrant. If the there are fewer than three noisy pixels in the level2.evt file, extra rows are filled as -1
| Pixel properties | Quadrant properties | ||||||
|---|---|---|---|---|---|---|---|
| Quadrant | DetID | PixID | Counts | Sigma | Mean | Median | Sigma |
| A | 13 | 254 | 8483 | 46.62 | 833 | 818 | 164.4 |
| A | 0 | 226 | 7132 | 38.4 | 833 | 818 | 164.4 |
| A | 3 | 137 | 6916 | 37.09 | 833 | 818 | 164.4 |
| B | 3 | 64 | 171210 | 1085.53 | 846 | 828 | 157.0 |
| B | 0 | 189 | 61410 | 385.98 | 846 | 828 | 157.0 |
| B | 0 | 229 | 23295 | 143.14 | 846 | 828 | 157.0 |
| C | 14 | 238 | 132869 | 687.48 | 833 | 842 | 192.0 |
| C | 0 | 10 | 19403 | 96.65 | 833 | 842 | 192.0 |
| C | 7 | 247 | 9672 | 45.98 | 833 | 842 | 192.0 |
| D | 1 | 52 | 5192595 | 28535.56 | 758 | 739 | 181.9 |
| D | 2 | 234 | 21330 | 113.17 | 758 | 739 | 181.9 |
| D | 12 | 233 | 20049 | 106.13 | 758 | 739 | 181.9 |
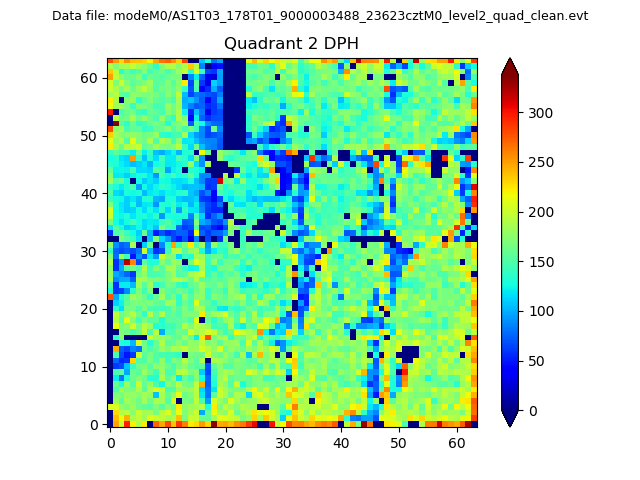
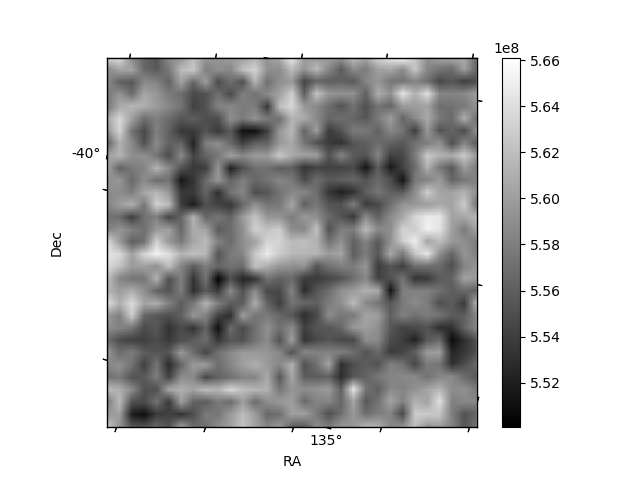
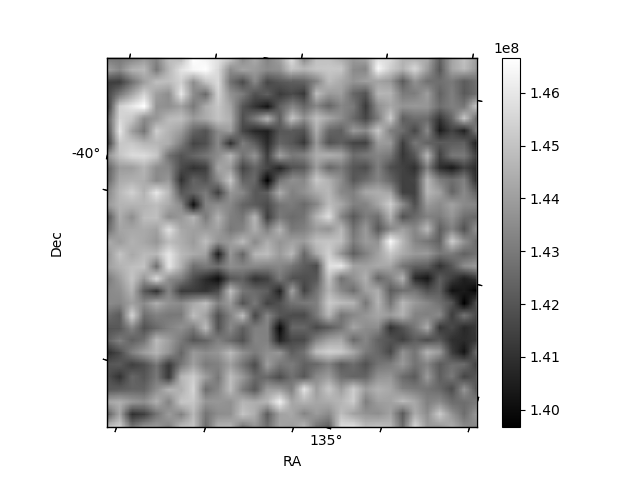
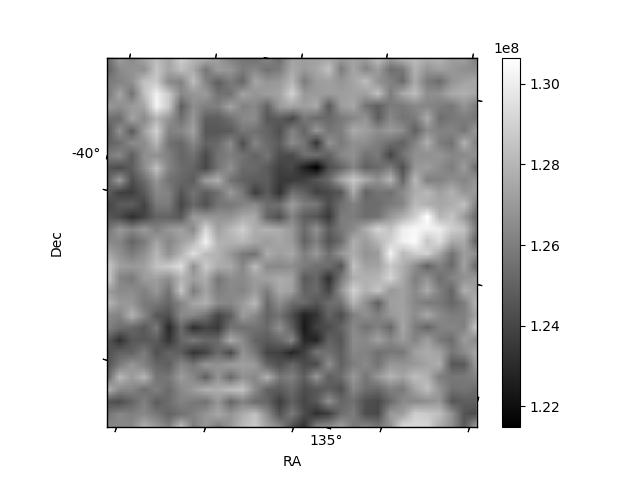
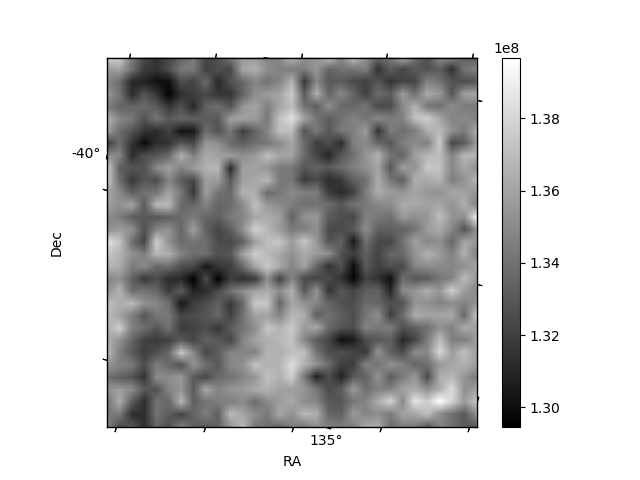
Histogram calculated using DETX and DETY for each event in the final _common_clean file
| Quadrant A | 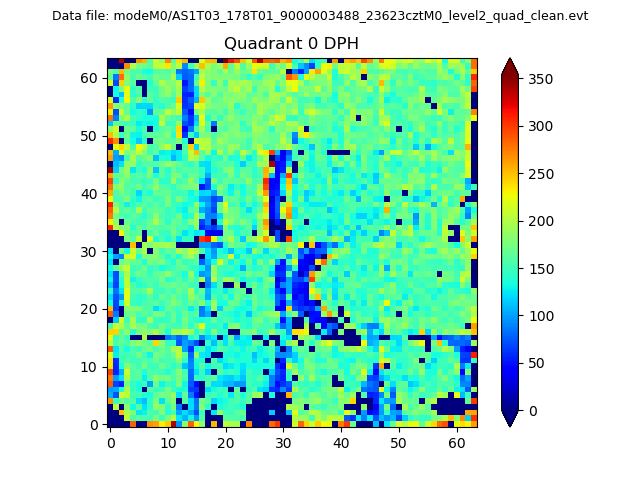 |
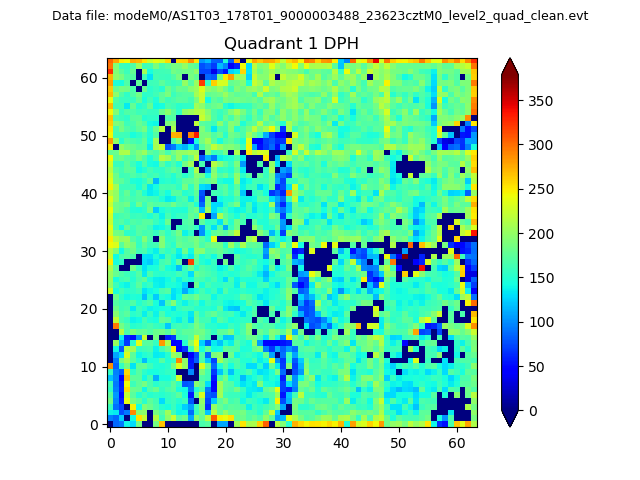 |
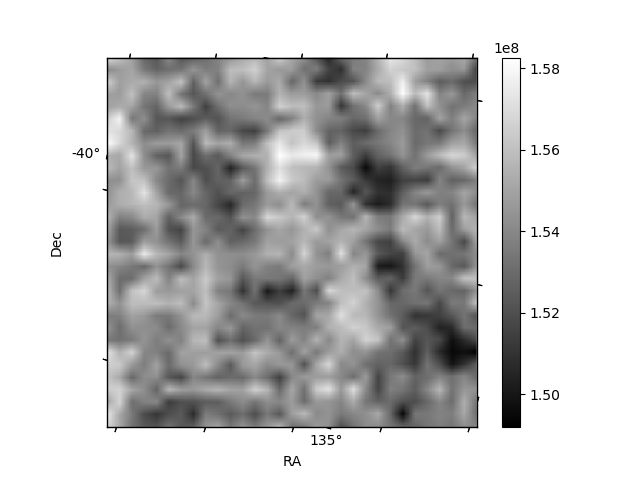
Quadrant B |
|---|---|---|---|
| Quadrant D | 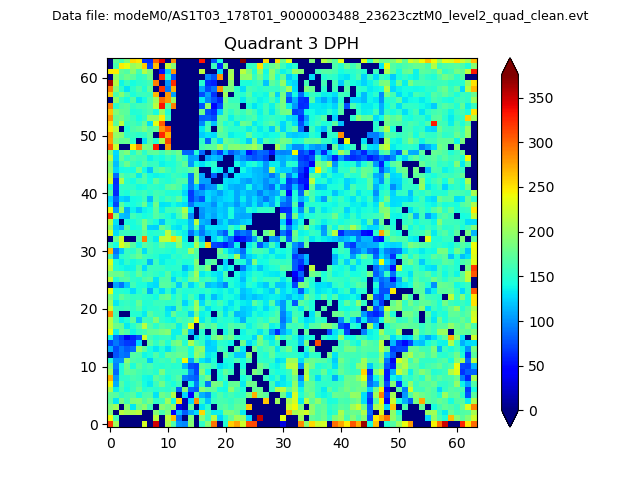 |
 |
Quadrant C |
| Plot type | Count rate plots | Images |
|---|---|---|
| Comparison with Poisson distribution Blue bars denote a histogram of data divided into 1 sec bins. Red curve is a Poisson curve with rate = median count rate of data. |
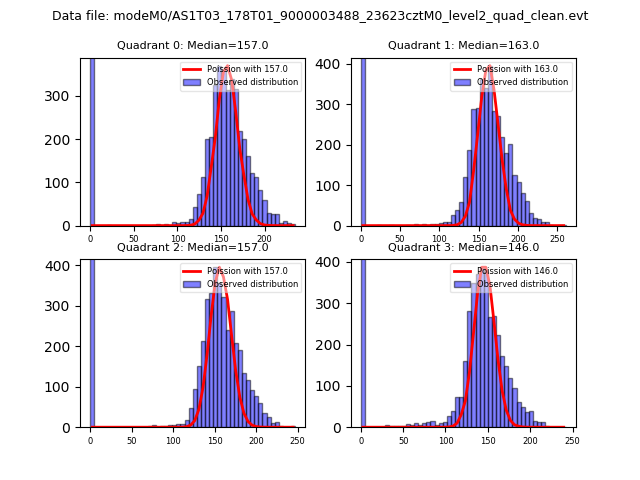 |
 |
| Quadrant-wise count rates Data is divided into 100 sec bins |
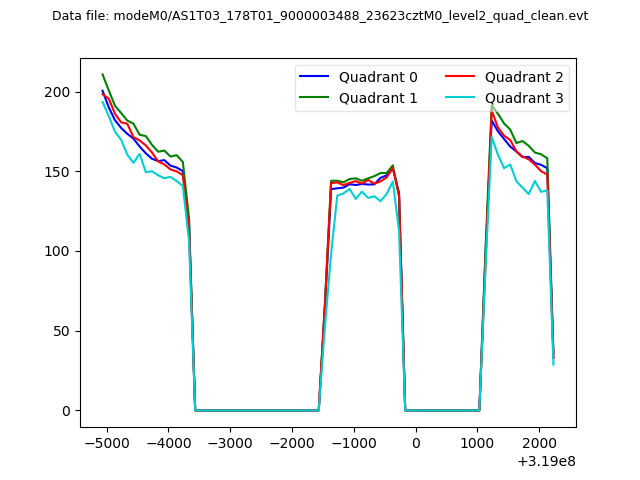 |
|
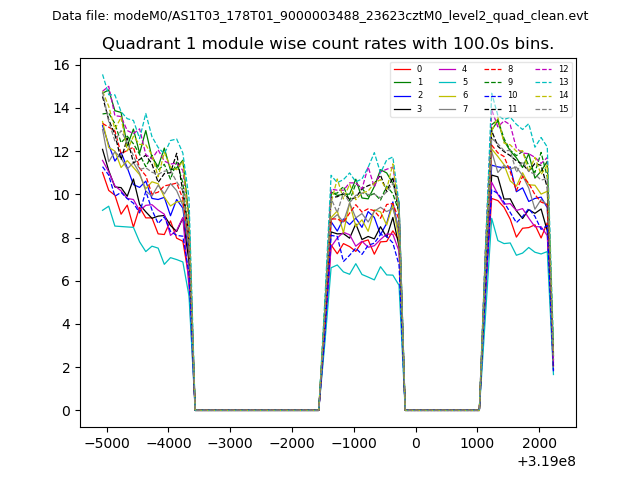
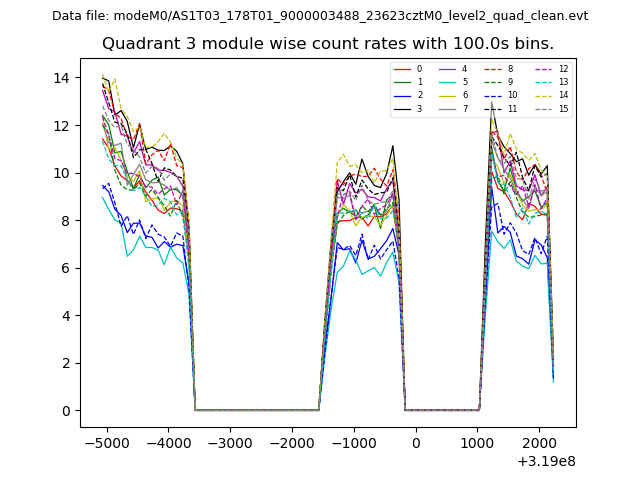
| Module-wise count rates for Quadrant A Data is divided into 100 sec bins |
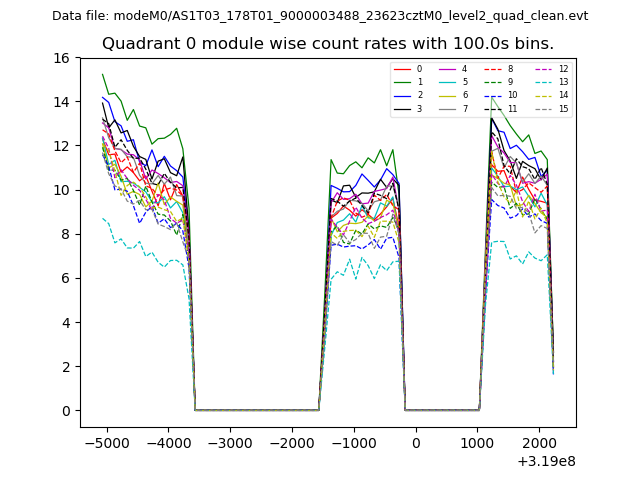 |
 |
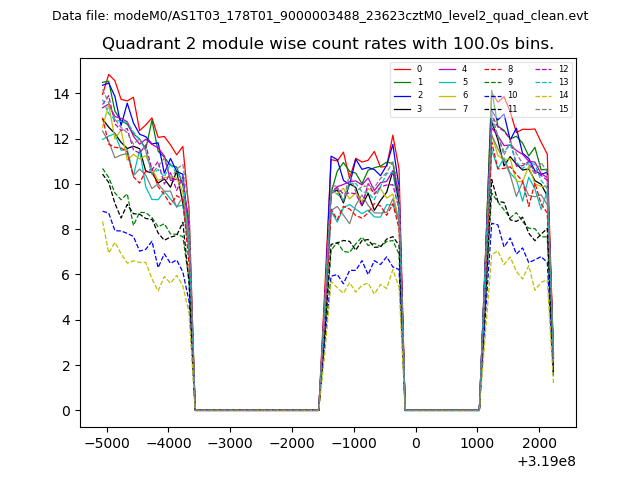
| Module-wise count rates for Quadrant B Data is divided into 100 sec bins |
 |
 |
| Module-wise count rates for Quadrant C Data is divided into 100 sec bins |
 |
 |
| Module-wise count rates for Quadrant D Data is divided into 100 sec bins |
 |
 |
| Parameter | Plot |
|---|---|
| CZT HV Monitor | 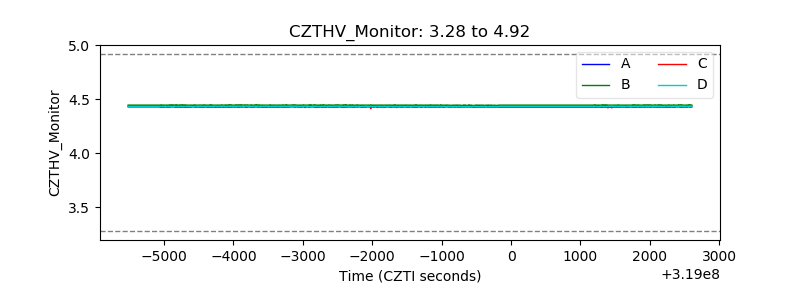 |
| D_VDD | 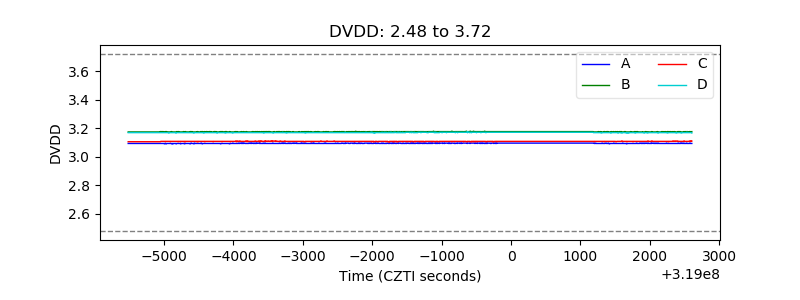 |
| Temperature 1 | 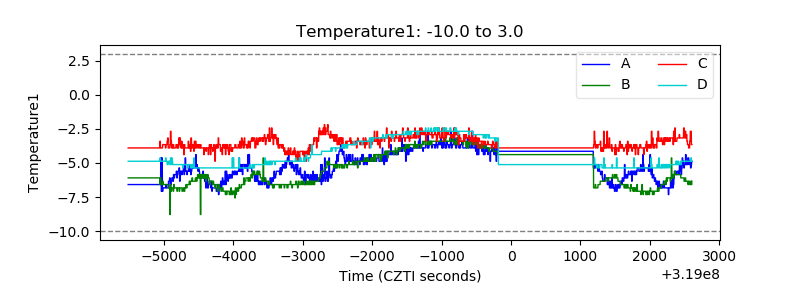 |
| Veto HV Monitor |  |
| Veto LLD | 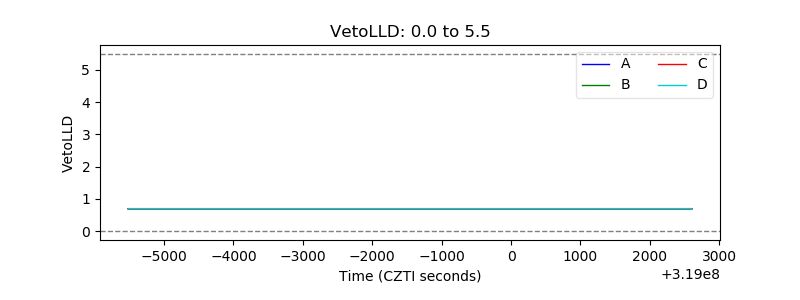 |
| Alpha Counter | 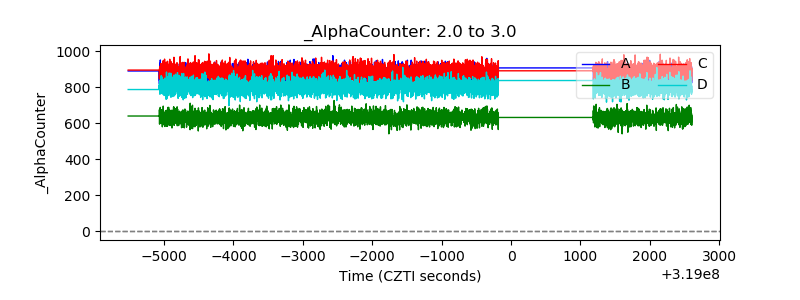 |
| _CPM_Rate | 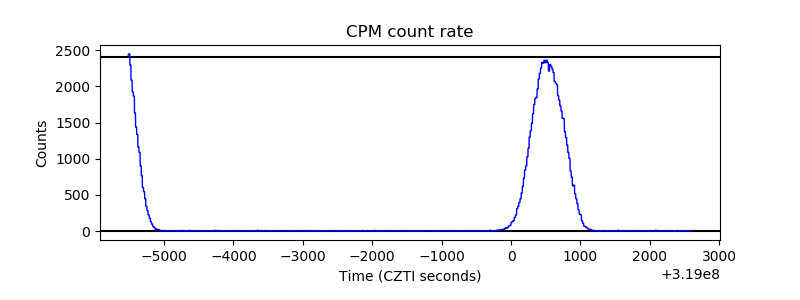 |
| CZT Counter | 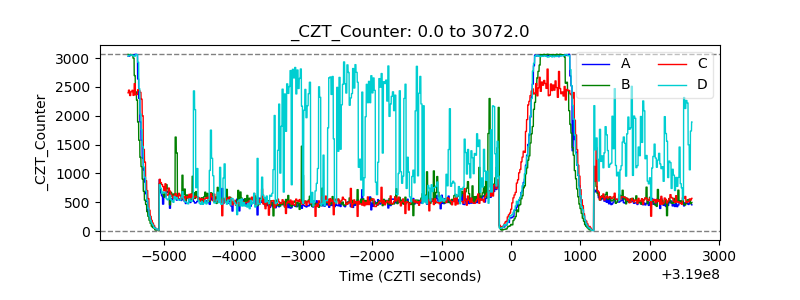 |
| +2.5 Volts monitor |  |
| +5 Volts monitor |  |
| _ROLL_ROT | 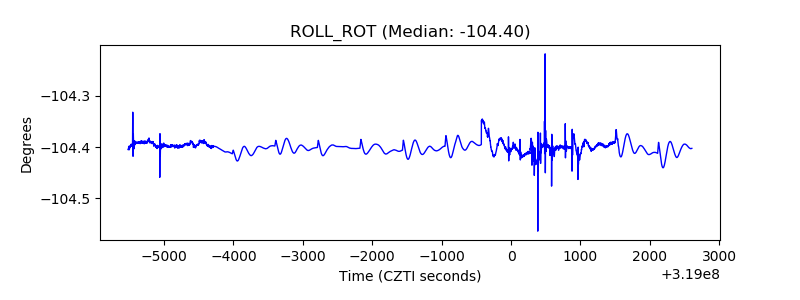 |
| _Roll_DEC | 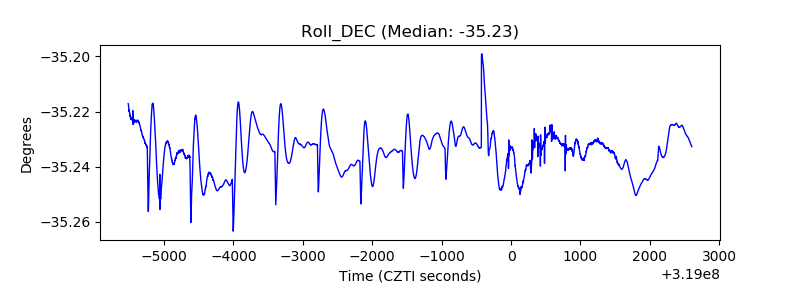 |
| _Roll_RA | 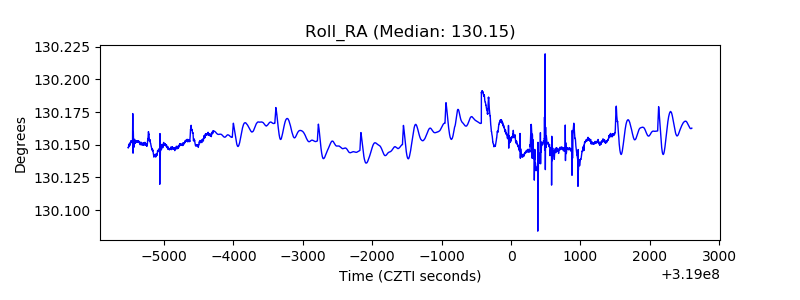 |
| Veto Counter | 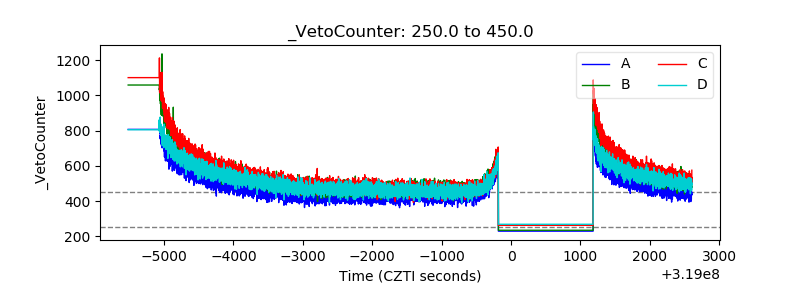 |