| Param | Original file | Final file |
|---|---|---|
| Filename | modeM0/AS1T03_178T01_9000003488_23624cztM0_level2.evt | modeM0/AS1T03_178T01_9000003488_23624cztM0_level2_quad_clean.evt |
| Size (bytes) | 543,352,320 | 83,730,240 |
| Size | 518.2 MB | 79.9 MB |
| Events in quadrant A | 3,143,699 | 530,402 |
| Events in quadrant B | 3,319,478 | 552,233 |
| Events in quadrant C | 3,330,719 | 528,129 |
| Events in quadrant D | 6,236,728 | 486,852 |
| Mode M0 | |||
|---|---|---|---|
| Quadrant | BADHDUFLAG | Total packets | Discarded packets |
| A | 0 | 12974 | 2 |
| B | 0 | 13367 | 2 |
| C | 0 | 13389 | 2 |
| D | 0 | 22705 | 2 |
| Mode M9 | |||
|---|---|---|---|
| Quadrant | BADHDUFLAG | Total packets | Discarded packets |
| A | 0 | 16 | 0 |
| B | 0 | 17 | 0 |
| C | 0 | 17 | 0 |
| D | 0 | 17 | 0 |
| Mode SS | |||
|---|---|---|---|
| Quadrant | BADHDUFLAG | Total packets | Discarded packets |
| A | 0 | 128 | 0 |
| B | 0 | 128 | 0 |
| C | 0 | 128 | 0 |
| D | 0 | 128 | 0 |
| Quadrant | Total seconds | Saturated seconds | Saturation percentage |
|---|---|---|---|
| A | 6271 | 35 | 0.558125% |
| B | 6271 | 71 | 1.132196% |
| C | 6271 | 110 | 1.754106% |
| D | 6271 | 395 | 6.298836% |
Noise dominated data is calculated using 1-second bins in cleaned event files. If a bin has >2000 counts, and if more than 50% of those come from <1% of pixels, then it is considered to be noise-dominated and hence unusable.
| Quadrant | # 1 sec bins | Bins with >0 counts | Bins with >2000 counts | High rate bins dominated by noise | Noise dominated (total time) | Noise dominated (detector-on time) | Marked lightcurve |
|---|---|---|---|---|---|---|---|
| A | 7496 | 6271 | 0 | 0 | 0.00% | 0.00% | 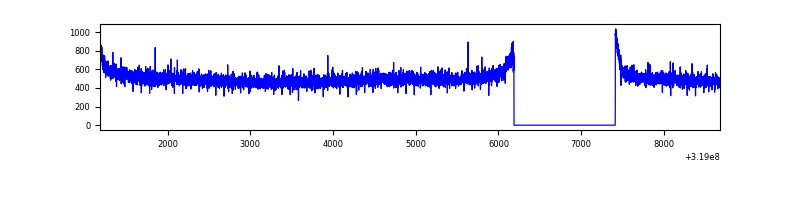 |
| B | 7496 | 6271 | 4 | 4 | 0.05% | 0.06% | 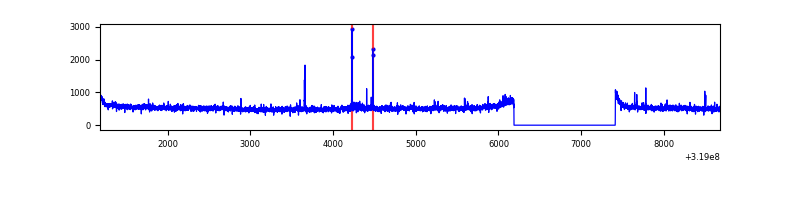 |
| C | 7496 | 6271 | 7 | 7 | 0.09% | 0.11% | 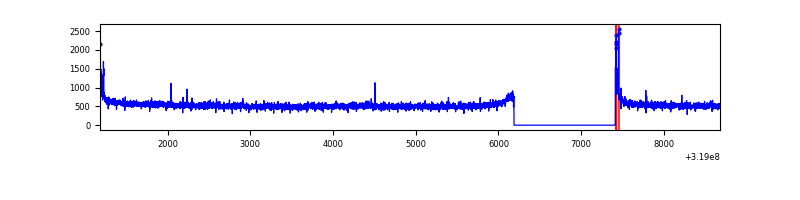 |
| D | 7496 | 6271 | 397 | 397 | 5.30% | 6.33% | 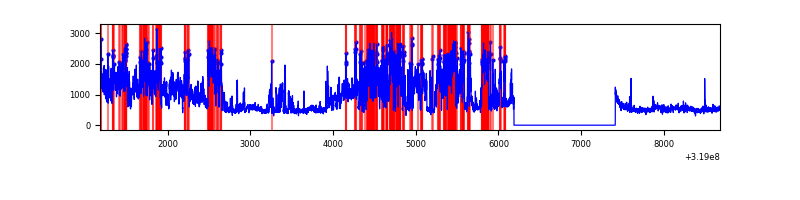 |
Top three noisy pixels from each quadrant. If the there are fewer than three noisy pixels in the level2.evt file, extra rows are filled as -1
| Pixel properties | Quadrant properties | ||||||
|---|---|---|---|---|---|---|---|
| Quadrant | DetID | PixID | Counts | Sigma | Mean | Median | Sigma |
| A | 13 | 254 | 8680 | 48.22 | 815 | 799 | 163.5 |
| A | 3 | 137 | 7194 | 39.12 | 815 | 799 | 163.5 |
| A | 0 | 226 | 6904 | 37.35 | 815 | 799 | 163.5 |
| B | 3 | 64 | 29352 | 183.16 | 825 | 803 | 155.9 |
| B | 0 | 229 | 28917 | 180.37 | 825 | 803 | 155.9 |
| B | 12 | 111 | 18650 | 114.5 | 825 | 803 | 155.9 |
| C | 14 | 238 | 126756 | 672.14 | 808 | 816 | 187.4 |
| C | 0 | 10 | 43607 | 228.37 | 808 | 816 | 187.4 |
| C | 7 | 247 | 6422 | 29.92 | 808 | 816 | 187.4 |
| D | 1 | 52 | 3095164 | 16133.62 | 797 | 776 | 191.8 |
| D | 12 | 233 | 90872 | 469.75 | 797 | 776 | 191.8 |
| D | 8 | 195 | 34152 | 174.02 | 797 | 776 | 191.8 |
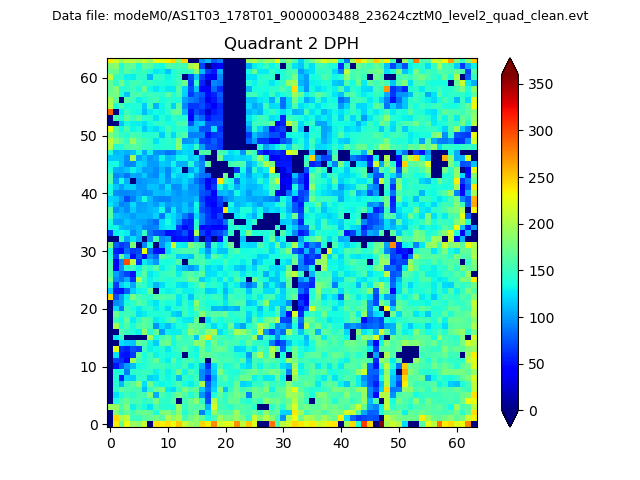
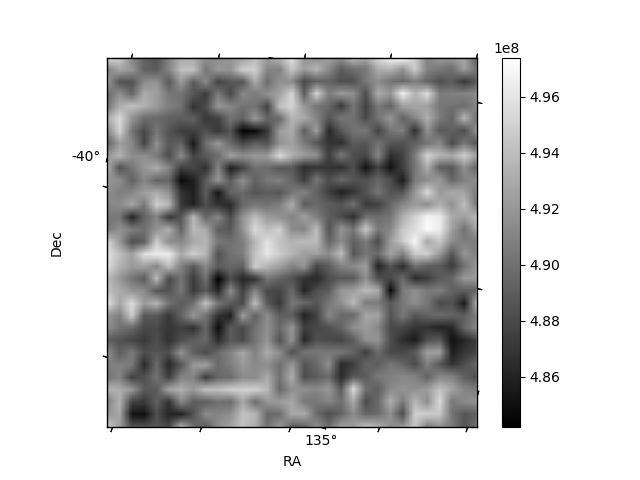
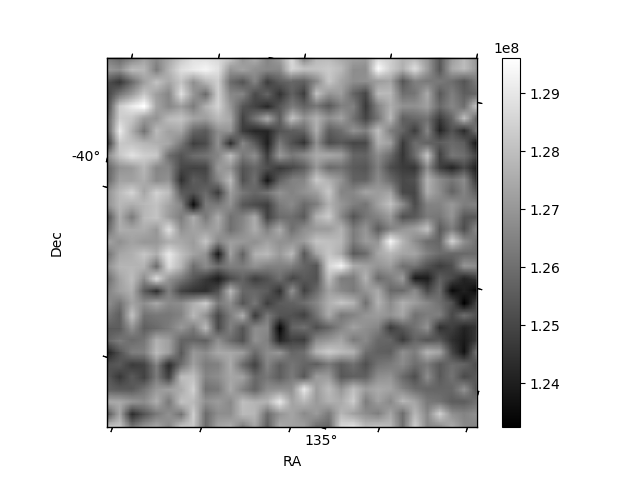
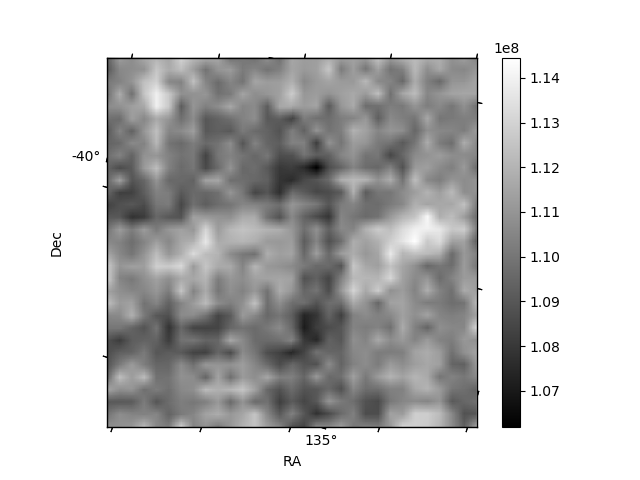
Histogram calculated using DETX and DETY for each event in the final _common_clean file
| Quadrant A | 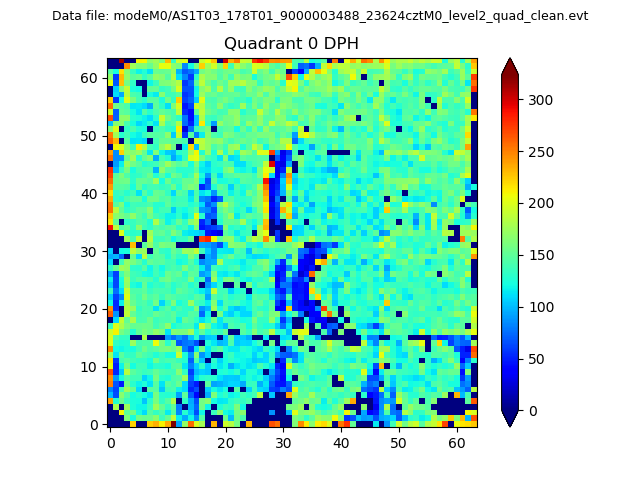 |
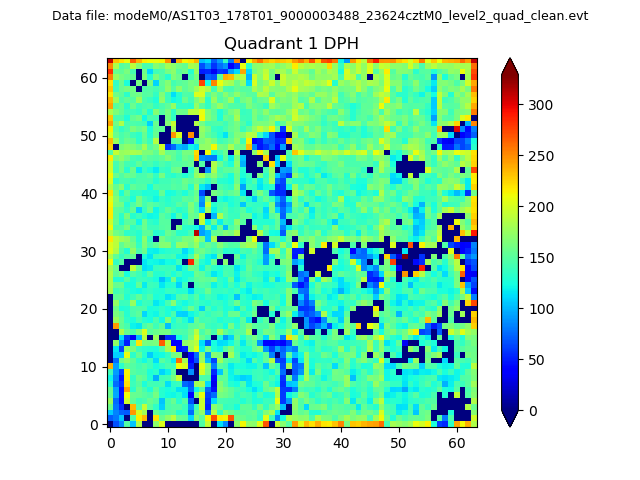 |
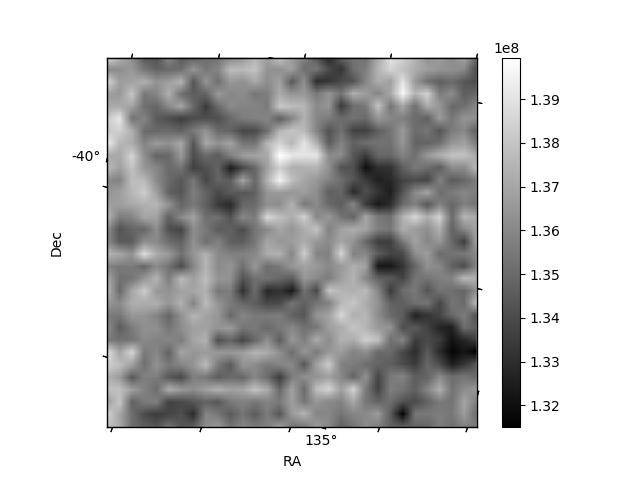
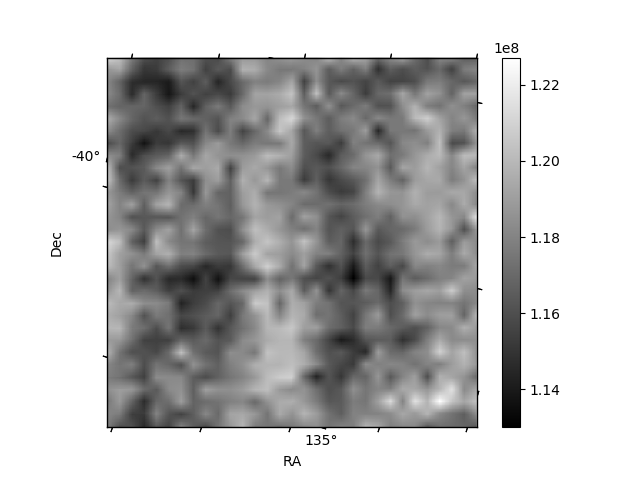
Quadrant B |
|---|---|---|---|
| Quadrant D | 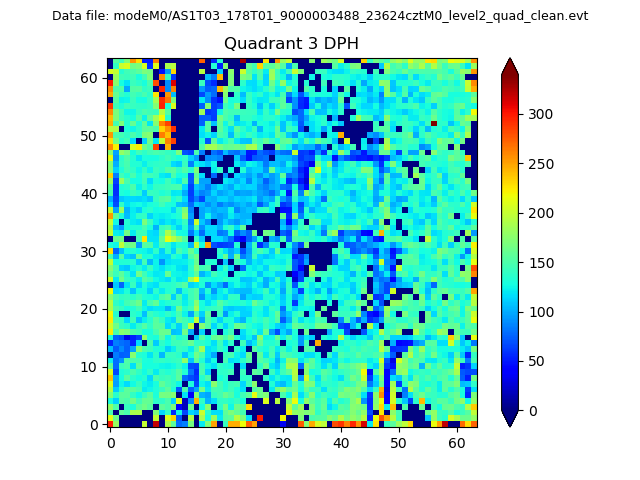 |
 |
Quadrant C |
| Plot type | Count rate plots | Images |
|---|---|---|
| Comparison with Poisson distribution Blue bars denote a histogram of data divided into 1 sec bins. Red curve is a Poisson curve with rate = median count rate of data. |
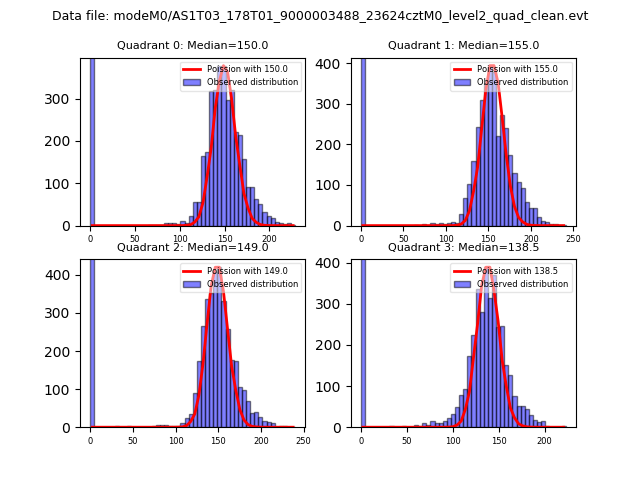 |
 |
| Quadrant-wise count rates Data is divided into 100 sec bins |
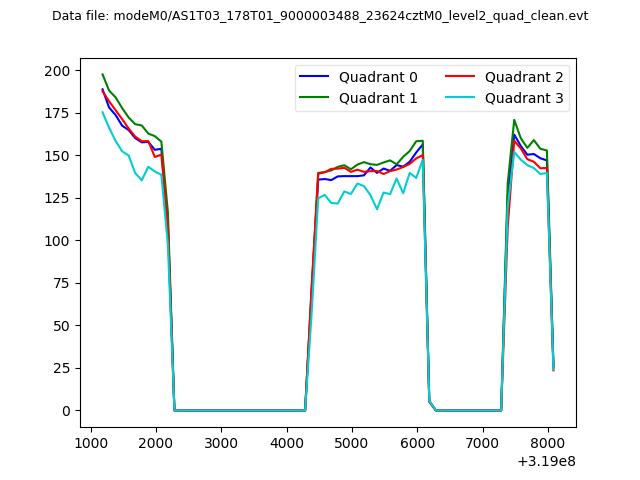 |
|
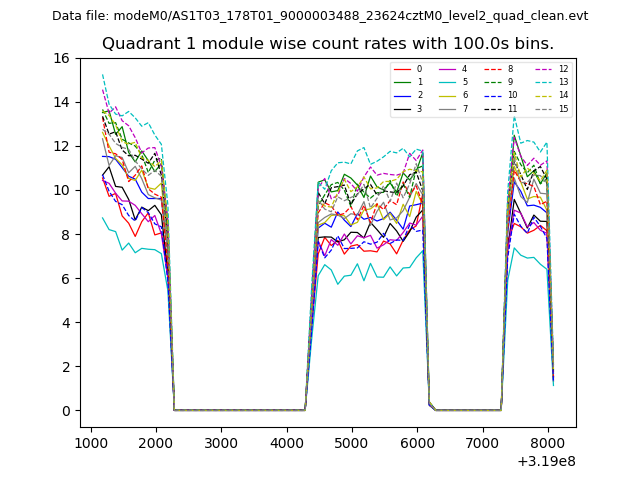
| Module-wise count rates for Quadrant A Data is divided into 100 sec bins |
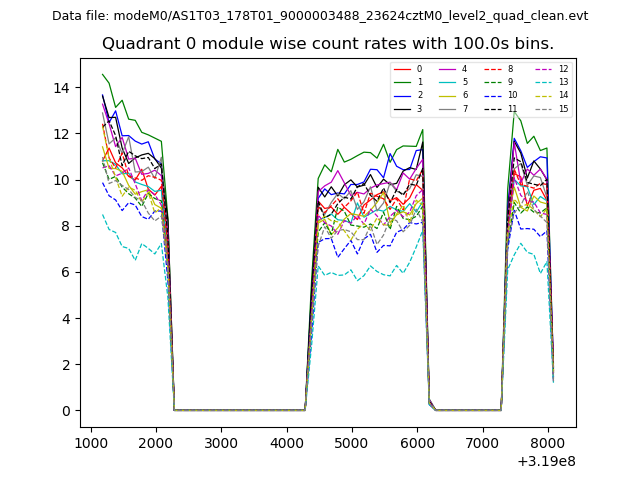 |
 |
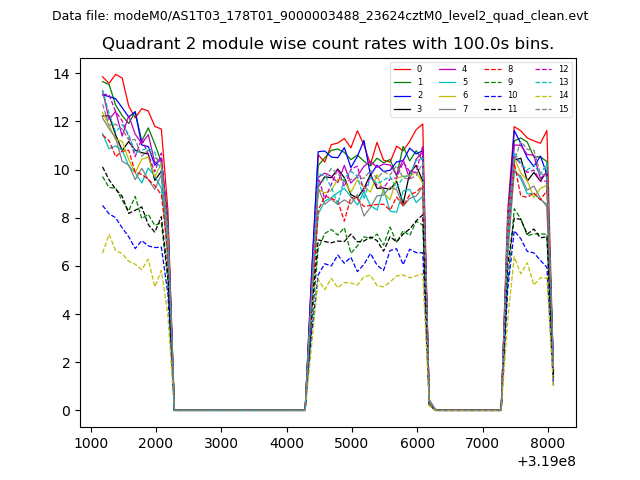
| Module-wise count rates for Quadrant B Data is divided into 100 sec bins |
 |
 |
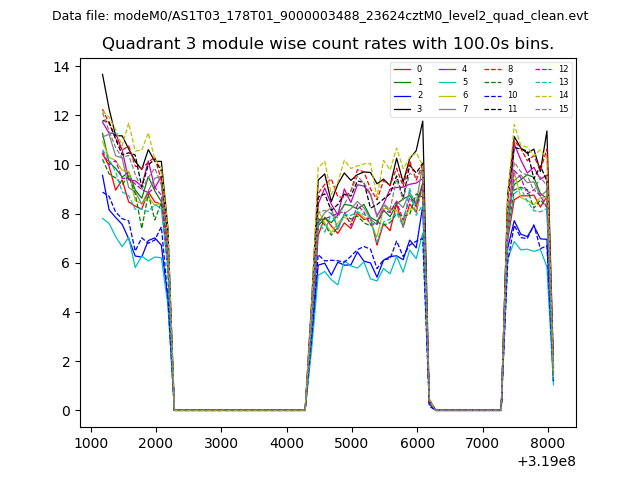
| Module-wise count rates for Quadrant C Data is divided into 100 sec bins |
 |
 |
| Module-wise count rates for Quadrant D Data is divided into 100 sec bins |
 |
 |
| Parameter | Plot |
|---|---|
| CZT HV Monitor | 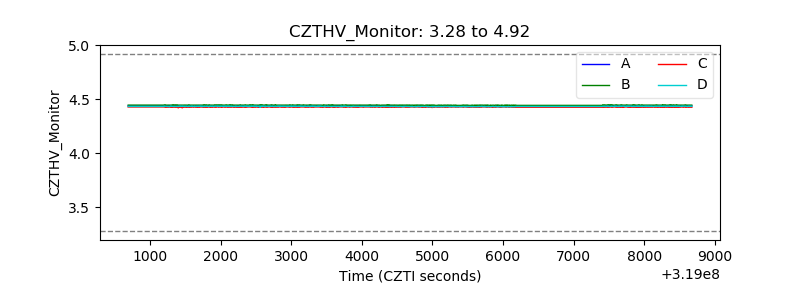 |
| D_VDD | 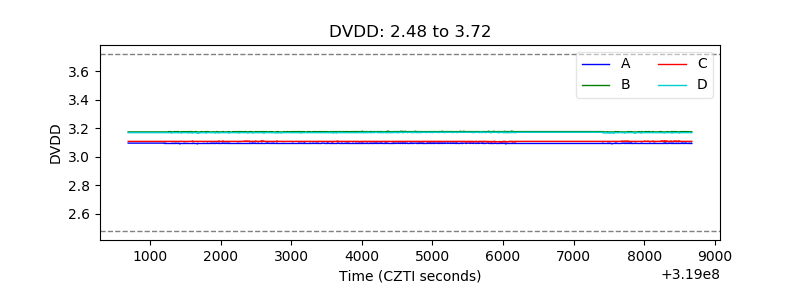 |
| Temperature 1 | 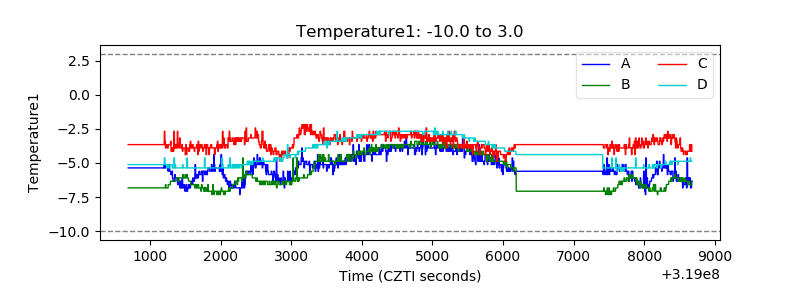 |
| Veto HV Monitor |  |
| Veto LLD | 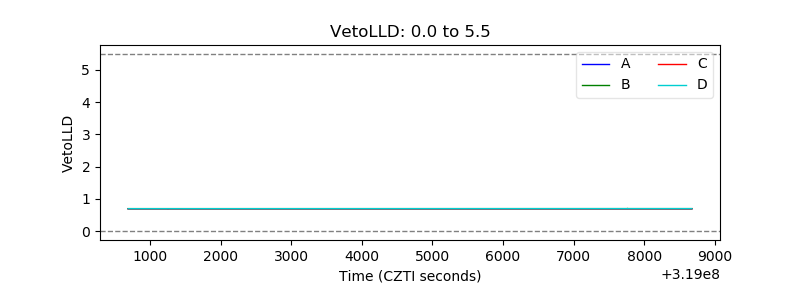 |
| Alpha Counter |  |
| _CPM_Rate | 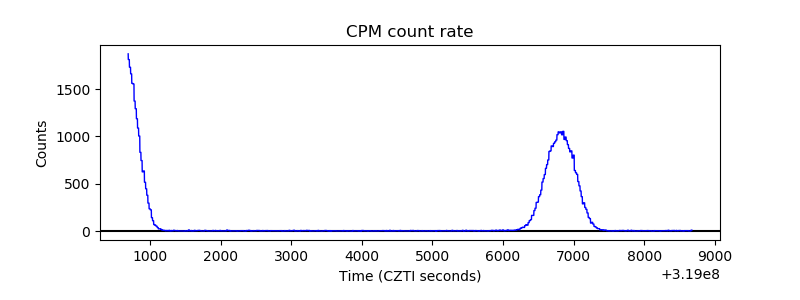 |
| CZT Counter | 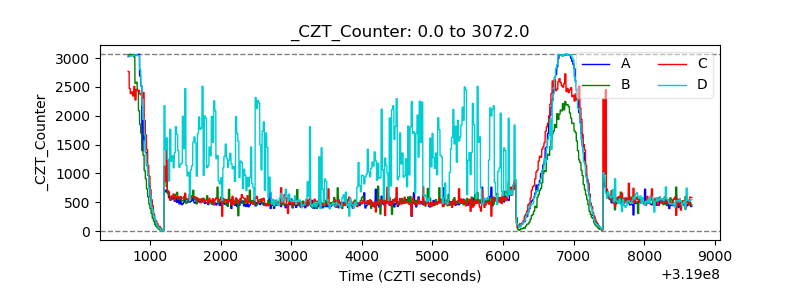 |
| +2.5 Volts monitor |  |
| +5 Volts monitor |  |
| _ROLL_ROT | 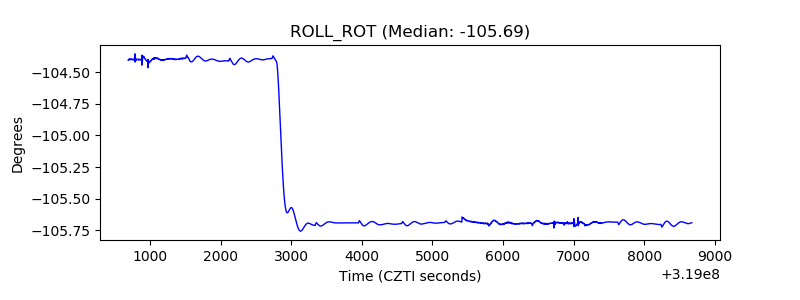 |
| _Roll_DEC | 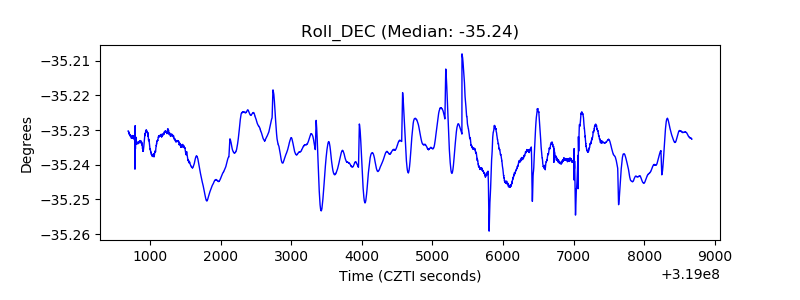 |
| _Roll_RA | 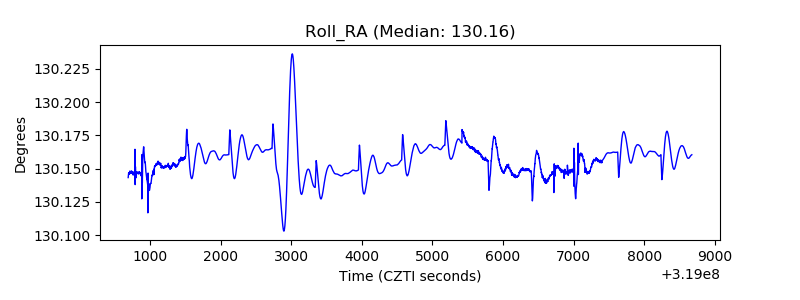 |
| Veto Counter | 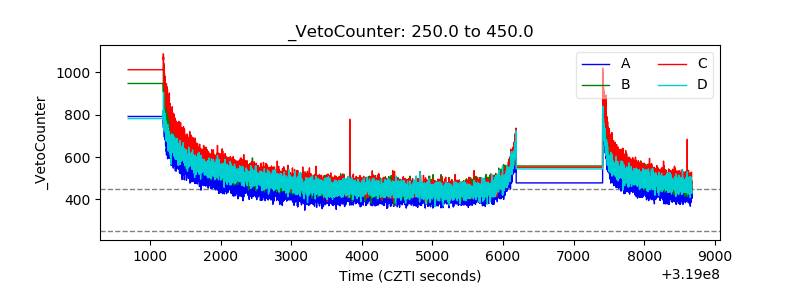 |