| Param | Original file | Final file |
|---|---|---|
| Filename | modeM0/AS1A07_147T01_9000003490cztM0_level2.fits | modeM0/AS1A07_147T01_9000003490cztM0_level2_quad_clean.evt |
| Size (bytes) | 960,920,640 | 849,663,360 |
| Size | 916.4 MB | 810.3 MB |
| Events in quadrant A | 6,014,336 | 5,016,797 |
| Events in quadrant B | 5,659,372 | 4,959,895 |
| Events in quadrant C | 5,834,722 | 4,818,216 |
| Events in quadrant D | 4,762,194 | 4,112,825 |
| Mode M9 | |||
|---|---|---|---|
| Quadrant | BADHDUFLAG | Total packets | Discarded packets |
| A | 0 | 157 | 0 |
| B | 0 | 157 | 0 |
| C | 0 | 157 | 0 |
| D | 0 | 157 | 0 |
| Mode SS | |||
|---|---|---|---|
| Quadrant | BADHDUFLAG | Total packets | Discarded packets |
| A | 0 | 2030 | 0 |
| B | 0 | 2032 | 0 |
| C | 0 | 2032 | 0 |
| D | 0 | 2028 | 0 |
| Mode M0 | |||
|---|---|---|---|
| Quadrant | BADHDUFLAG | Total packets | Discarded packets |
| A | 0 | 206449 | 0 |
| B | 0 | 241472 | 0 |
| C | 0 | 208764 | 0 |
| D | 0 | 326075 | 0 |
| Quadrant | Total seconds | Saturated seconds | Saturation percentage |
|---|---|---|---|
| A | 99546 | 1224 | 1.229582% |
| B | 99551 | 4224 | 4.243051% |
| C | 99524 | 1881 | 1.889996% |
| D | 99556 | 14387 | 14.451163% |
Noise dominated data is calculated using 1-second bins in cleaned event files. If a bin has >2000 counts, and if more than 50% of those come from <1% of pixels, then it is considered to be noise-dominated and hence unusable.
| Quadrant | # 1 sec bins | Bins with >0 counts | Bins with >2000 counts | High rate bins dominated by noise | Noise dominated (total time) | Noise dominated (detector-on time) | Marked lightcurve |
|---|---|---|---|---|---|---|---|
| A | 129563 | 99590 | 0 | 0 | 0.00% | 0.00% | 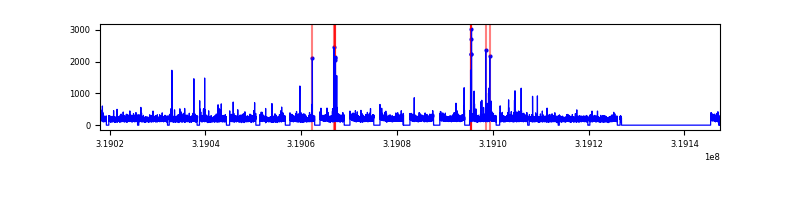 |
| B | 129562 | 99500 | 0 | 0 | 0.00% | 0.00% | 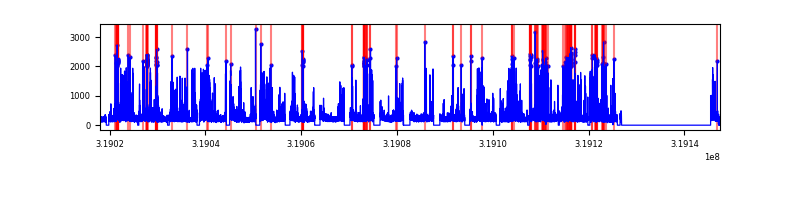 |
| C | 129563 | 99565 | 0 | 0 | 0.00% | 0.00% |  |
| D | 129563 | 99459 | 0 | 0 | 0.00% | 0.00% |  |
Top three noisy pixels from each quadrant. If the there are fewer than three noisy pixels in the level2.evt file, extra rows are filled as -1
| Pixel properties | Quadrant properties | ||||||
|---|---|---|---|---|---|---|---|
| Quadrant | DetID | PixID | Counts | Sigma | Mean | Median | Sigma |
| A | 0 | 29 | 5922 | 11.53 | 1561 | 1459 | 387.0 |
| A | 7 | 110 | 4814 | 8.67 | 1561 | 1459 | 387.0 |
| A | 0 | 30 | 4536 | 7.95 | 1561 | 1459 | 387.0 |
| B | 2 | 9 | 4597 | 10.66 | 1497 | 1424 | 297.5 |
| B | 2 | 8 | 3883 | 8.26 | 1497 | 1424 | 297.5 |
| B | 5 | 128 | 3741 | 7.79 | 1497 | 1424 | 297.5 |
| C | 12 | 241 | 4029 | 6.67 | 1541 | 1440 | 388.0 |
| C | 9 | 242 | 3907 | 6.36 | 1541 | 1440 | 388.0 |
| C | 3 | 126 | 3884 | 6.3 | 1541 | 1440 | 388.0 |
| D | 3 | 14 | 3427 | 6.07 | 1358 | 1230 | 361.8 |
| D | 7 | 3 | 3337 | 5.82 | 1358 | 1230 | 361.8 |
| D | 6 | 231 | 3323 | 5.78 | 1358 | 1230 | 361.8 |
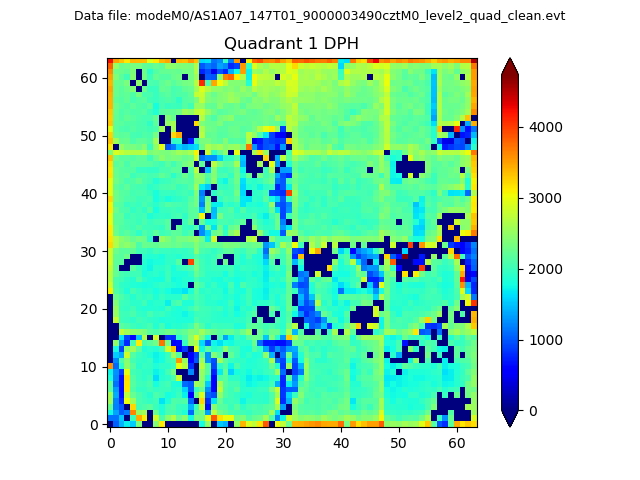
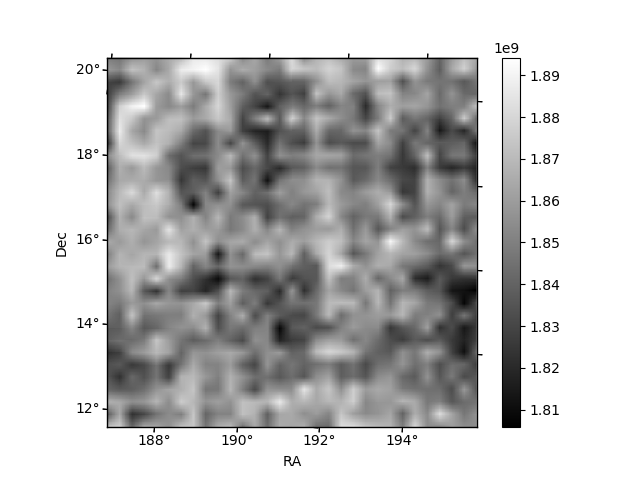
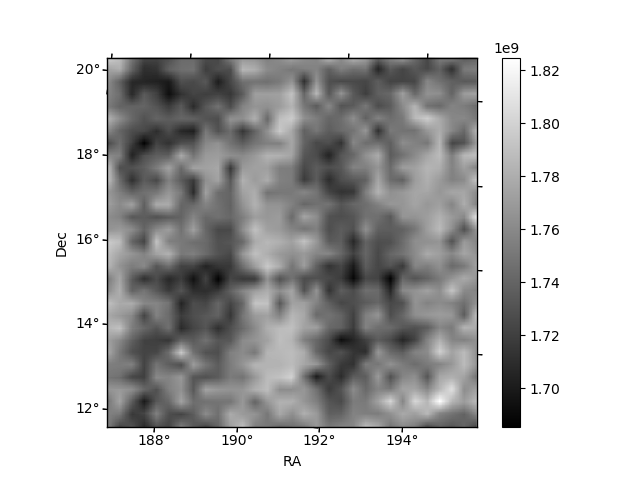
Histogram calculated using DETX and DETY for each event in the final _common_clean file
| Quadrant A |  |
 |
Quadrant B |
|---|---|---|---|
| Quadrant D | 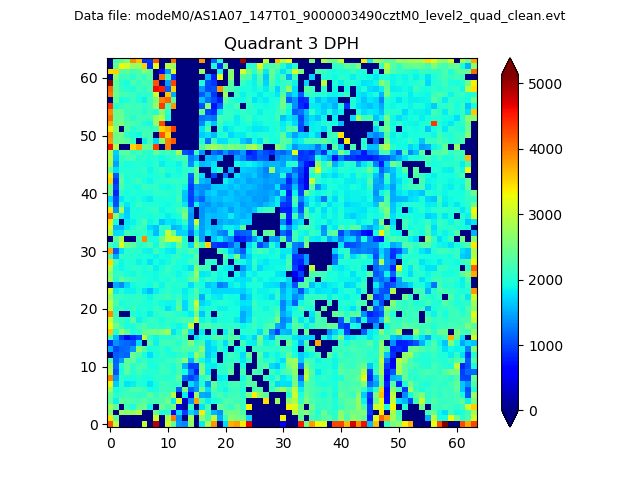 |
 |
Quadrant C |
| Plot type | Count rate plots | Images |
|---|---|---|
| Comparison with Poisson distribution Blue bars denote a histogram of data divided into 1 sec bins. Red curve is a Poisson curve with rate = median count rate of data. |
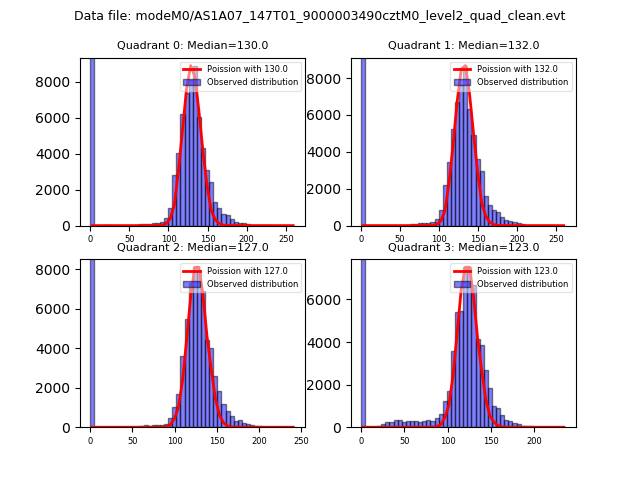 |
 |
| Quadrant-wise count rates Data is divided into 100 sec bins |
 |
|
| Module-wise count rates for Quadrant A Data is divided into 100 sec bins |
 |
 |
| Module-wise count rates for Quadrant B Data is divided into 100 sec bins |
 |
 |
| Module-wise count rates for Quadrant C Data is divided into 100 sec bins |
 |
 |
| Module-wise count rates for Quadrant D Data is divided into 100 sec bins |
 |
 |
| Parameter | Plot |
|---|---|
| CZT HV Monitor |  |
| D_VDD |  |
| Temperature 1 |  |
| Veto HV Monitor |  |
| Veto LLD |  |
| Alpha Counter | 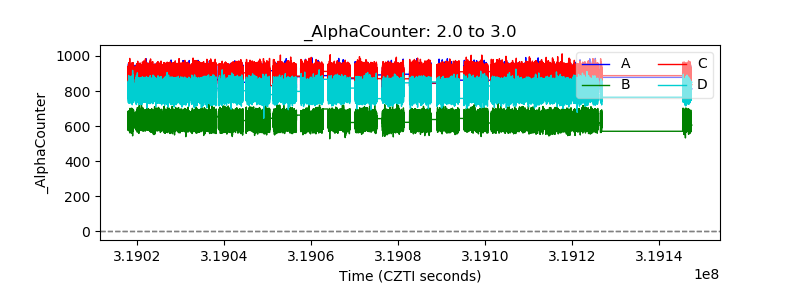 |
| _CPM_Rate |  |
| CZT Counter |  |
| +2.5 Volts monitor |  |
| +5 Volts monitor |  |
| _ROLL_ROT |  |
| _Roll_DEC |  |
| _Roll_RA | 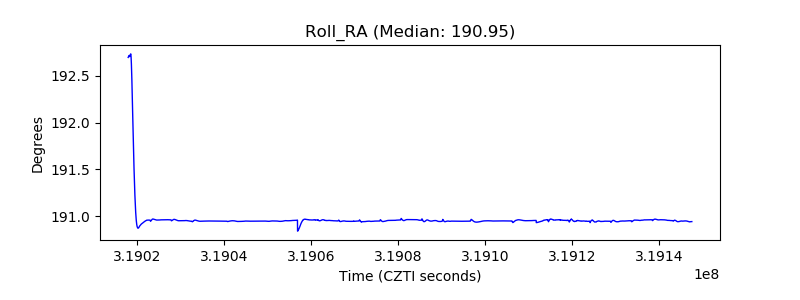 |
| Veto Counter |  |