| Param | Original file | Final file |
|---|---|---|
| Filename | modeM0/AS1A07_147T01_9000003490_23627cztM0_level2.evt | modeM0/AS1A07_147T01_9000003490_23627cztM0_level2_quad_clean.evt |
| Size (bytes) | 871,669,440 | 81,253,440 |
| Size | 831.3 MB | 77.5 MB |
| Events in quadrant A | 3,518,240 | 523,415 |
| Events in quadrant B | 4,541,655 | 530,499 |
| Events in quadrant C | 3,601,511 | 516,420 |
| Events in quadrant D | 14,240,440 | 377,739 |
| Mode M9 | |||
|---|---|---|---|
| Quadrant | BADHDUFLAG | Total packets | Discarded packets |
| A | 0 | 3 | 0 |
| B | 0 | 3 | 0 |
| C | 0 | 3 | 0 |
| D | 0 | 3 | 0 |
| Mode SS | |||
|---|---|---|---|
| Quadrant | BADHDUFLAG | Total packets | Discarded packets |
| A | 0 | 148 | 0 |
| B | 0 | 148 | 0 |
| C | 0 | 148 | 0 |
| D | 0 | 148 | 0 |
| Mode M0 | |||
|---|---|---|---|
| Quadrant | BADHDUFLAG | Total packets | Discarded packets |
| A | 0 | 15128 | 1 |
| B | 0 | 18021 | 1 |
| C | 0 | 15226 | 1 |
| D | 0 | 47298 | 1 |
| Quadrant | Total seconds | Saturated seconds | Saturation percentage |
|---|---|---|---|
| A | 7348 | 128 | 1.741971% |
| B | 7349 | 349 | 4.748945% |
| C | 7348 | 167 | 2.272727% |
| D | 7348 | 4523 | 61.554164% |
Noise dominated data is calculated using 1-second bins in cleaned event files. If a bin has >2000 counts, and if more than 50% of those come from <1% of pixels, then it is considered to be noise-dominated and hence unusable.
| Quadrant | # 1 sec bins | Bins with >0 counts | Bins with >2000 counts | High rate bins dominated by noise | Noise dominated (total time) | Noise dominated (detector-on time) | Marked lightcurve |
|---|---|---|---|---|---|---|---|
| A | 7608 | 7348 | 0 | 0 | 0.00% | 0.00% | 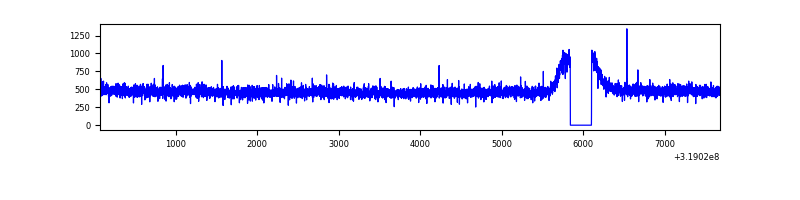 |
| B | 7609 | 7349 | 149 | 149 | 1.96% | 2.03% | 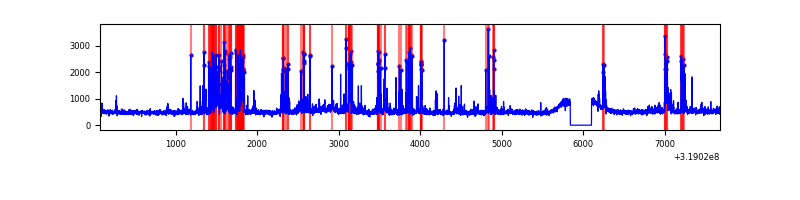 |
| C | 7608 | 7348 | 0 | 0 | 0.00% | 0.00% | 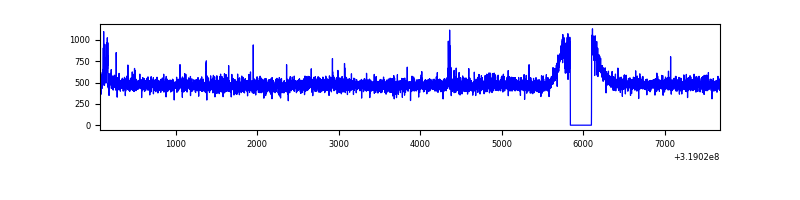 |
| D | 7608 | 7348 | 4362 | 4362 | 57.33% | 59.36% | 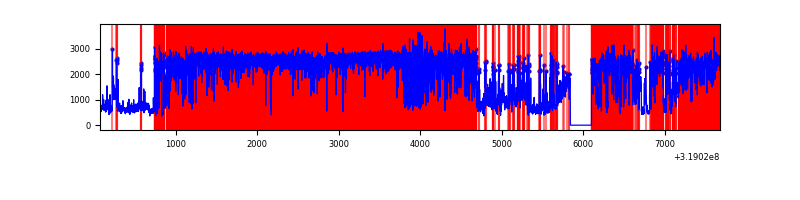 |
Top three noisy pixels from each quadrant. If the there are fewer than three noisy pixels in the level2.evt file, extra rows are filled as -1
| Pixel properties | Quadrant properties | ||||||
|---|---|---|---|---|---|---|---|
| Quadrant | DetID | PixID | Counts | Sigma | Mean | Median | Sigma |
| A | 13 | 254 | 10768 | 53.12 | 912 | 890 | 185.9 |
| A | 3 | 137 | 8271 | 39.69 | 912 | 890 | 185.9 |
| A | 0 | 226 | 7761 | 36.95 | 912 | 890 | 185.9 |
| B | 3 | 64 | 793619 | 4540.04 | 896 | 873 | 174.6 |
| B | 0 | 189 | 81658 | 462.65 | 896 | 873 | 174.6 |
| B | 0 | 230 | 51580 | 290.4 | 896 | 873 | 174.6 |
| C | 14 | 238 | 137757 | 662.42 | 876 | 880 | 206.6 |
| C | 8 | 208 | 24480 | 114.21 | 876 | 880 | 206.6 |
| C | 7 | 247 | 10941 | 48.69 | 876 | 880 | 206.6 |
| D | 1 | 52 | 11364576 | 69021.6 | 667 | 645 | 164.6 |
| D | 12 | 233 | 160961 | 973.72 | 667 | 645 | 164.6 |
| D | 9 | 85 | 93493 | 563.93 | 667 | 645 | 164.6 |
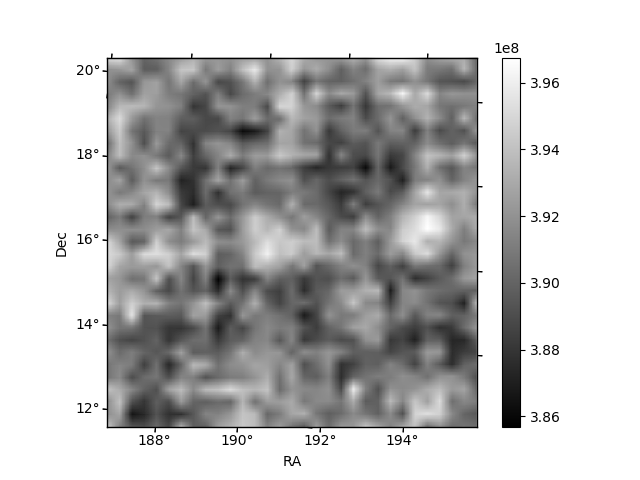
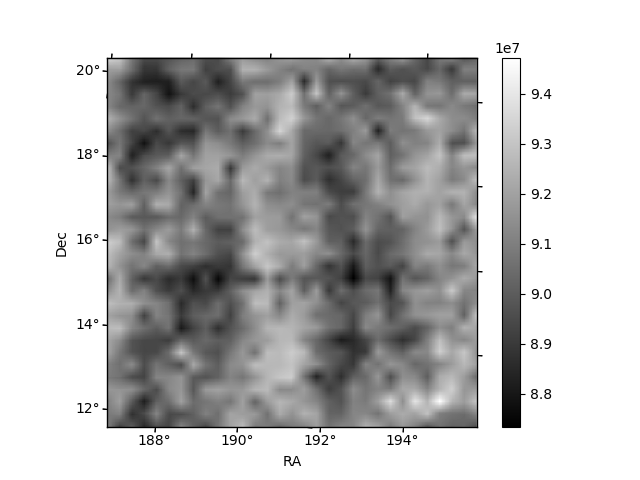
Histogram calculated using DETX and DETY for each event in the final _common_clean file
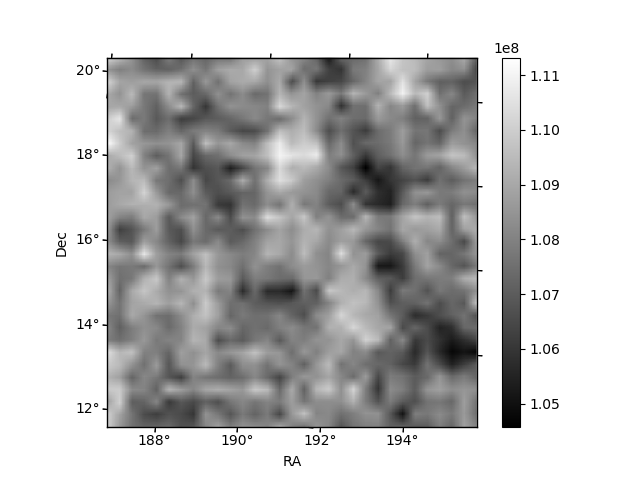
| Quadrant A | 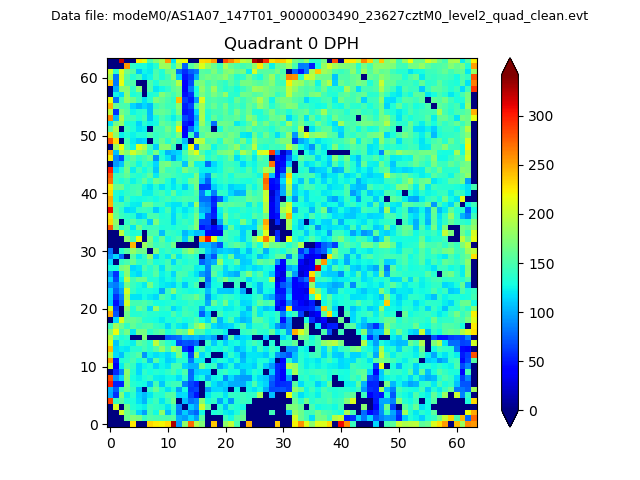 |
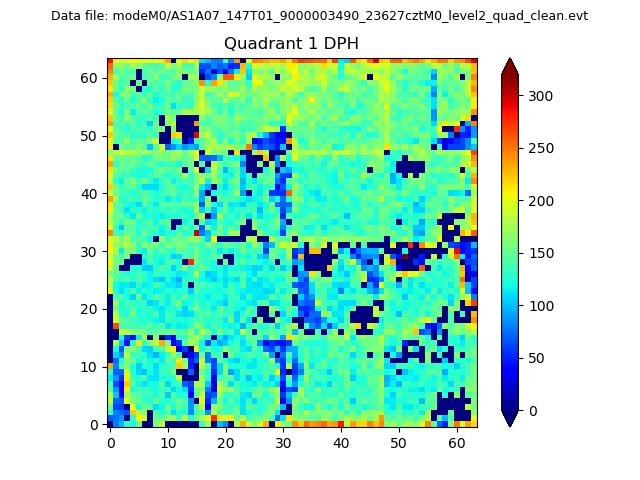 |
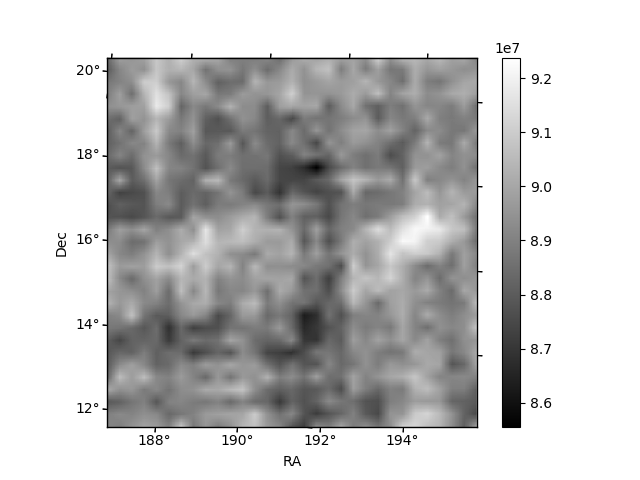
Quadrant B |
|---|---|---|---|
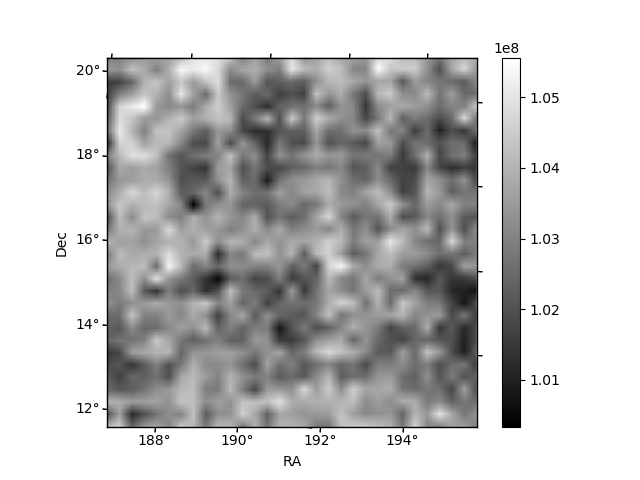
| Quadrant D | 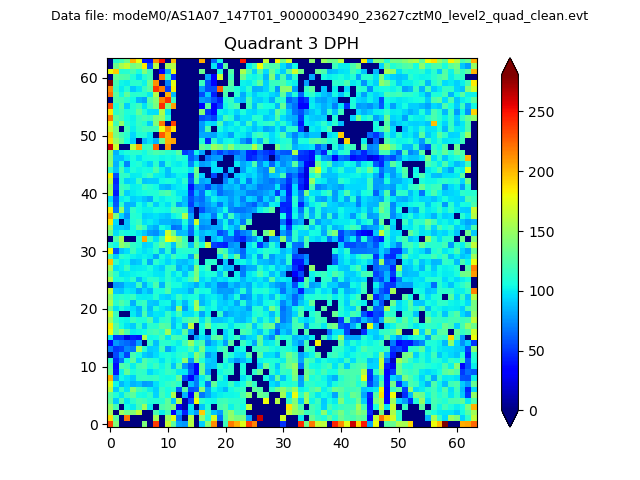 |
 |
Quadrant C |
| Plot type | Count rate plots | Images |
|---|---|---|
| Comparison with Poisson distribution Blue bars denote a histogram of data divided into 1 sec bins. Red curve is a Poisson curve with rate = median count rate of data. |
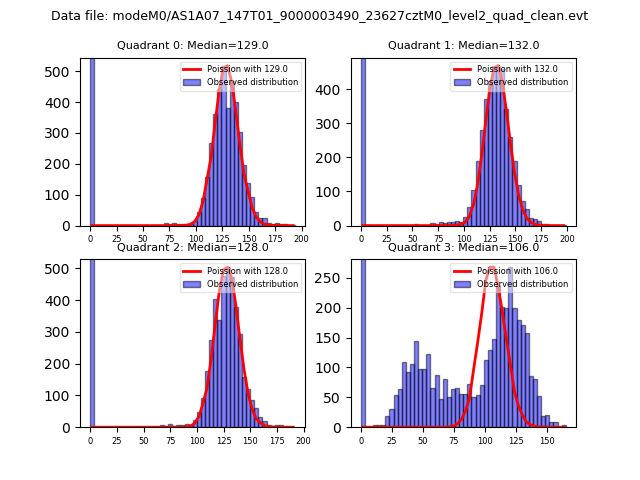 |
 |
| Quadrant-wise count rates Data is divided into 100 sec bins |
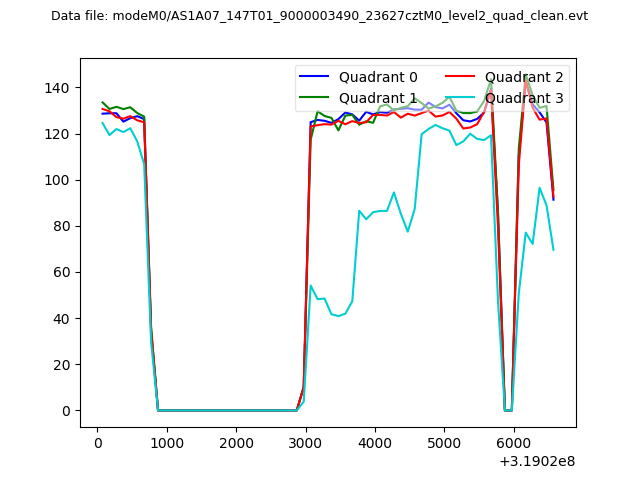 |
|
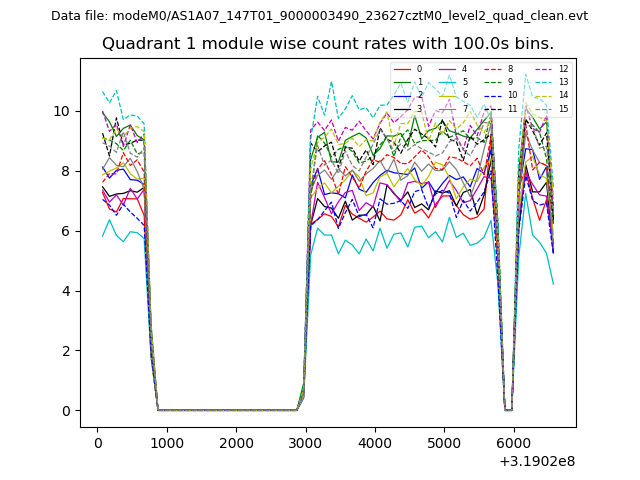
| Module-wise count rates for Quadrant A Data is divided into 100 sec bins |
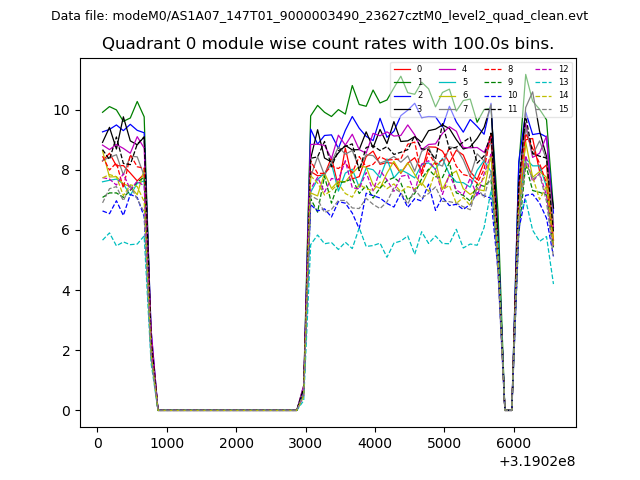 |
 |
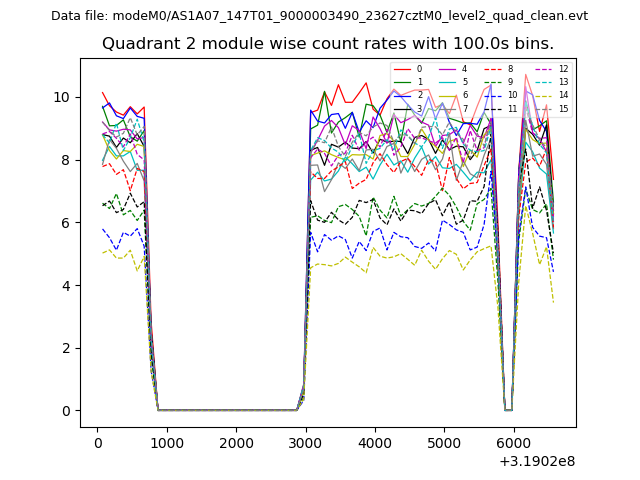
| Module-wise count rates for Quadrant B Data is divided into 100 sec bins |
 |
 |
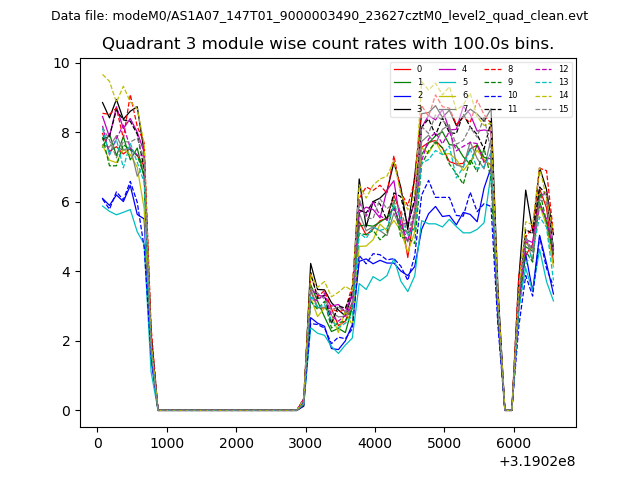
| Module-wise count rates for Quadrant C Data is divided into 100 sec bins |
 |
 |
| Module-wise count rates for Quadrant D Data is divided into 100 sec bins |
 |
 |
| Parameter | Plot |
|---|---|
| CZT HV Monitor | 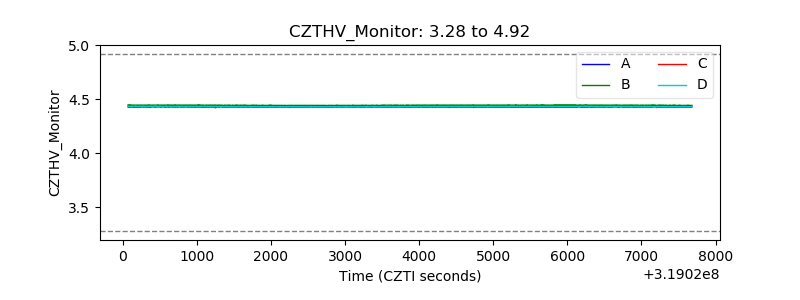 |
| D_VDD | 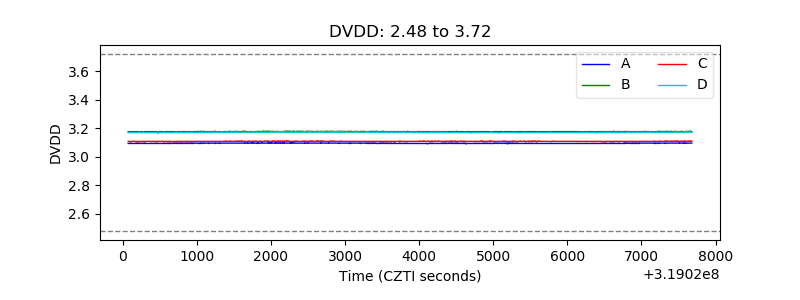 |
| Temperature 1 | 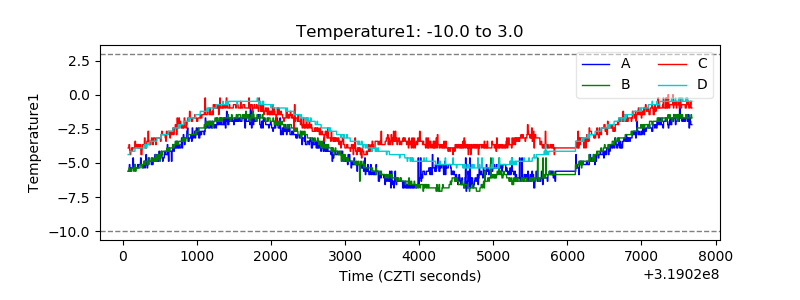 |
| Veto HV Monitor | 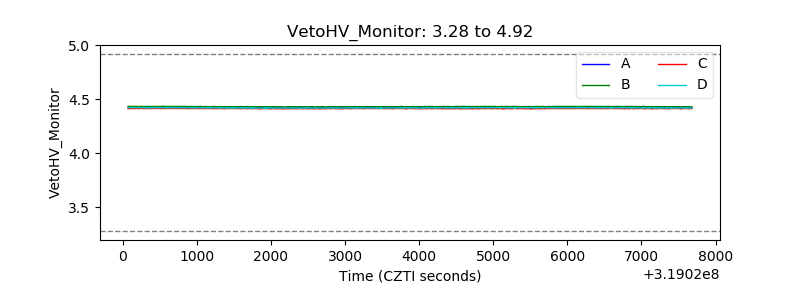 |
| Veto LLD | 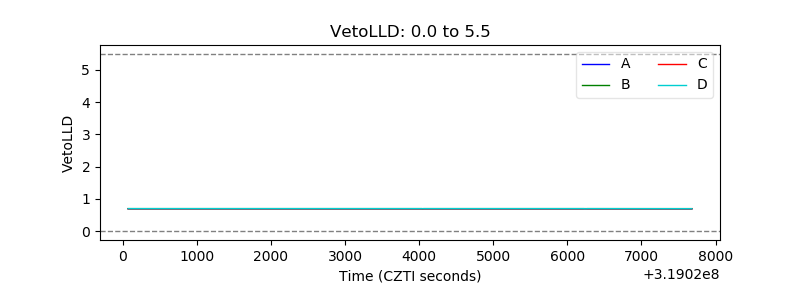 |
| Alpha Counter |  |
| _CPM_Rate | 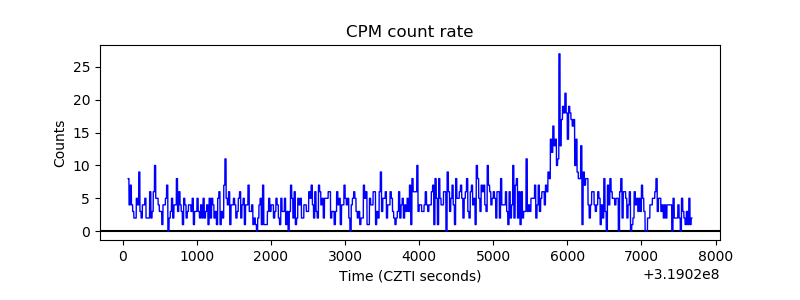 |
| CZT Counter |  |
| +2.5 Volts monitor |  |
| +5 Volts monitor |  |
| _ROLL_ROT | 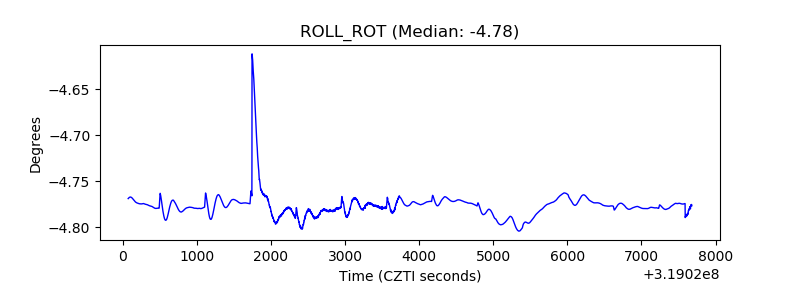 |
| _Roll_DEC | 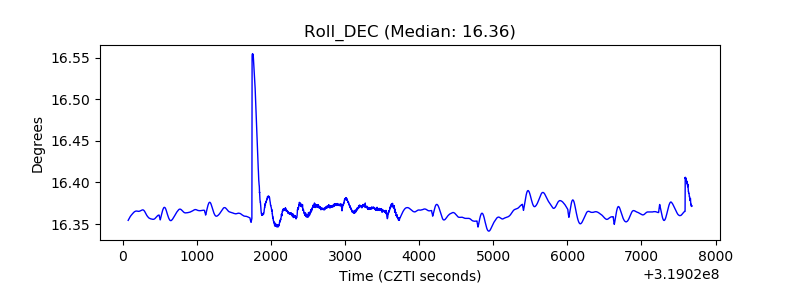 |
| _Roll_RA | 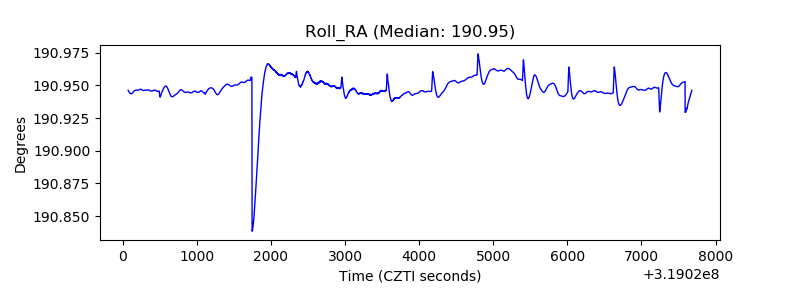 |
| Veto Counter | 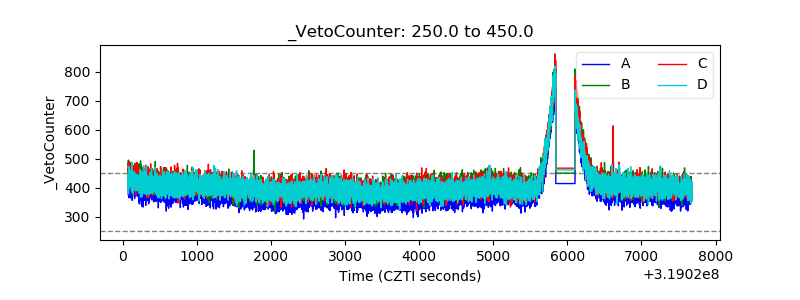 |