| Param | Original file | Final file |
|---|---|---|
| Filename | modeM0/AS1A07_147T01_9000003490_23628cztM0_level2.evt | modeM0/AS1A07_147T01_9000003490_23628cztM0_level2_quad_clean.evt |
| Size (bytes) | 744,321,600 | 72,673,920 |
| Size | 709.8 MB | 69.3 MB |
| Events in quadrant A | 3,453,571 | 439,004 |
| Events in quadrant B | 4,253,874 | 442,373 |
| Events in quadrant C | 3,535,185 | 431,269 |
| Events in quadrant D | 10,807,024 | 381,026 |
| Mode M9 | |||
|---|---|---|---|
| Quadrant | BADHDUFLAG | Total packets | Discarded packets |
| A | 0 | 3 | 0 |
| B | 0 | 3 | 0 |
| C | 0 | 3 | 0 |
| D | 0 | 3 | 0 |
| Mode SS | |||
|---|---|---|---|
| Quadrant | BADHDUFLAG | Total packets | Discarded packets |
| A | 0 | 148 | 0 |
| B | 0 | 148 | 0 |
| C | 0 | 148 | 0 |
| D | 0 | 148 | 0 |
| Mode M0 | |||
|---|---|---|---|
| Quadrant | BADHDUFLAG | Total packets | Discarded packets |
| A | 0 | 14886 | 2 |
| B | 0 | 17064 | 1 |
| C | 0 | 14986 | 1 |
| D | 0 | 37077 | 1 |
| Quadrant | Total seconds | Saturated seconds | Saturation percentage |
|---|---|---|---|
| A | 7271 | 77 | 1.059002% |
| B | 7272 | 251 | 3.451595% |
| C | 7272 | 121 | 1.663916% |
| D | 7272 | 2597 | 35.712321% |
Noise dominated data is calculated using 1-second bins in cleaned event files. If a bin has >2000 counts, and if more than 50% of those come from <1% of pixels, then it is considered to be noise-dominated and hence unusable.
| Quadrant | # 1 sec bins | Bins with >0 counts | Bins with >2000 counts | High rate bins dominated by noise | Noise dominated (total time) | Noise dominated (detector-on time) | Marked lightcurve |
|---|---|---|---|---|---|---|---|
| A | 7631 | 7271 | 1 | 1 | 0.01% | 0.01% | 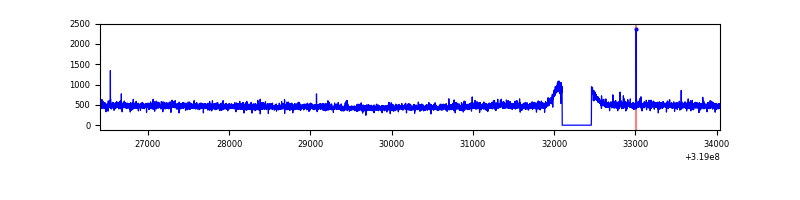 |
| B | 7632 | 7272 | 131 | 131 | 1.72% | 1.80% | 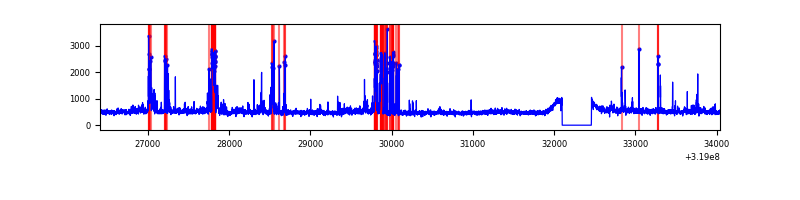 |
| C | 7632 | 7272 | 1 | 1 | 0.01% | 0.01% |  |
| D | 7631 | 7271 | 2543 | 2543 | 33.32% | 34.97% | 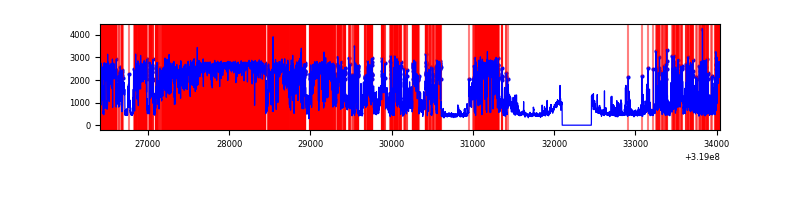 |
Top three noisy pixels from each quadrant. If the there are fewer than three noisy pixels in the level2.evt file, extra rows are filled as -1
| Pixel properties | Quadrant properties | ||||||
|---|---|---|---|---|---|---|---|
| Quadrant | DetID | PixID | Counts | Sigma | Mean | Median | Sigma |
| A | 13 | 254 | 11190 | 57.04 | 893 | 874 | 180.8 |
| A | 12 | 96 | 10774 | 54.74 | 893 | 874 | 180.8 |
| A | 3 | 137 | 8030 | 39.57 | 893 | 874 | 180.8 |
| B | 3 | 64 | 594590 | 3478.01 | 879 | 857 | 170.7 |
| B | 0 | 189 | 91771 | 532.56 | 879 | 857 | 170.7 |
| B | 0 | 230 | 83691 | 485.23 | 879 | 857 | 170.7 |
| C | 14 | 238 | 134243 | 658.08 | 856 | 860 | 202.7 |
| C | 0 | 10 | 32597 | 156.58 | 856 | 860 | 202.7 |
| C | 7 | 247 | 20490 | 96.85 | 856 | 860 | 202.7 |
| D | 1 | 52 | 6354549 | 34973.82 | 739 | 718 | 181.7 |
| D | 12 | 233 | 1393597 | 7666.92 | 739 | 718 | 181.7 |
| D | 9 | 85 | 155322 | 851.0 | 739 | 718 | 181.7 |
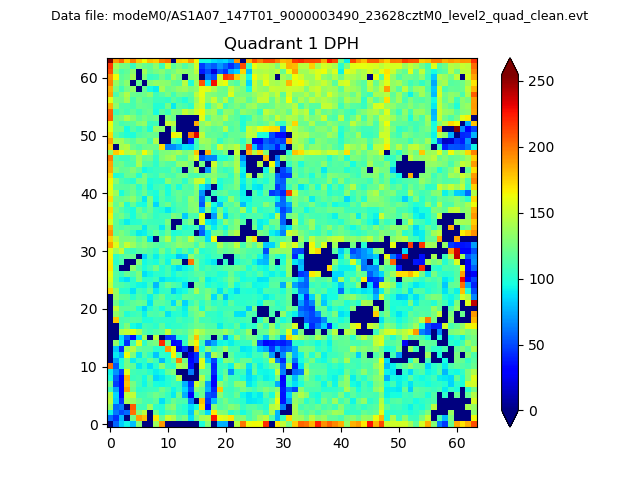
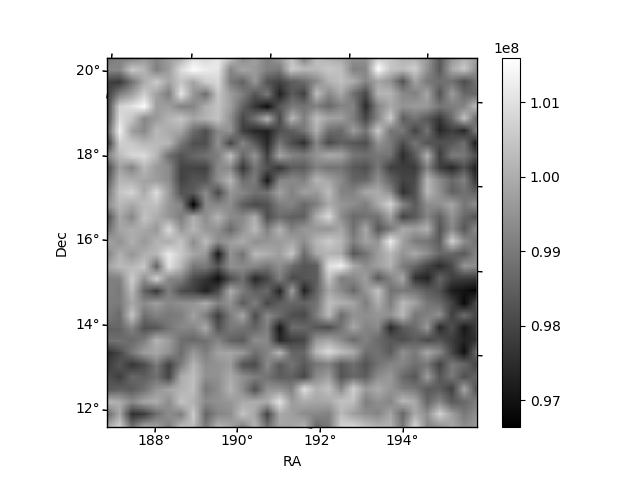
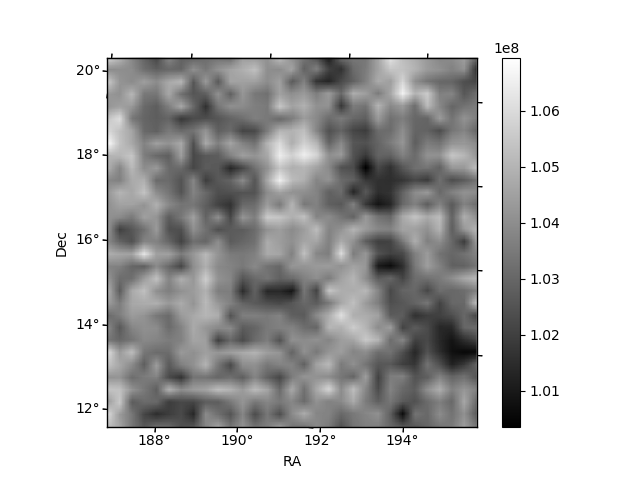
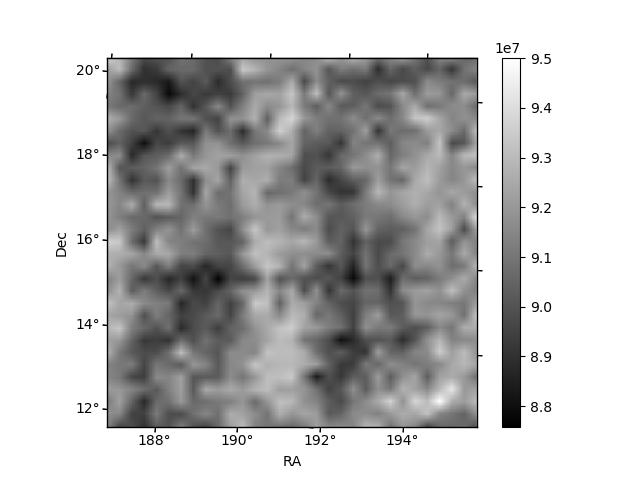
Histogram calculated using DETX and DETY for each event in the final _common_clean file
| Quadrant A | 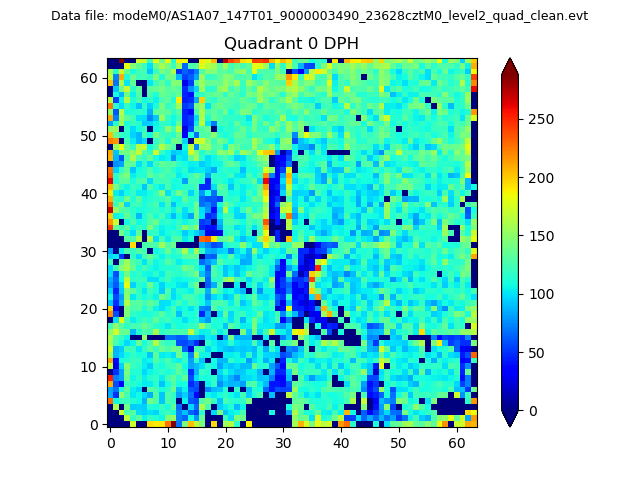 |
 |
Quadrant B |
|---|---|---|---|
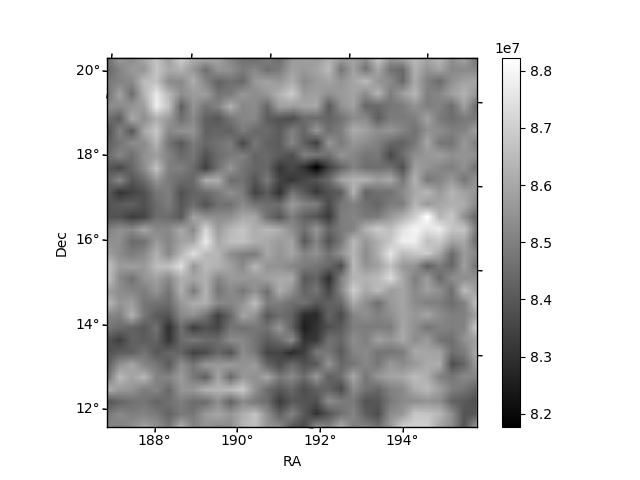
| Quadrant D | 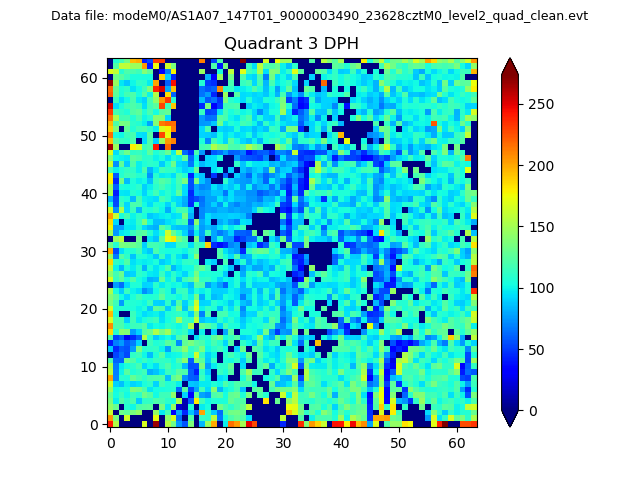 |
 |
Quadrant C |
| Plot type | Count rate plots | Images |
|---|---|---|
| Comparison with Poisson distribution Blue bars denote a histogram of data divided into 1 sec bins. Red curve is a Poisson curve with rate = median count rate of data. |
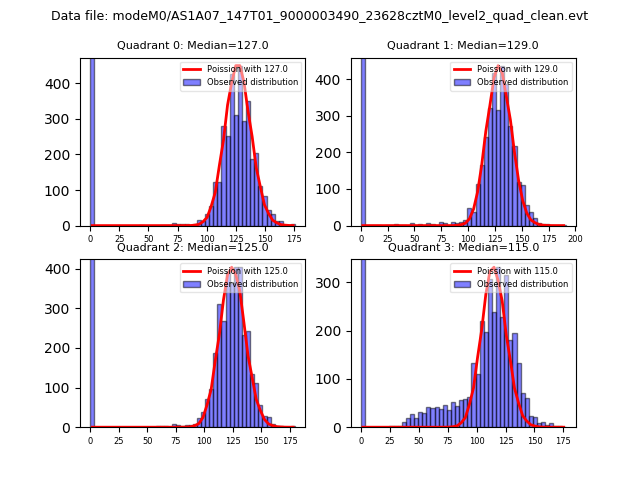 |
 |
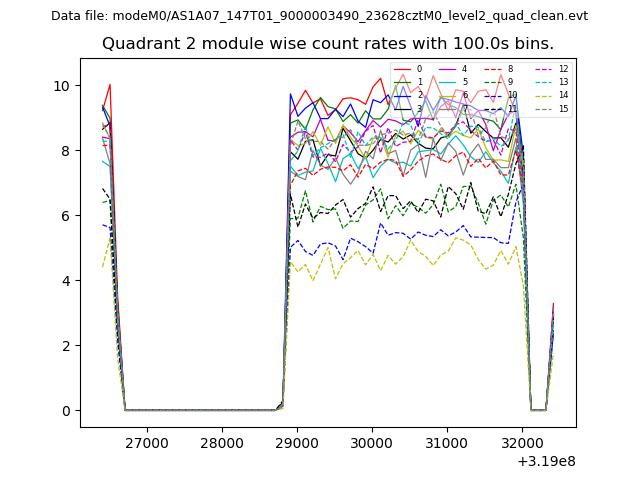
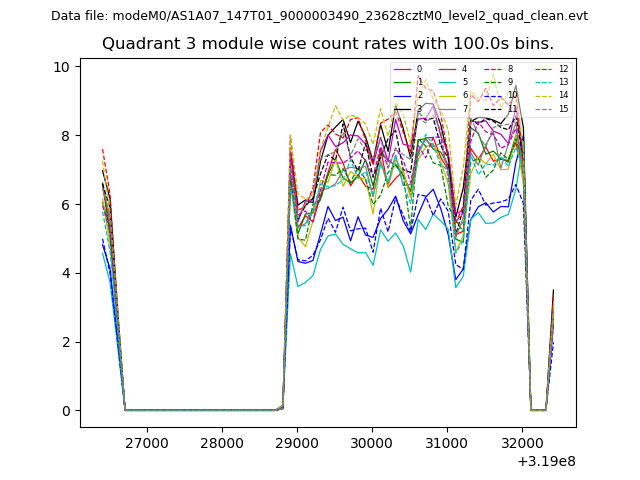
| Quadrant-wise count rates Data is divided into 100 sec bins |
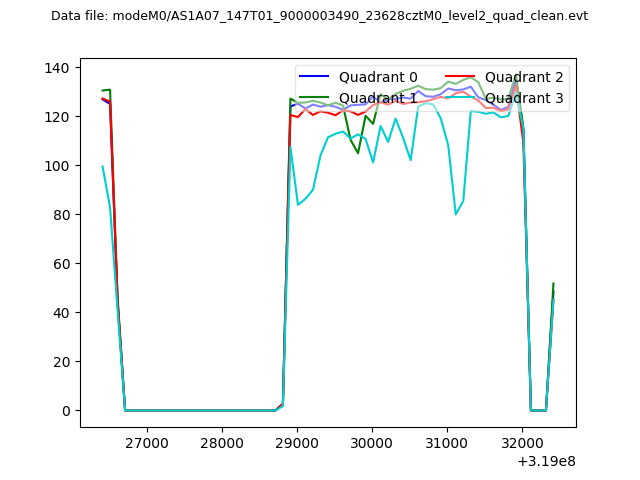 |
|
| Module-wise count rates for Quadrant A Data is divided into 100 sec bins |
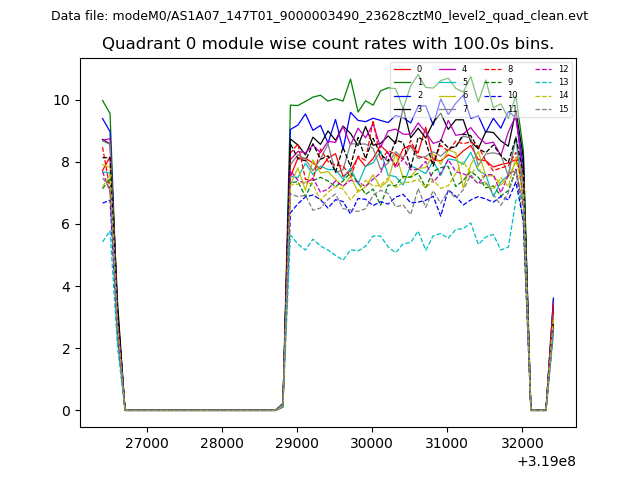 |
 |
| Module-wise count rates for Quadrant B Data is divided into 100 sec bins |
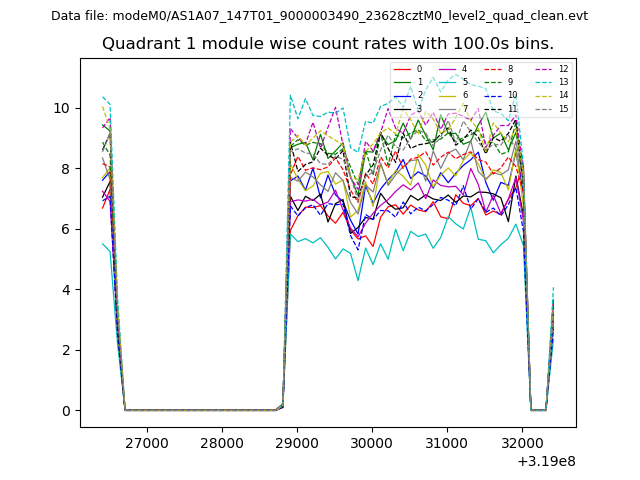 |
 |
| Module-wise count rates for Quadrant C Data is divided into 100 sec bins |
 |
 |
| Module-wise count rates for Quadrant D Data is divided into 100 sec bins |
 |
 |
| Parameter | Plot |
|---|---|
| CZT HV Monitor | 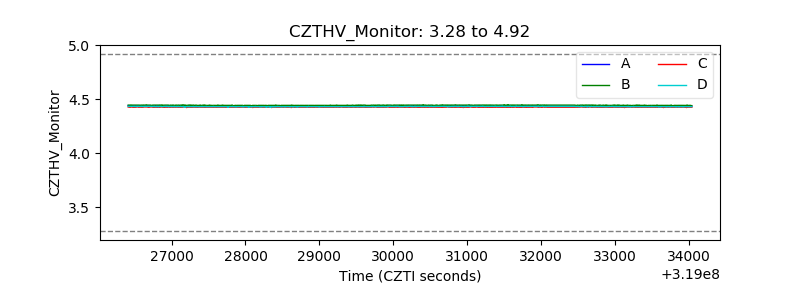 |
| D_VDD | 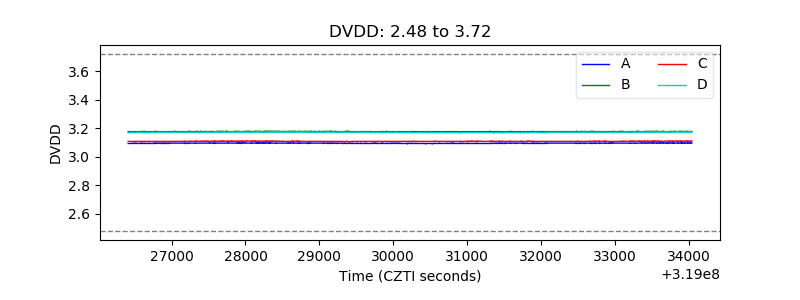 |
| Temperature 1 | 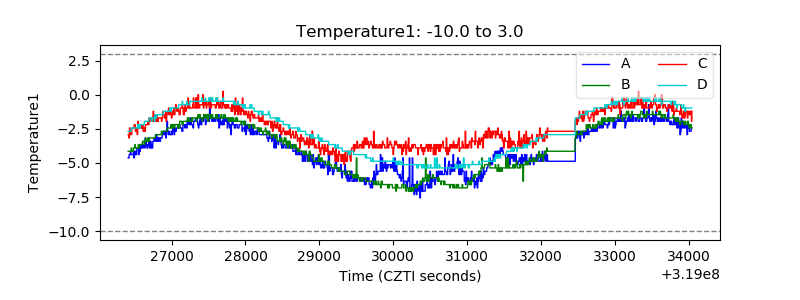 |
| Veto HV Monitor | 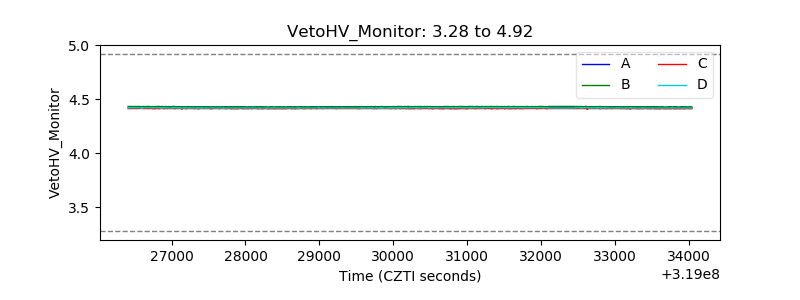 |
| Veto LLD | 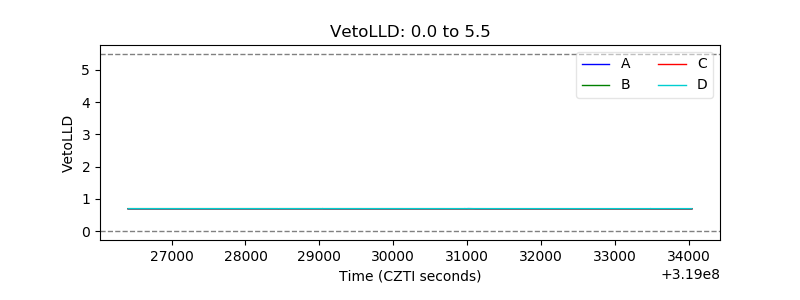 |
| Alpha Counter | 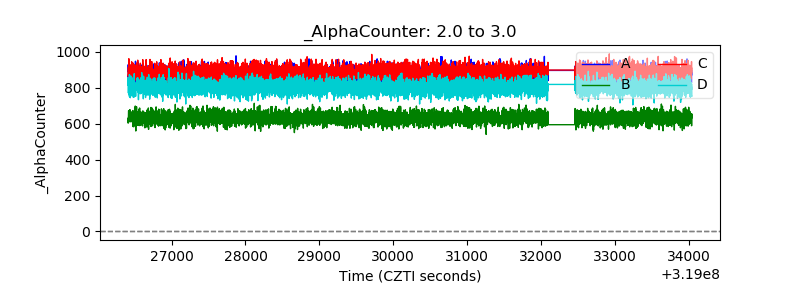 |
| _CPM_Rate | 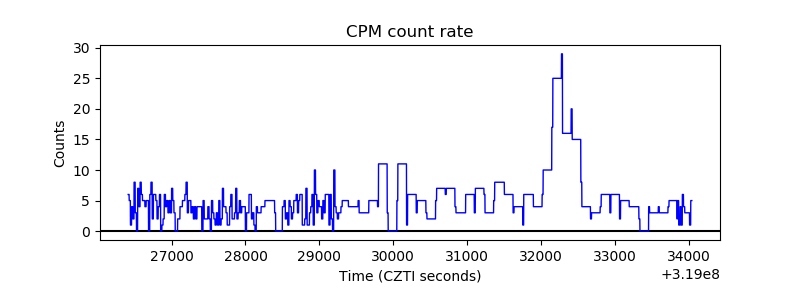 |
| CZT Counter | 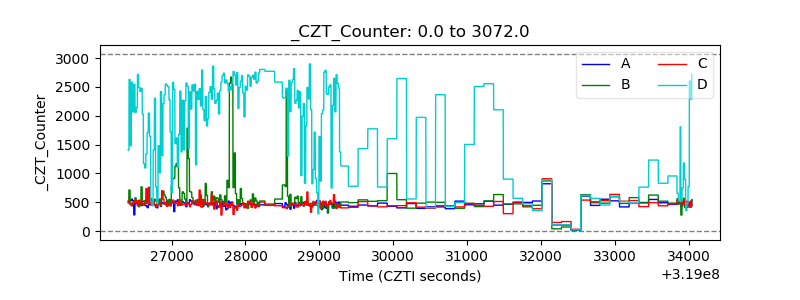 |
| +2.5 Volts monitor |  |
| +5 Volts monitor | 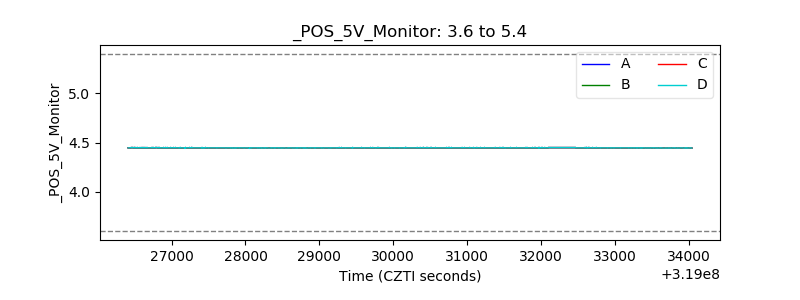 |
| _ROLL_ROT | 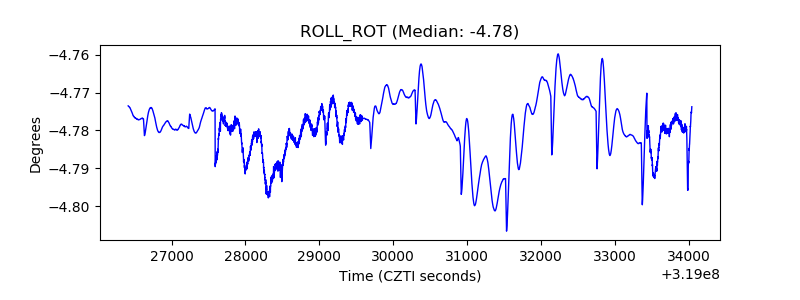 |
| _Roll_DEC | 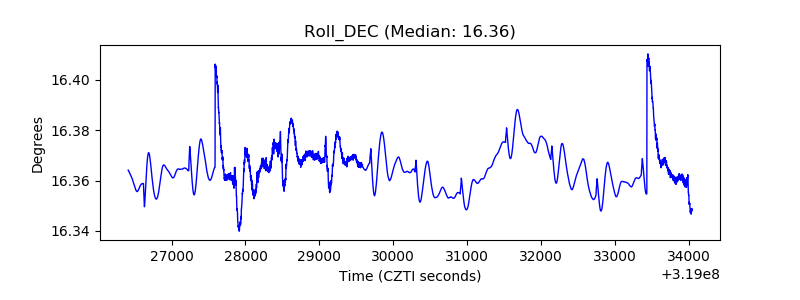 |
| _Roll_RA | 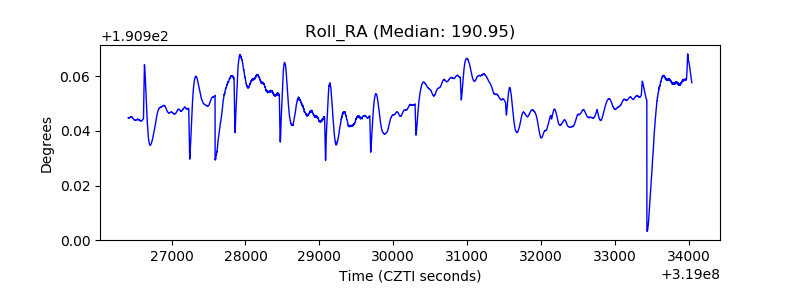 |
| Veto Counter | 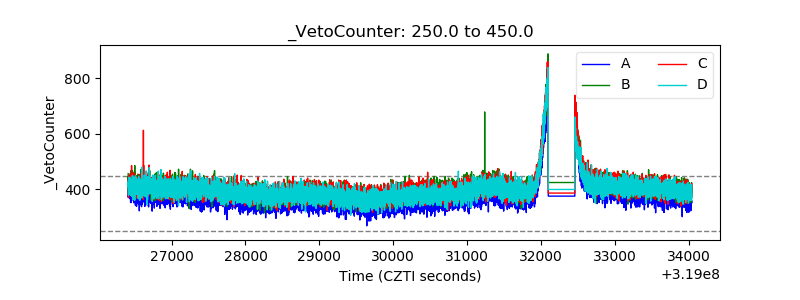 |