| Param | Original file | Final file |
|---|---|---|
| Filename | modeM0/AS1A07_147T01_9000003490_23632cztM0_level2.evt | modeM0/AS1A07_147T01_9000003490_23632cztM0_level2_quad_clean.evt |
| Size (bytes) | 520,174,080 | 90,567,360 |
| Size | 496.1 MB | 86.4 MB |
| Events in quadrant A | 3,260,668 | 571,835 |
| Events in quadrant B | 4,110,771 | 582,201 |
| Events in quadrant C | 3,404,156 | 565,439 |
| Events in quadrant D | 4,515,863 | 548,569 |
| Mode M9 | |||
|---|---|---|---|
| Quadrant | BADHDUFLAG | Total packets | Discarded packets |
| A | 0 | 18 | 0 |
| B | 0 | 18 | 0 |
| C | 0 | 18 | 0 |
| D | 0 | 18 | 0 |
| Mode SS | |||
|---|---|---|---|
| Quadrant | BADHDUFLAG | Total packets | Discarded packets |
| A | 0 | 140 | 0 |
| B | 0 | 140 | 0 |
| C | 0 | 140 | 0 |
| D | 0 | 140 | 0 |
| Mode M0 | |||
|---|---|---|---|
| Quadrant | BADHDUFLAG | Total packets | Discarded packets |
| A | 0 | 14146 | 2 |
| B | 0 | 16845 | 2 |
| C | 0 | 14376 | 2 |
| D | 0 | 18111 | 2 |
| Quadrant | Total seconds | Saturated seconds | Saturation percentage |
|---|---|---|---|
| A | 6811 | 45 | 0.660696% |
| B | 6811 | 204 | 2.995155% |
| C | 6811 | 96 | 1.409485% |
| D | 6811 | 283 | 4.155043% |
Noise dominated data is calculated using 1-second bins in cleaned event files. If a bin has >2000 counts, and if more than 50% of those come from <1% of pixels, then it is considered to be noise-dominated and hence unusable.
| Quadrant | # 1 sec bins | Bins with >0 counts | Bins with >2000 counts | High rate bins dominated by noise | Noise dominated (total time) | Noise dominated (detector-on time) | Marked lightcurve |
|---|---|---|---|---|---|---|---|
| A | 8621 | 6811 | 0 | 0 | 0.00% | 0.00% | 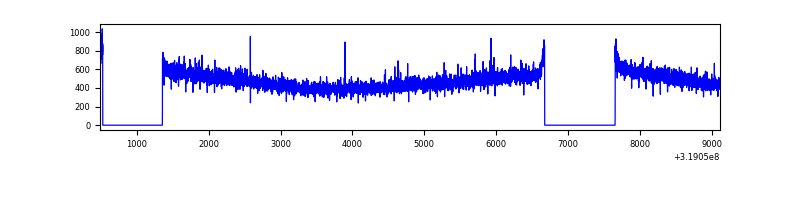 |
| B | 8621 | 6811 | 81 | 81 | 0.94% | 1.19% | 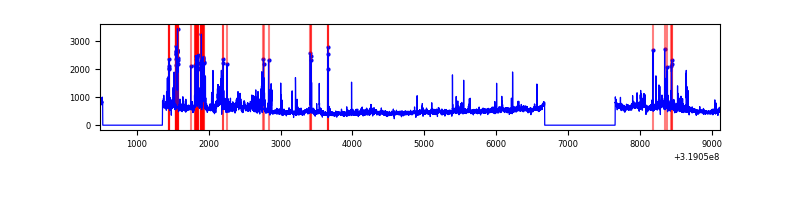 |
| C | 8621 | 6811 | 1 | 1 | 0.01% | 0.01% | 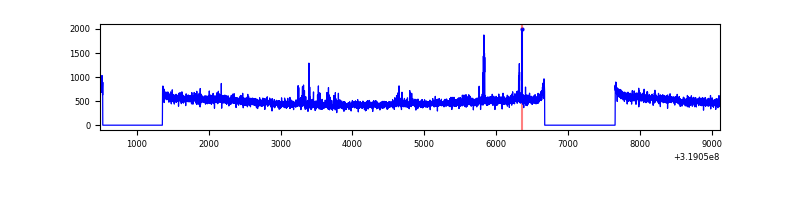 |
| D | 8621 | 6811 | 198 | 198 | 2.30% | 2.91% | 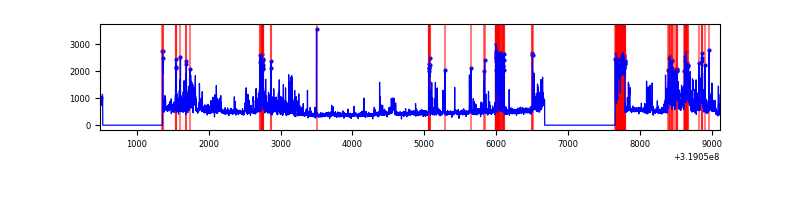 |
Top three noisy pixels from each quadrant. If the there are fewer than three noisy pixels in the level2.evt file, extra rows are filled as -1
| Pixel properties | Quadrant properties | ||||||
|---|---|---|---|---|---|---|---|
| Quadrant | DetID | PixID | Counts | Sigma | Mean | Median | Sigma |
| A | 13 | 254 | 11180 | 60.03 | 843 | 825 | 172.5 |
| A | 12 | 96 | 9428 | 49.87 | 843 | 825 | 172.5 |
| A | 3 | 137 | 7665 | 39.65 | 843 | 825 | 172.5 |
| B | 3 | 64 | 504844 | 3145.26 | 837 | 816 | 160.3 |
| B | 0 | 230 | 153848 | 954.96 | 837 | 816 | 160.3 |
| B | 0 | 229 | 71569 | 441.52 | 837 | 816 | 160.3 |
| C | 14 | 238 | 129603 | 670.42 | 818 | 825 | 192.1 |
| C | 7 | 247 | 52875 | 270.97 | 818 | 825 | 192.1 |
| C | 14 | 225 | 19656 | 98.03 | 818 | 825 | 192.1 |
| D | 9 | 85 | 542807 | 2728.33 | 812 | 786 | 198.7 |
| D | 12 | 233 | 376099 | 1889.18 | 812 | 786 | 198.7 |
| D | 1 | 52 | 180205 | 903.13 | 812 | 786 | 198.7 |
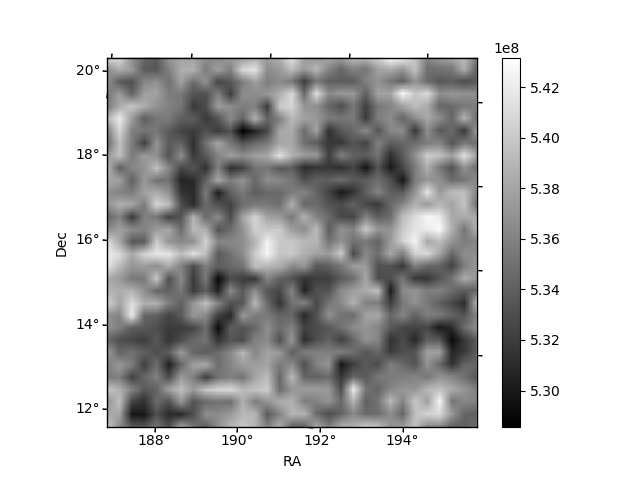
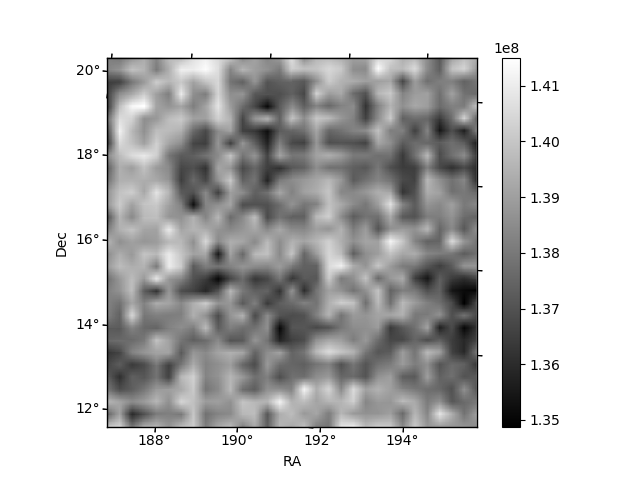
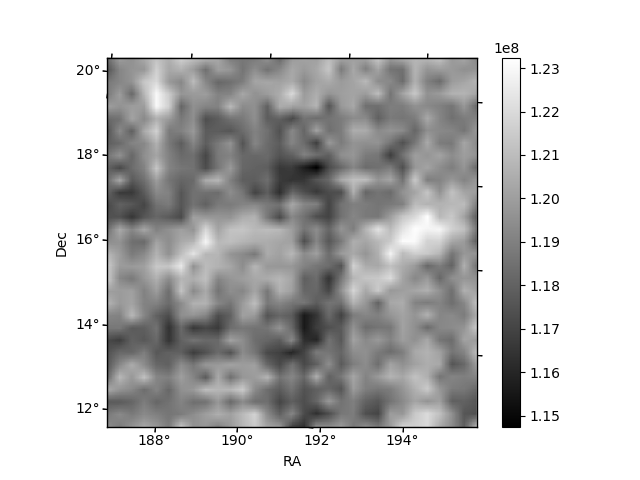
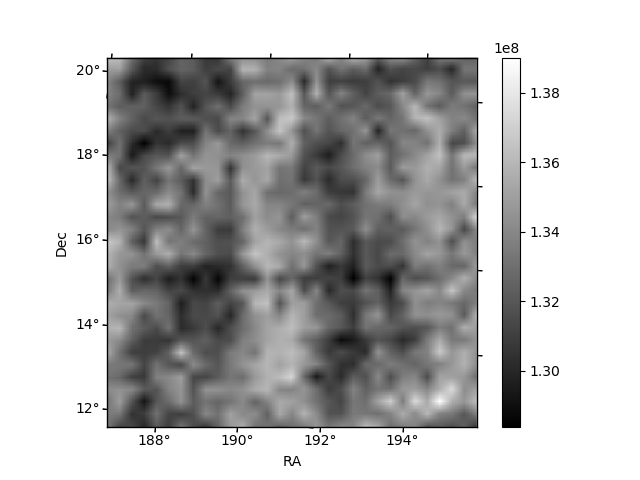
Histogram calculated using DETX and DETY for each event in the final _common_clean file
| Quadrant A | 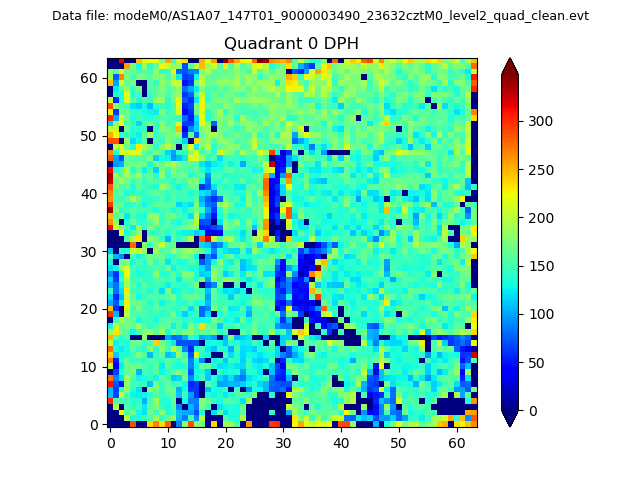 |
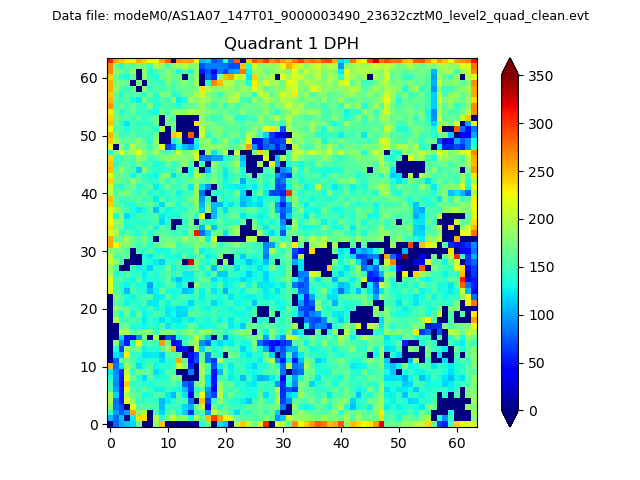 |
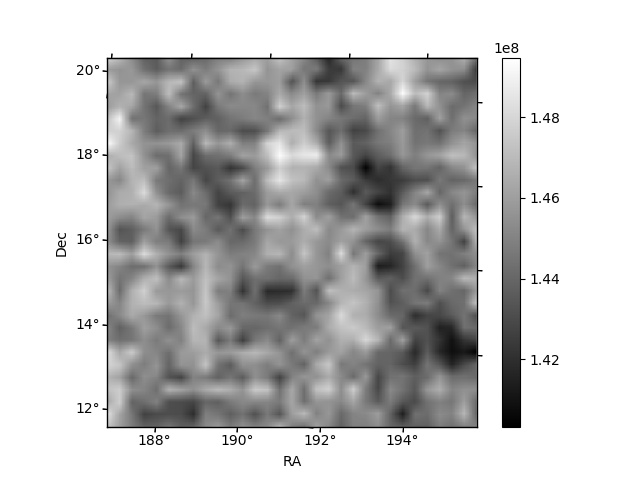
Quadrant B |
|---|---|---|---|
| Quadrant D | 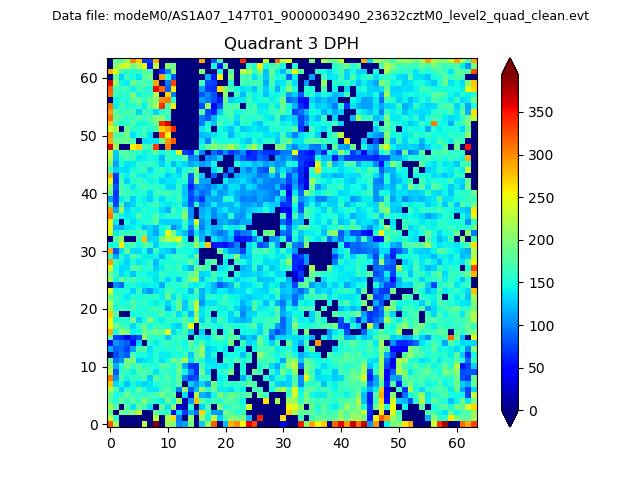 |
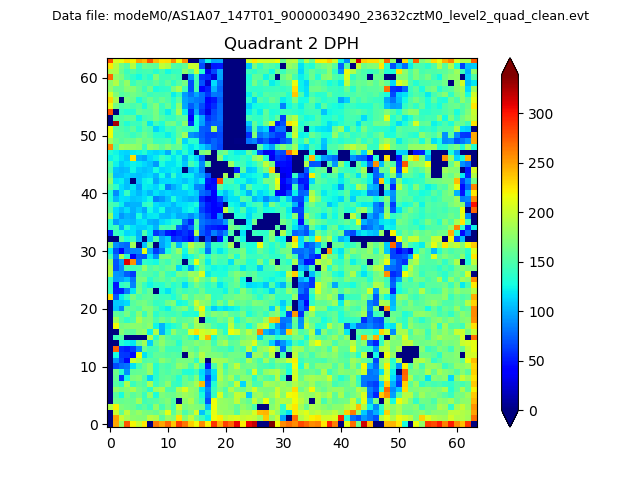 |
Quadrant C |
| Plot type | Count rate plots | Images |
|---|---|---|
| Comparison with Poisson distribution Blue bars denote a histogram of data divided into 1 sec bins. Red curve is a Poisson curve with rate = median count rate of data. |
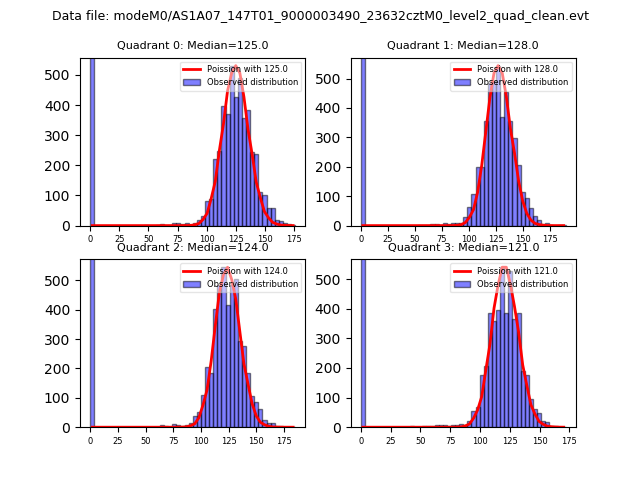 |
 |
| Quadrant-wise count rates Data is divided into 100 sec bins |
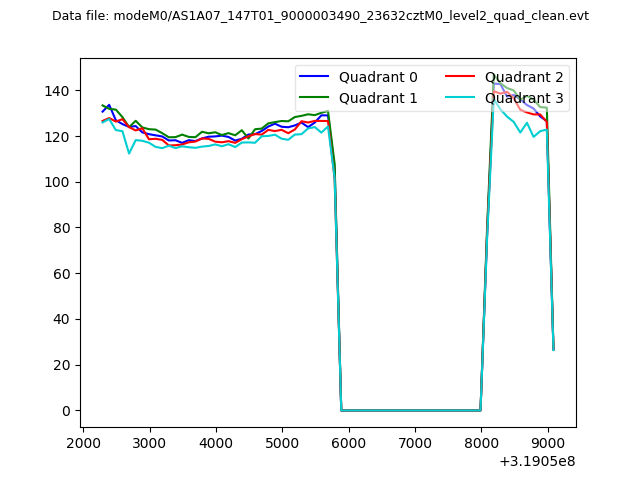 |
|
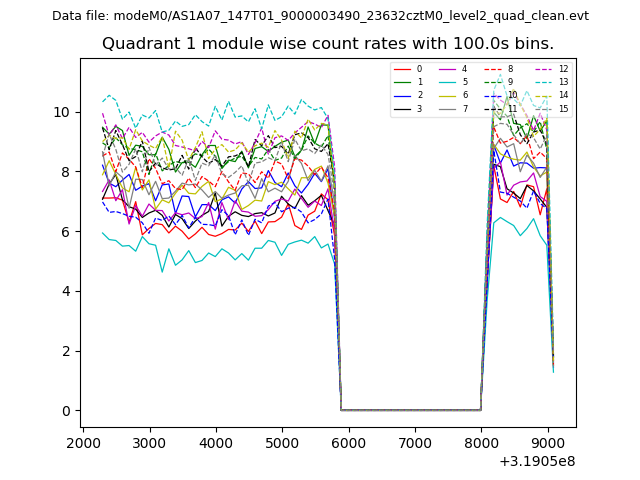
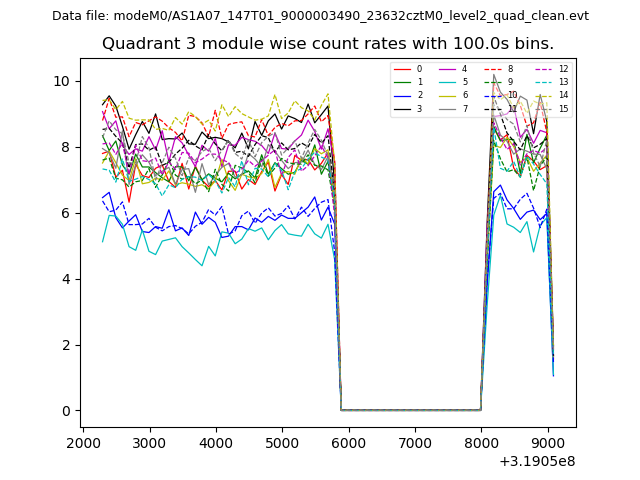
| Module-wise count rates for Quadrant A Data is divided into 100 sec bins |
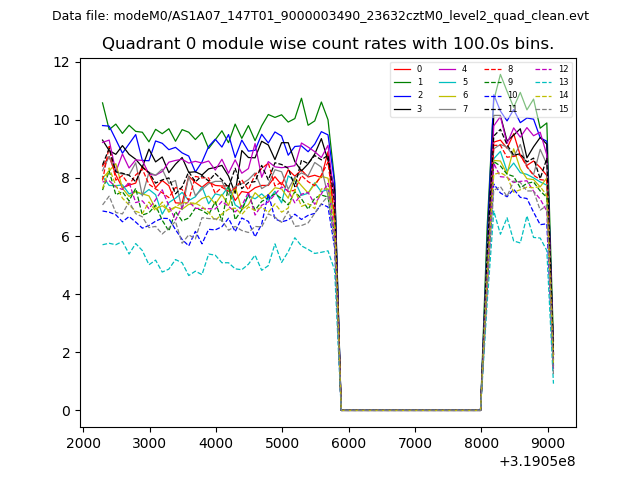 |
 |
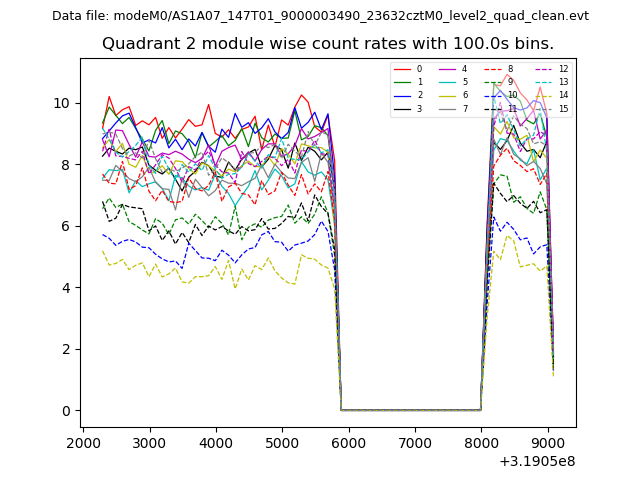
| Module-wise count rates for Quadrant B Data is divided into 100 sec bins |
 |
 |
| Module-wise count rates for Quadrant C Data is divided into 100 sec bins |
 |
 |
| Module-wise count rates for Quadrant D Data is divided into 100 sec bins |
 |
 |
| Parameter | Plot |
|---|---|
| CZT HV Monitor | 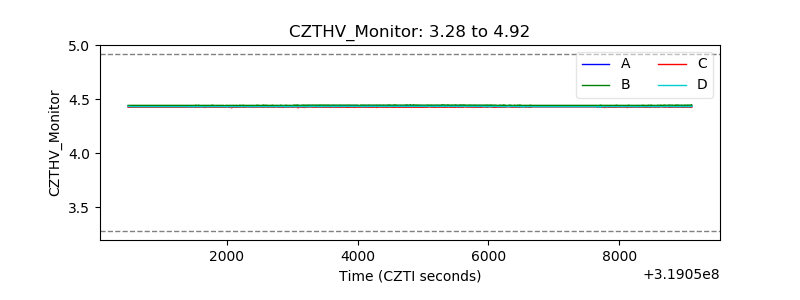 |
| D_VDD | 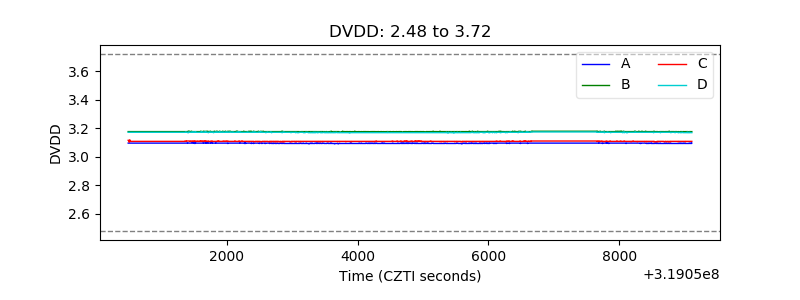 |
| Temperature 1 | 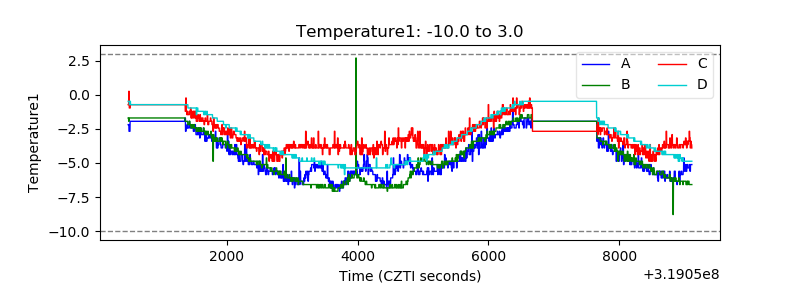 |
| Veto HV Monitor | 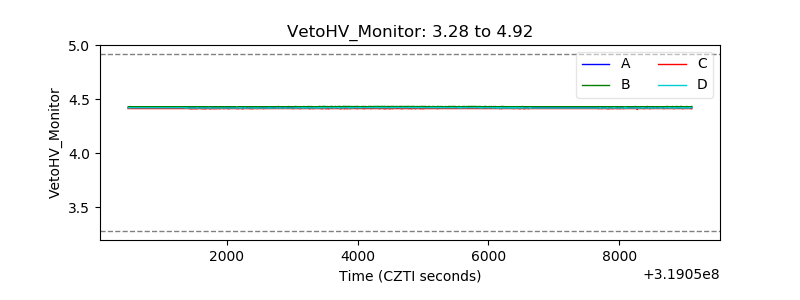 |
| Veto LLD | 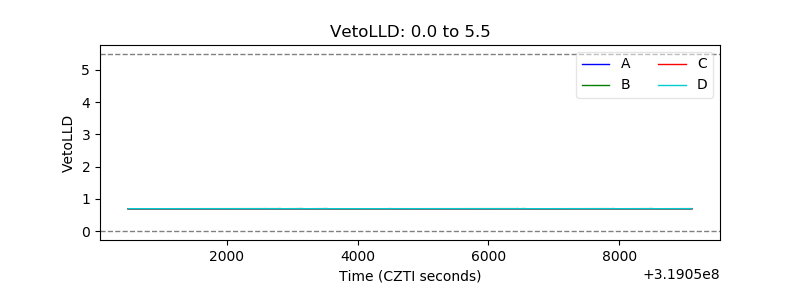 |
| Alpha Counter | 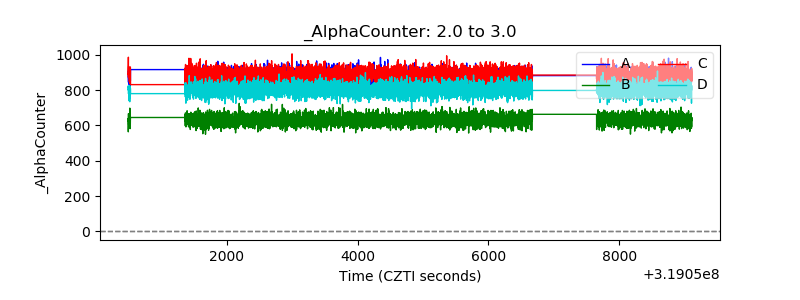 |
| _CPM_Rate | 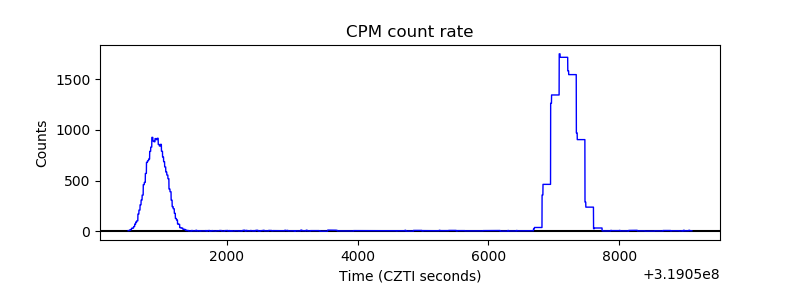 |
| CZT Counter | 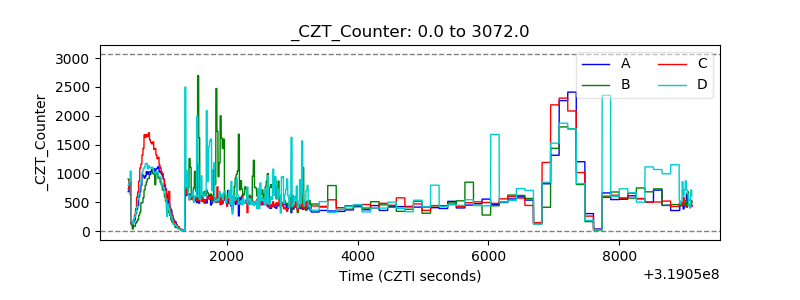 |
| +2.5 Volts monitor | 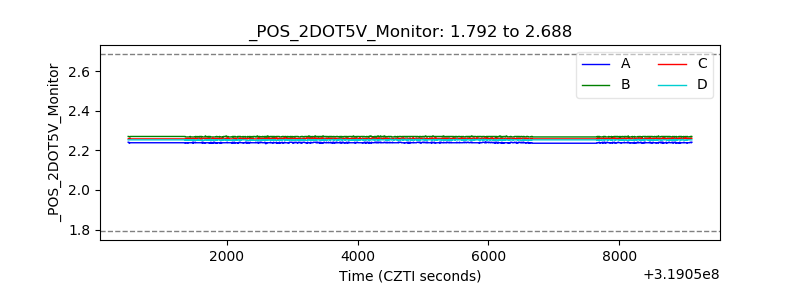 |
| +5 Volts monitor | 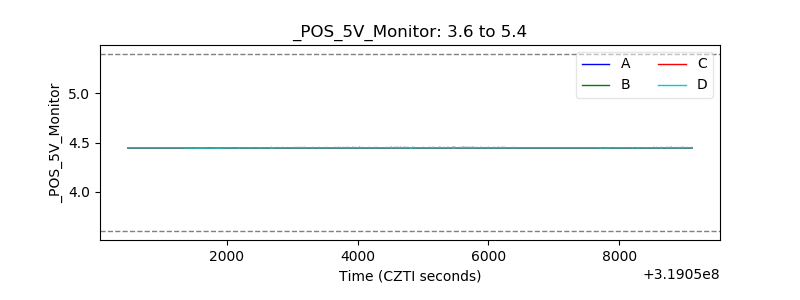 |
| _ROLL_ROT | 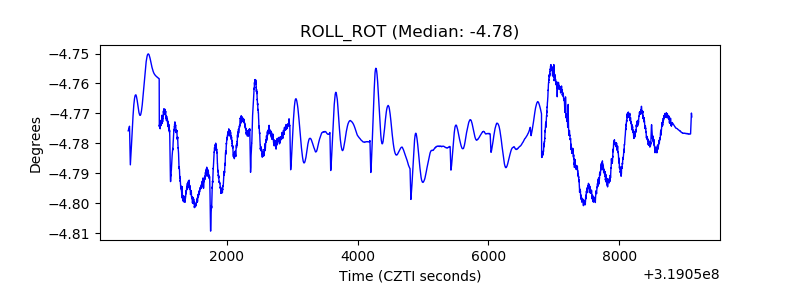 |
| _Roll_DEC | 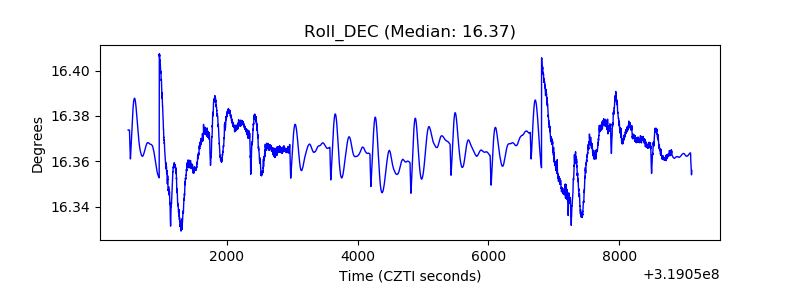 |
| _Roll_RA | 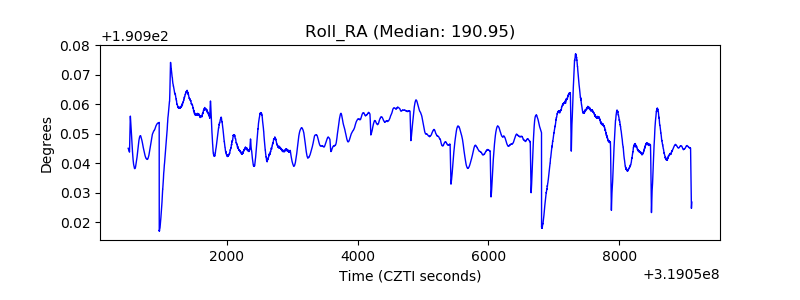 |
| Veto Counter | 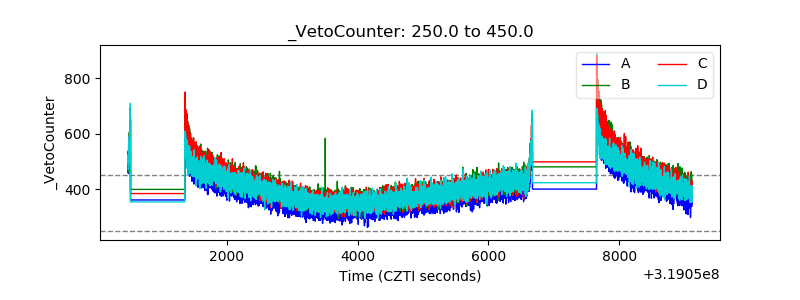 |