| Param | Original file | Final file |
|---|---|---|
| Filename | modeM0/AS1A07_147T01_9000003490_23634cztM0_level2.evt | modeM0/AS1A07_147T01_9000003490_23634cztM0_level2_quad_clean.evt |
| Size (bytes) | 480,458,880 | 100,454,400 |
| Size | 458.2 MB | 95.8 MB |
| Events in quadrant A | 3,161,395 | 653,594 |
| Events in quadrant B | 3,612,580 | 671,359 |
| Events in quadrant C | 3,300,707 | 643,294 |
| Events in quadrant D | 4,032,624 | 618,591 |
| Mode M9 | |||
|---|---|---|---|
| Quadrant | BADHDUFLAG | Total packets | Discarded packets |
| A | 0 | 11 | 0 |
| B | 0 | 11 | 0 |
| C | 0 | 11 | 0 |
| D | 0 | 11 | 0 |
| Mode SS | |||
|---|---|---|---|
| Quadrant | BADHDUFLAG | Total packets | Discarded packets |
| A | 0 | 134 | 0 |
| B | 0 | 134 | 0 |
| C | 0 | 134 | 0 |
| D | 0 | 134 | 0 |
| Mode M0 | |||
|---|---|---|---|
| Quadrant | BADHDUFLAG | Total packets | Discarded packets |
| A | 0 | 13669 | 2 |
| B | 0 | 15124 | 2 |
| C | 0 | 13978 | 2 |
| D | 0 | 16587 | 2 |
| Quadrant | Total seconds | Saturated seconds | Saturation percentage |
|---|---|---|---|
| A | 6524 | 22 | 0.337216% |
| B | 6525 | 64 | 0.980843% |
| C | 6525 | 62 | 0.950192% |
| D | 6525 | 202 | 3.095785% |
Noise dominated data is calculated using 1-second bins in cleaned event files. If a bin has >2000 counts, and if more than 50% of those come from <1% of pixels, then it is considered to be noise-dominated and hence unusable.
| Quadrant | # 1 sec bins | Bins with >0 counts | Bins with >2000 counts | High rate bins dominated by noise | Noise dominated (total time) | Noise dominated (detector-on time) | Marked lightcurve |
|---|---|---|---|---|---|---|---|
| A | 7634 | 6525 | 2 | 2 | 0.03% | 0.03% | 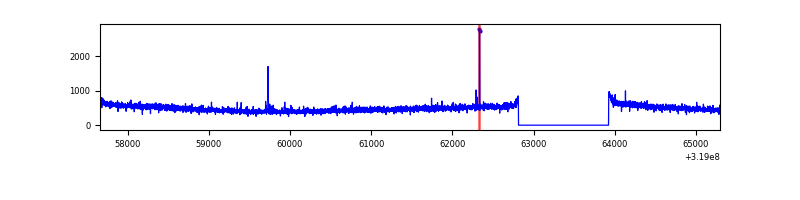 |
| B | 7635 | 6525 | 19 | 19 | 0.25% | 0.29% | 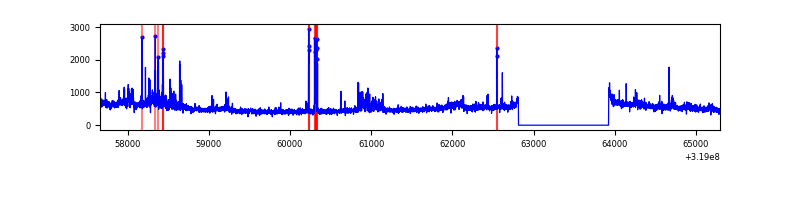 |
| C | 7635 | 6525 | 0 | 0 | 0.00% | 0.00% | 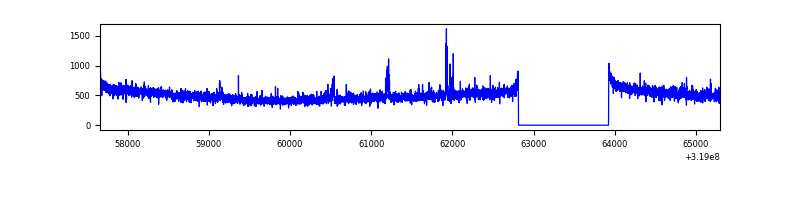 |
| D | 7635 | 6526 | 157 | 157 | 2.06% | 2.41% | 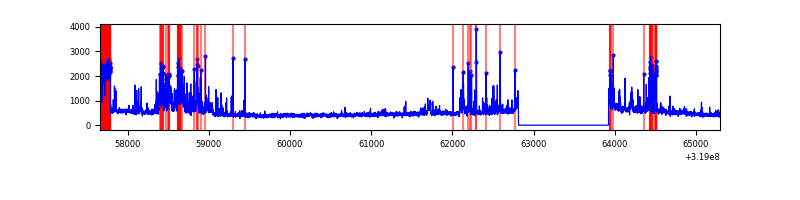 |
Top three noisy pixels from each quadrant. If the there are fewer than three noisy pixels in the level2.evt file, extra rows are filled as -1
| Pixel properties | Quadrant properties | ||||||
|---|---|---|---|---|---|---|---|
| Quadrant | DetID | PixID | Counts | Sigma | Mean | Median | Sigma |
| A | 12 | 96 | 20160 | 116.63 | 815 | 801 | 166.0 |
| A | 13 | 254 | 10253 | 56.95 | 815 | 801 | 166.0 |
| A | 3 | 137 | 7292 | 39.11 | 815 | 801 | 166.0 |
| B | 3 | 64 | 186069 | 1167.07 | 822 | 801 | 158.7 |
| B | 0 | 230 | 102994 | 643.75 | 822 | 801 | 158.7 |
| B | 0 | 229 | 37274 | 229.76 | 822 | 801 | 158.7 |
| C | 14 | 238 | 124646 | 666.13 | 792 | 797 | 185.9 |
| C | 7 | 247 | 64406 | 342.13 | 792 | 797 | 185.9 |
| C | 10 | 91 | 10638 | 52.93 | 792 | 797 | 185.9 |
| D | 9 | 85 | 432229 | 2249.52 | 784 | 761 | 191.8 |
| D | 12 | 233 | 279442 | 1452.94 | 784 | 761 | 191.8 |
| D | 9 | 35 | 155173 | 805.05 | 784 | 761 | 191.8 |
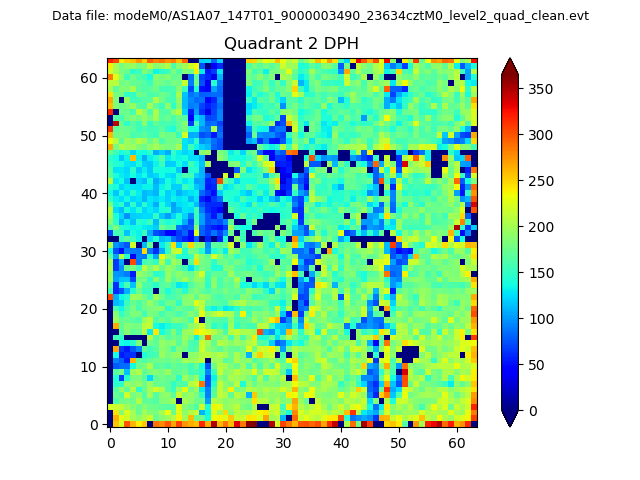
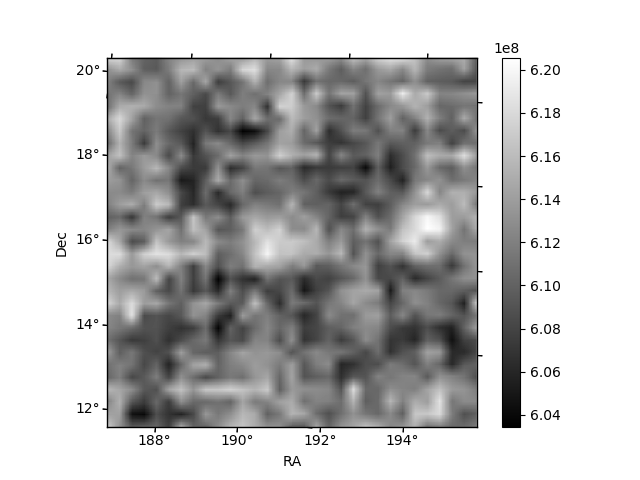
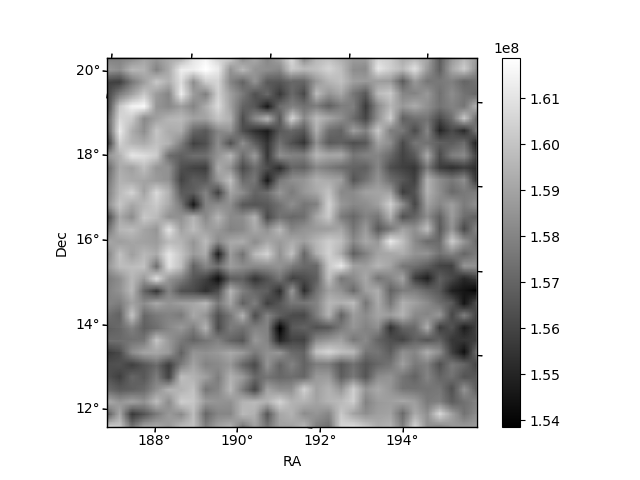
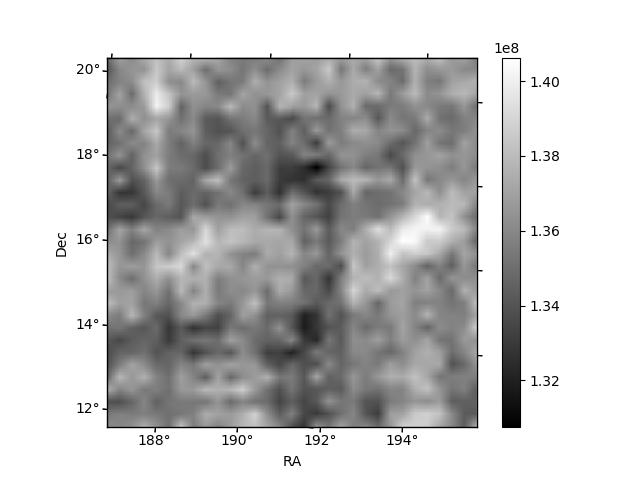
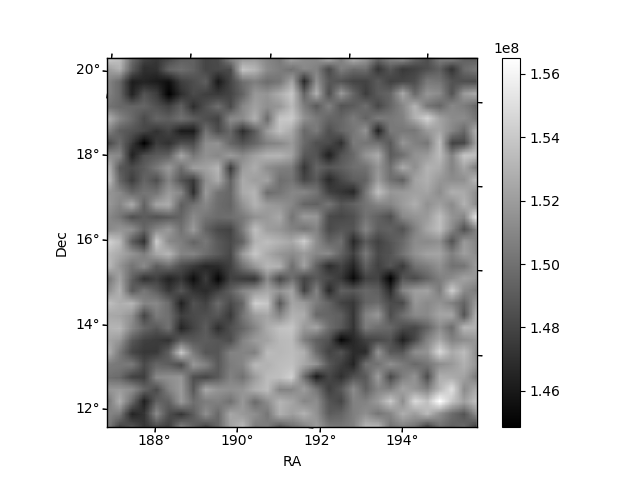
Histogram calculated using DETX and DETY for each event in the final _common_clean file
| Quadrant A | 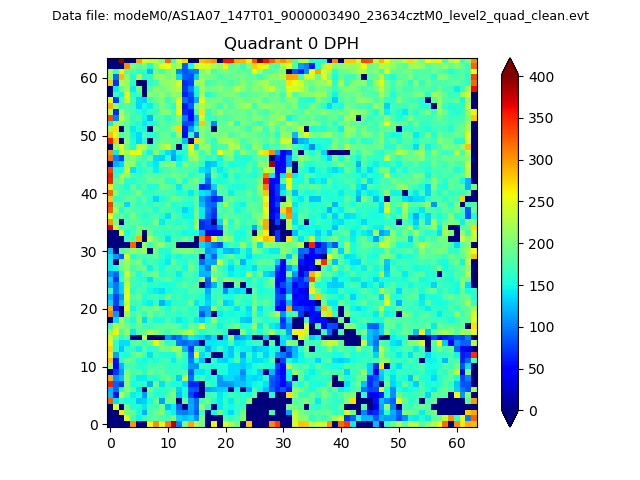 |
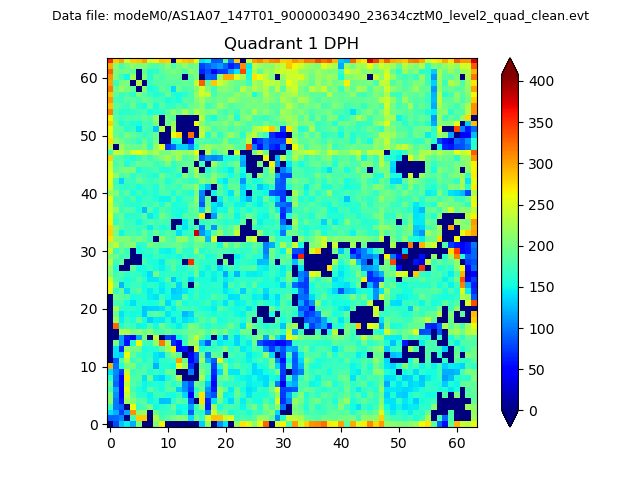 |
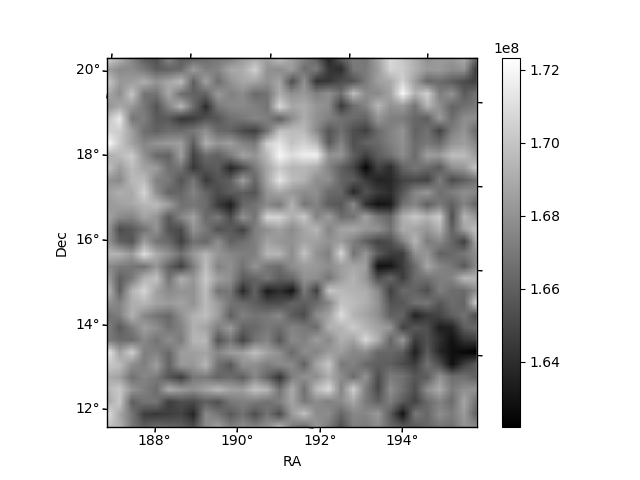
Quadrant B |
|---|---|---|---|
| Quadrant D | 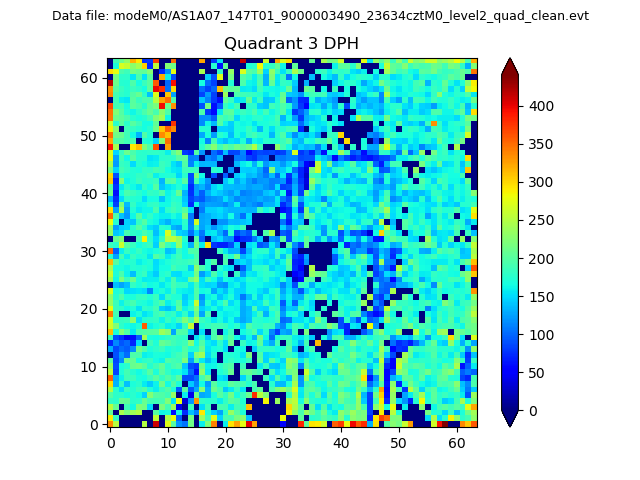 |
 |
Quadrant C |
| Plot type | Count rate plots | Images |
|---|---|---|
| Comparison with Poisson distribution Blue bars denote a histogram of data divided into 1 sec bins. Red curve is a Poisson curve with rate = median count rate of data. |
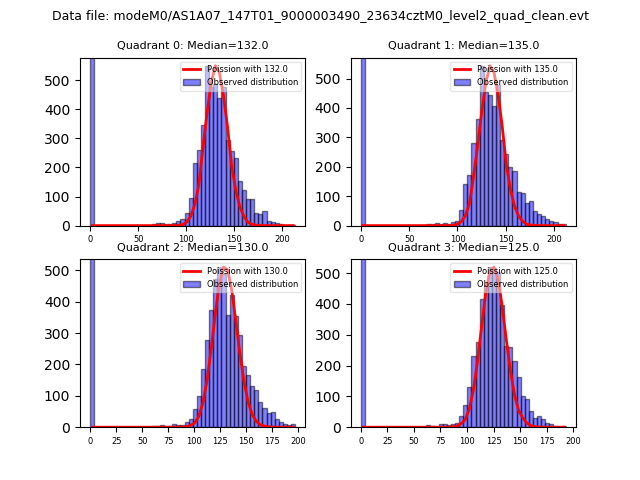 |
 |
| Quadrant-wise count rates Data is divided into 100 sec bins |
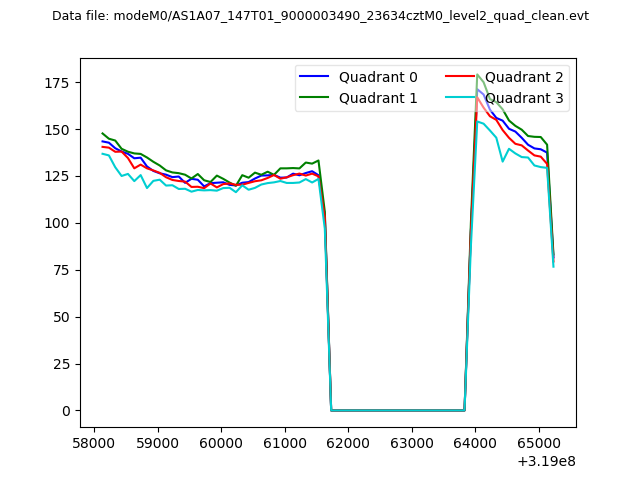 |
|
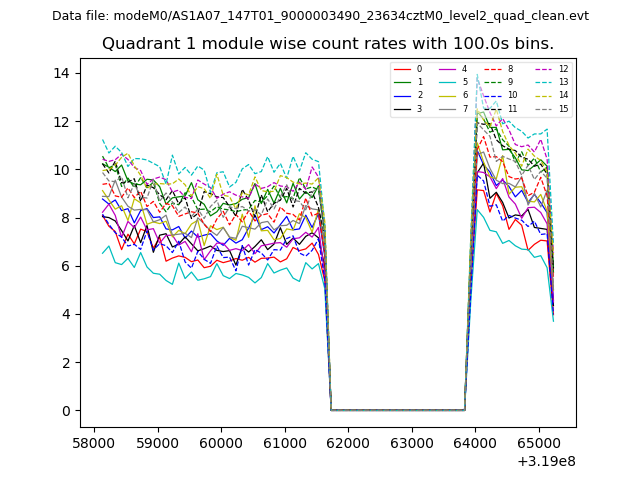
| Module-wise count rates for Quadrant A Data is divided into 100 sec bins |
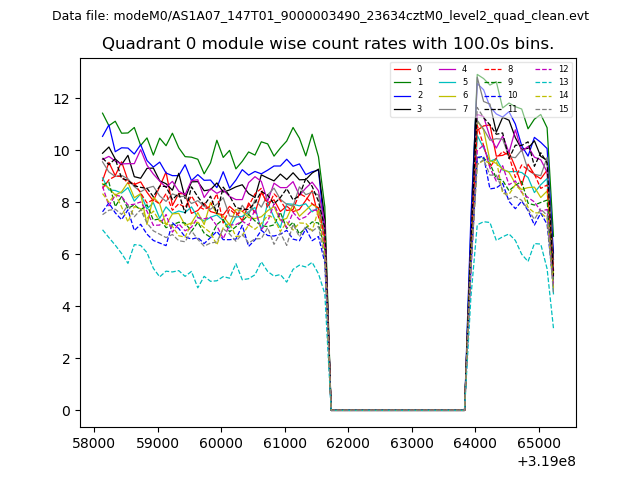 |
 |
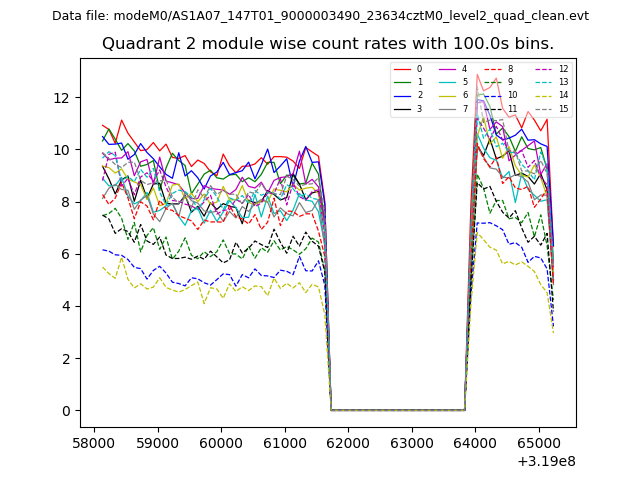
| Module-wise count rates for Quadrant B Data is divided into 100 sec bins |
 |
 |
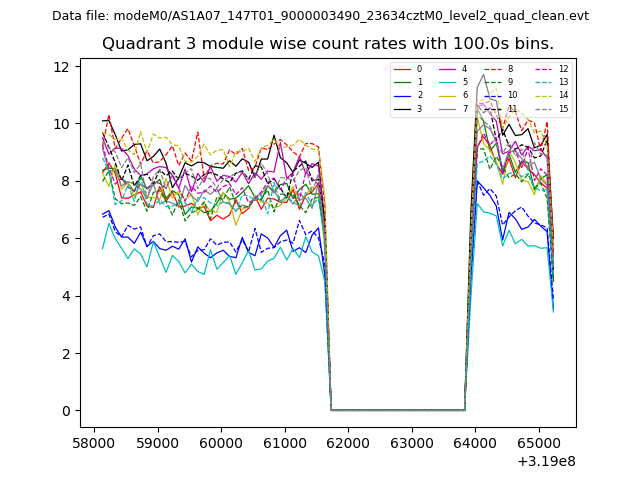
| Module-wise count rates for Quadrant C Data is divided into 100 sec bins |
 |
 |
| Module-wise count rates for Quadrant D Data is divided into 100 sec bins |
 |
 |
| Parameter | Plot |
|---|---|
| CZT HV Monitor | 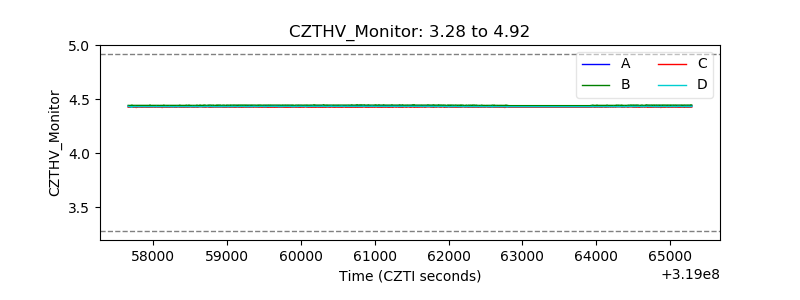 |
| D_VDD | 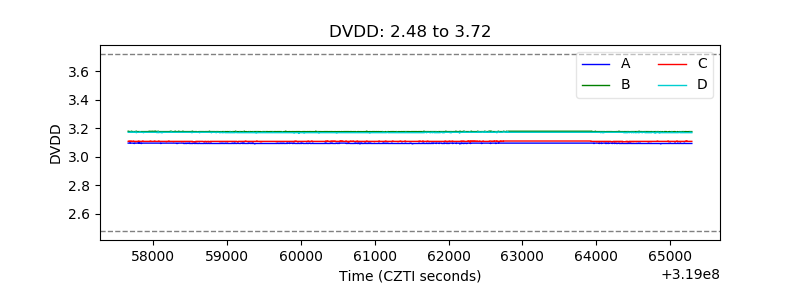 |
| Temperature 1 | 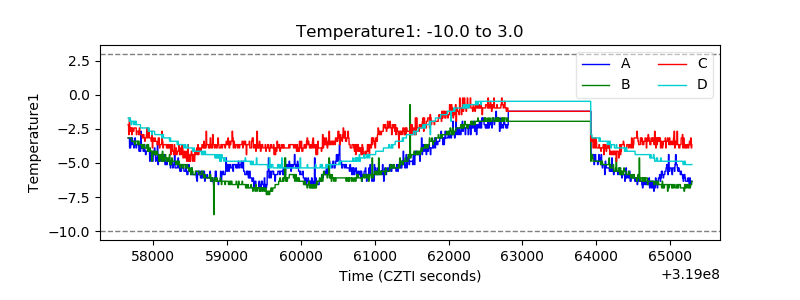 |
| Veto HV Monitor |  |
| Veto LLD | 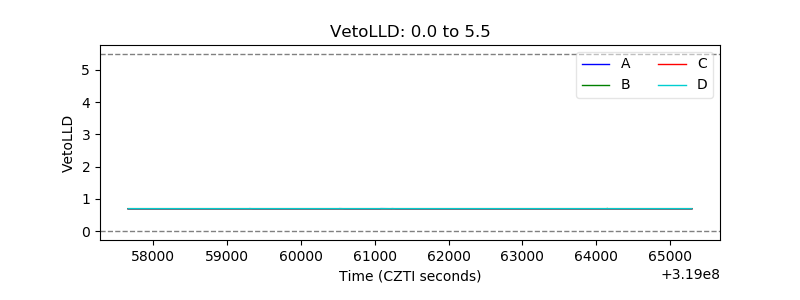 |
| Alpha Counter |  |
| _CPM_Rate | 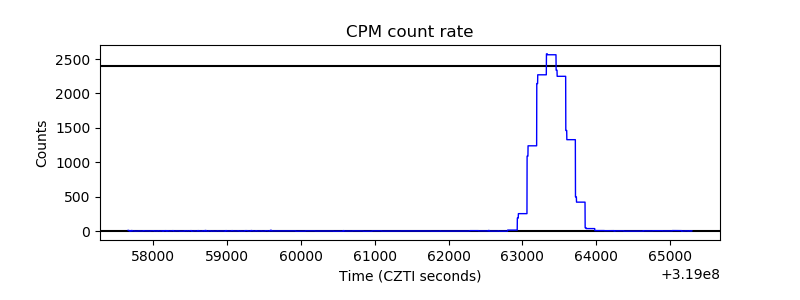 |
| CZT Counter | 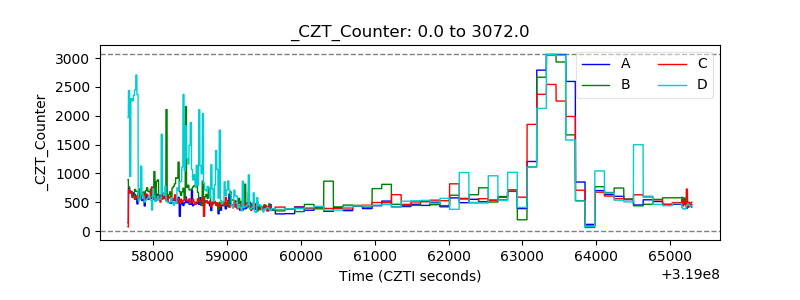 |
| +2.5 Volts monitor |  |
| +5 Volts monitor |  |
| _ROLL_ROT | 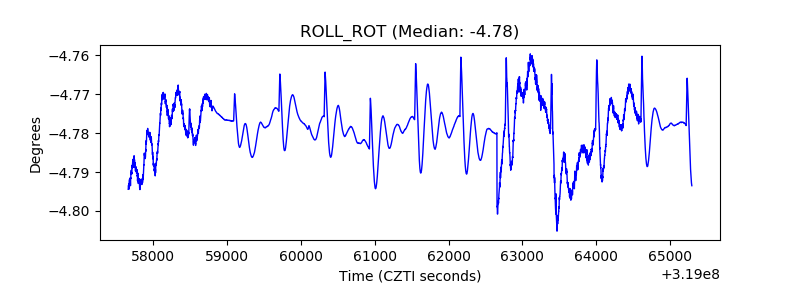 |
| _Roll_DEC | 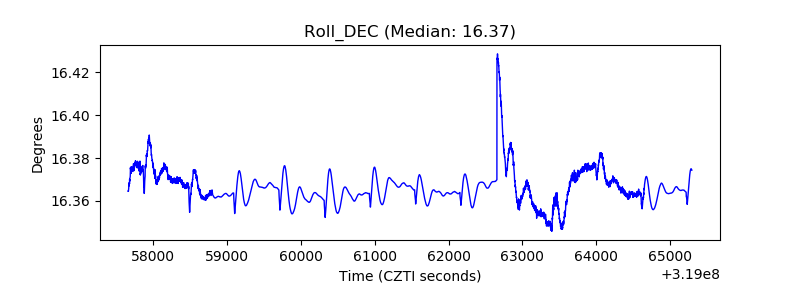 |
| _Roll_RA | 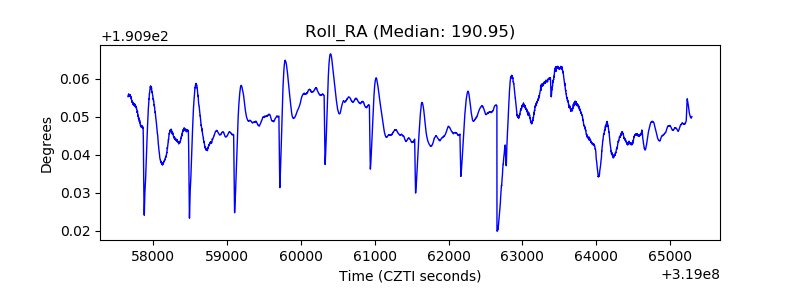 |
| Veto Counter | 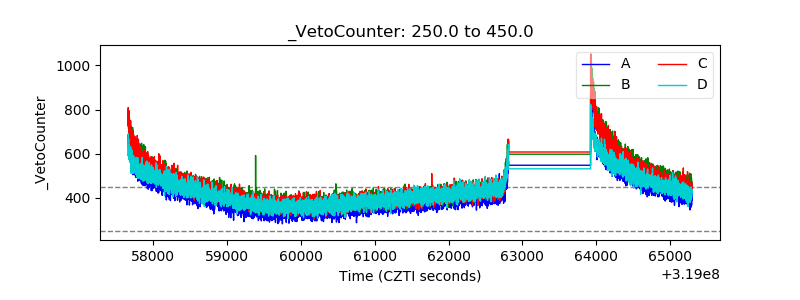 |