| Param | Original file | Final file |
|---|---|---|
| Filename | modeM0/AS1A07_147T01_9000003490_23635cztM0_level2.evt | modeM0/AS1A07_147T01_9000003490_23635cztM0_level2_quad_clean.evt |
| Size (bytes) | 485,559,360 | 106,070,400 |
| Size | 463.1 MB | 101.2 MB |
| Events in quadrant A | 3,395,138 | 694,236 |
| Events in quadrant B | 3,657,020 | 722,349 |
| Events in quadrant C | 3,439,222 | 677,429 |
| Events in quadrant D | 3,760,937 | 653,356 |
| Mode M9 | |||
|---|---|---|---|
| Quadrant | BADHDUFLAG | Total packets | Discarded packets |
| A | 0 | 22 | 0 |
| B | 0 | 22 | 0 |
| C | 0 | 22 | 0 |
| D | 0 | 22 | 0 |
| Mode SS | |||
|---|---|---|---|
| Quadrant | BADHDUFLAG | Total packets | Discarded packets |
| A | 0 | 140 | 0 |
| B | 0 | 140 | 0 |
| C | 0 | 140 | 0 |
| D | 0 | 140 | 0 |
| Mode M0 | |||
|---|---|---|---|
| Quadrant | BADHDUFLAG | Total packets | Discarded packets |
| A | 0 | 14305 | 2 |
| B | 0 | 15182 | 2 |
| C | 0 | 14419 | 2 |
| D | 0 | 15828 | 2 |
| Quadrant | Total seconds | Saturated seconds | Saturation percentage |
|---|---|---|---|
| A | 6663 | 78 | 1.170644% |
| B | 6663 | 110 | 1.650908% |
| C | 6663 | 107 | 1.605883% |
| D | 6663 | 99 | 1.485817% |
Noise dominated data is calculated using 1-second bins in cleaned event files. If a bin has >2000 counts, and if more than 50% of those come from <1% of pixels, then it is considered to be noise-dominated and hence unusable.
| Quadrant | # 1 sec bins | Bins with >0 counts | Bins with >2000 counts | High rate bins dominated by noise | Noise dominated (total time) | Noise dominated (detector-on time) | Marked lightcurve |
|---|---|---|---|---|---|---|---|
| A | 8963 | 6664 | 13 | 13 | 0.15% | 0.20% | 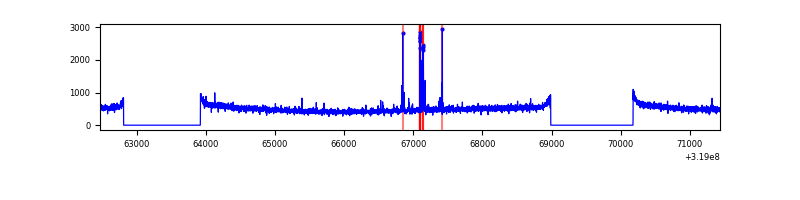 |
| B | 8963 | 6663 | 11 | 11 | 0.12% | 0.17% | 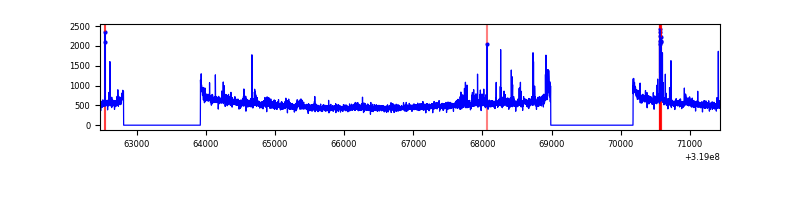 |
| C | 8963 | 6663 | 0 | 0 | 0.00% | 0.00% | 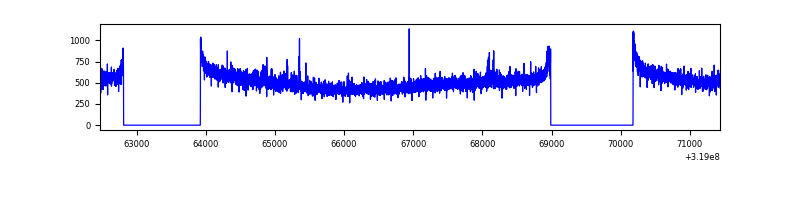 |
| D | 8963 | 6664 | 42 | 42 | 0.47% | 0.63% | 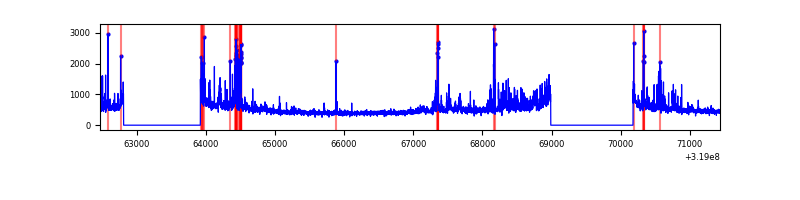 |
Top three noisy pixels from each quadrant. If the there are fewer than three noisy pixels in the level2.evt file, extra rows are filled as -1
| Pixel properties | Quadrant properties | ||||||
|---|---|---|---|---|---|---|---|
| Quadrant | DetID | PixID | Counts | Sigma | Mean | Median | Sigma |
| A | 12 | 96 | 67792 | 386.42 | 863 | 844 | 173.3 |
| A | 13 | 254 | 10666 | 56.69 | 863 | 844 | 173.3 |
| A | 3 | 137 | 7549 | 38.7 | 863 | 844 | 173.3 |
| B | 3 | 64 | 115288 | 688.56 | 871 | 850 | 166.2 |
| B | 0 | 189 | 63327 | 375.92 | 871 | 850 | 166.2 |
| B | 0 | 229 | 28414 | 165.85 | 871 | 850 | 166.2 |
| C | 14 | 238 | 133674 | 681.97 | 833 | 840 | 194.8 |
| C | 7 | 247 | 33163 | 165.95 | 833 | 840 | 194.8 |
| C | 10 | 91 | 12762 | 61.21 | 833 | 840 | 194.8 |
| D | 9 | 85 | 270985 | 1340.58 | 831 | 809 | 201.5 |
| D | 12 | 233 | 222300 | 1099.01 | 831 | 809 | 201.5 |
| D | 1 | 52 | 48221 | 235.25 | 831 | 809 | 201.5 |
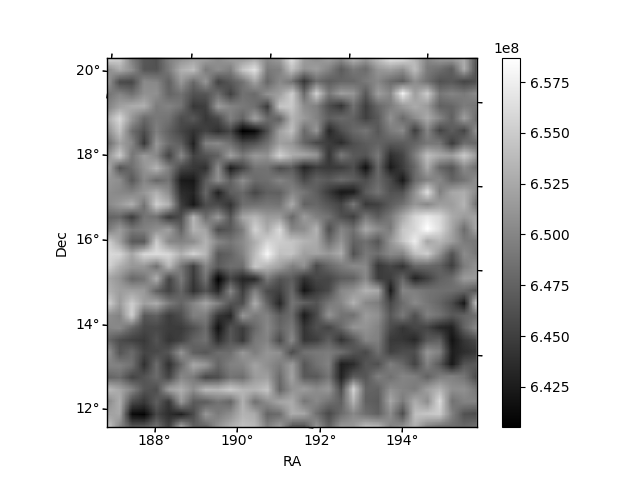
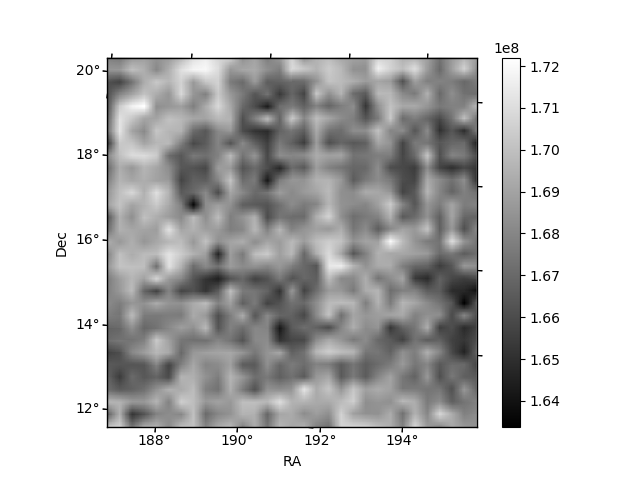
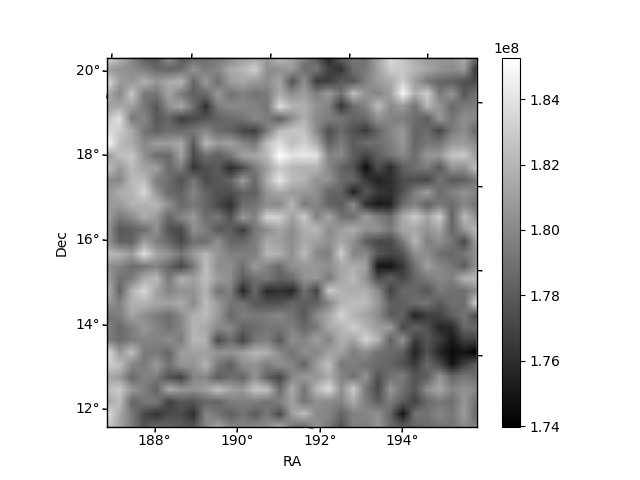
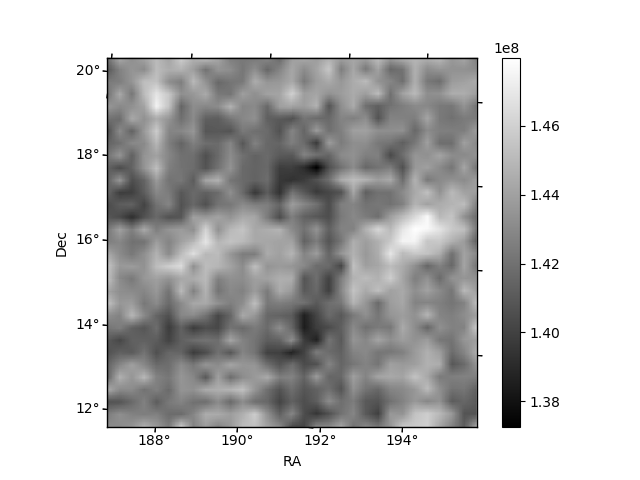
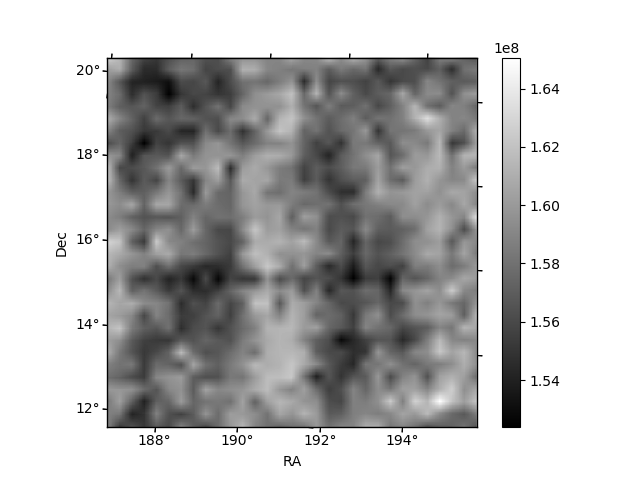
Histogram calculated using DETX and DETY for each event in the final _common_clean file
| Quadrant A | 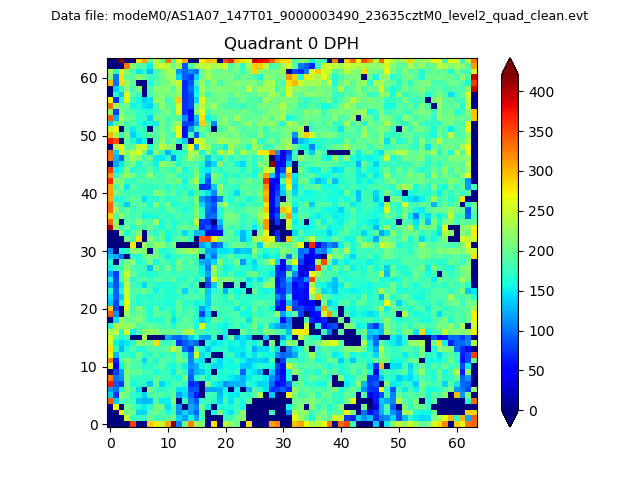 |
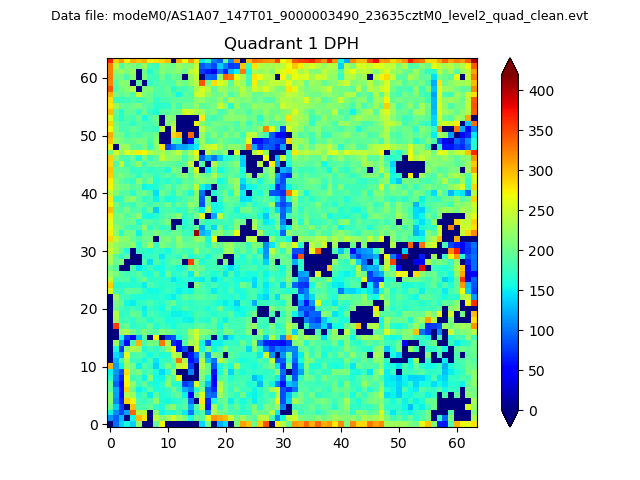 |
Quadrant B |
|---|---|---|---|
| Quadrant D | 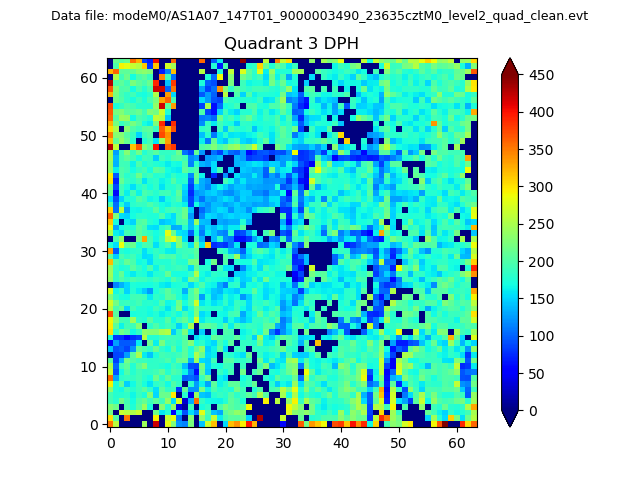 |
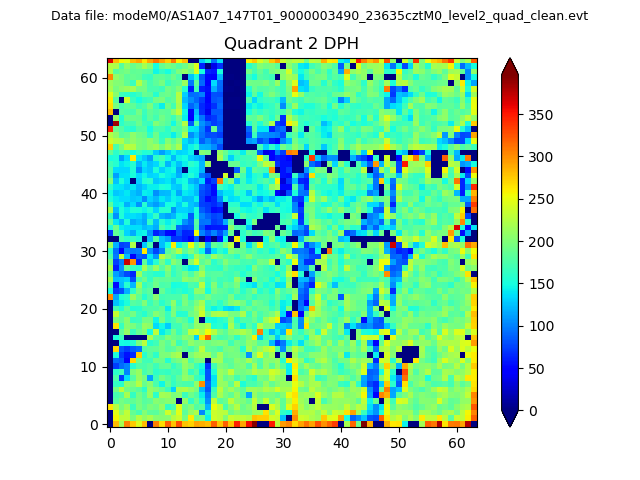 |
Quadrant C |
| Plot type | Count rate plots | Images |
|---|---|---|
| Comparison with Poisson distribution Blue bars denote a histogram of data divided into 1 sec bins. Red curve is a Poisson curve with rate = median count rate of data. |
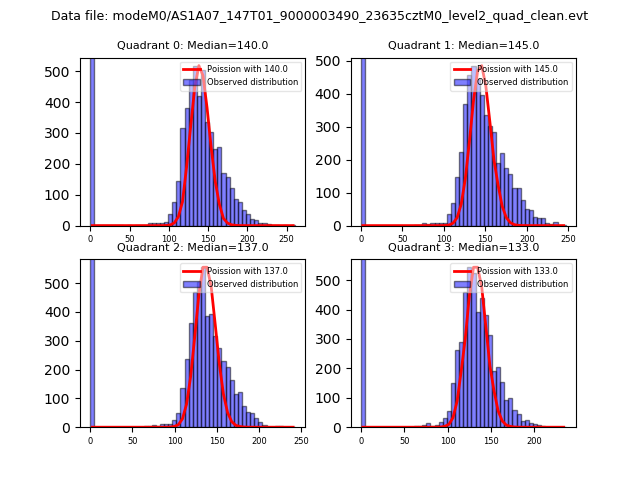 |
 |
| Quadrant-wise count rates Data is divided into 100 sec bins |
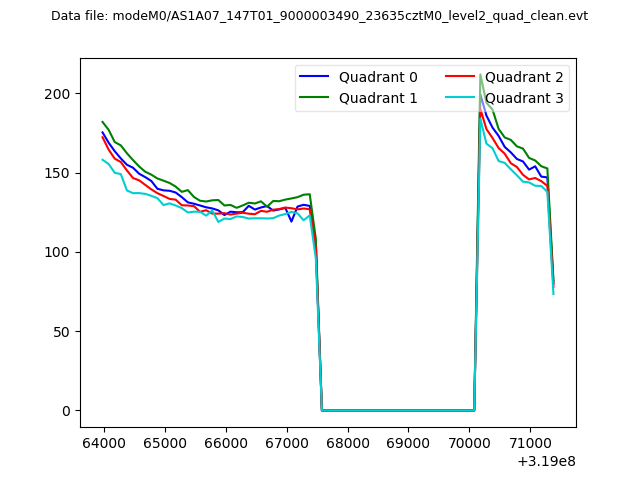 |
|
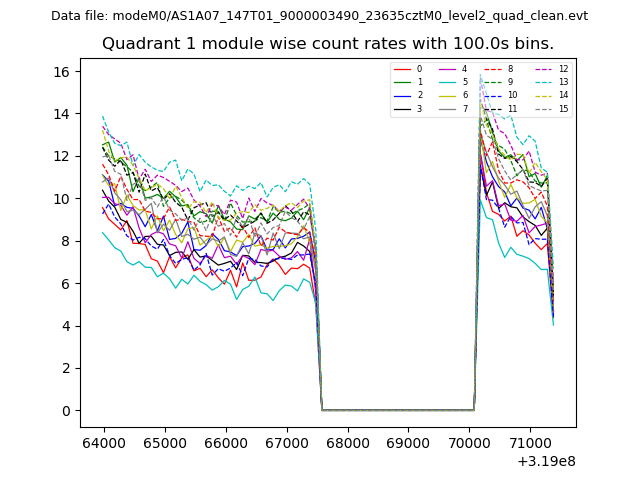
| Module-wise count rates for Quadrant A Data is divided into 100 sec bins |
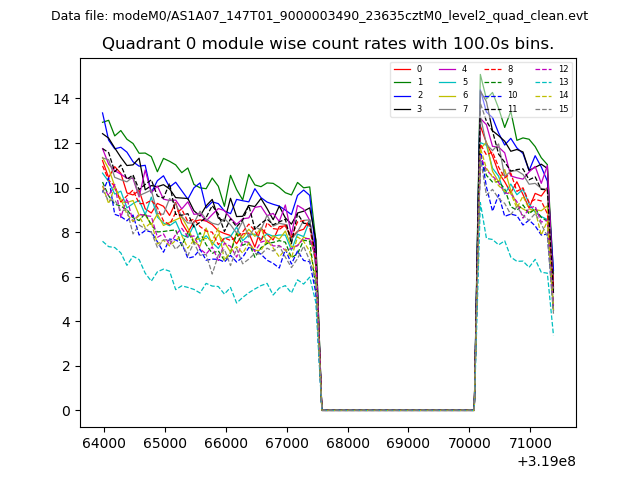 |
 |
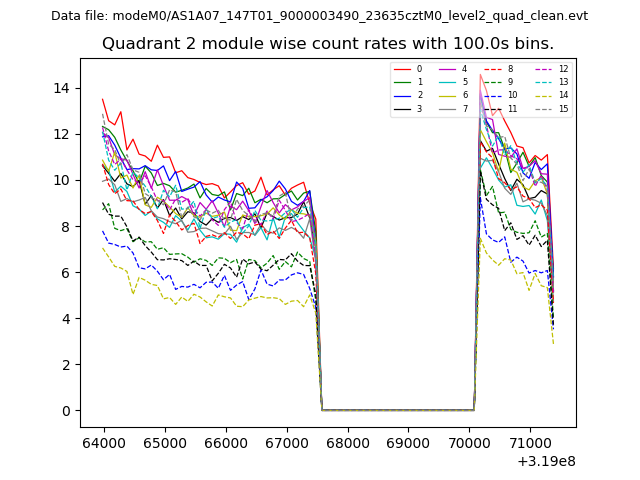
| Module-wise count rates for Quadrant B Data is divided into 100 sec bins |
 |
 |
| Module-wise count rates for Quadrant C Data is divided into 100 sec bins |
 |
 |
| Module-wise count rates for Quadrant D Data is divided into 100 sec bins |
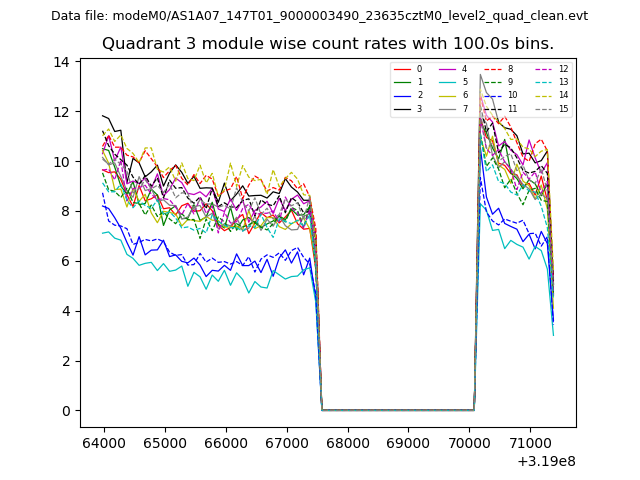 |
 |
| Parameter | Plot |
|---|---|
| CZT HV Monitor | 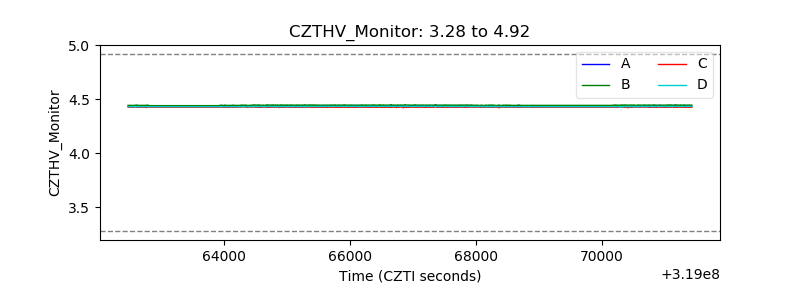 |
| D_VDD | 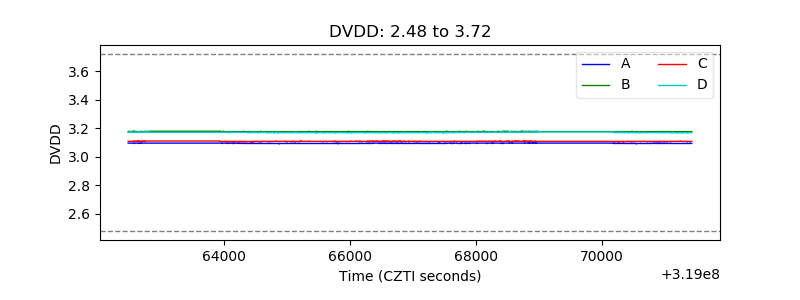 |
| Temperature 1 | 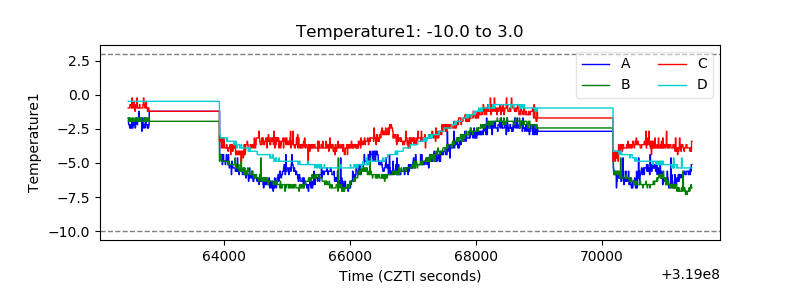 |
| Veto HV Monitor | 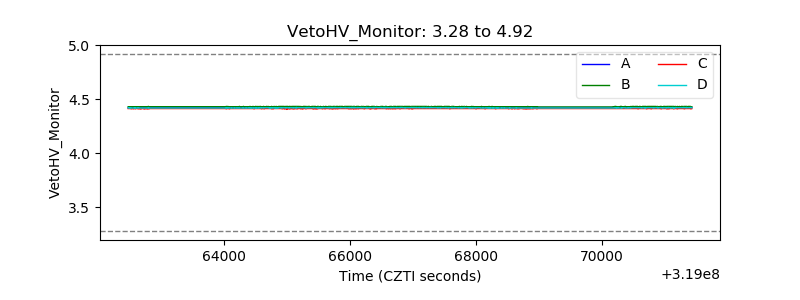 |
| Veto LLD | 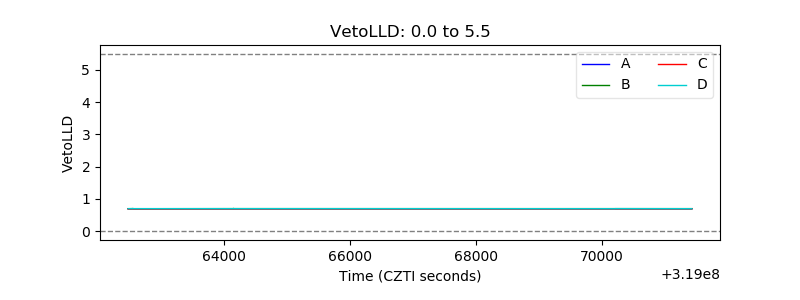 |
| Alpha Counter |  |
| _CPM_Rate | 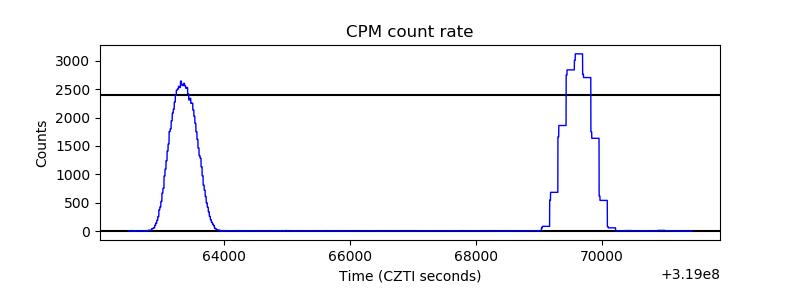 |
| CZT Counter | 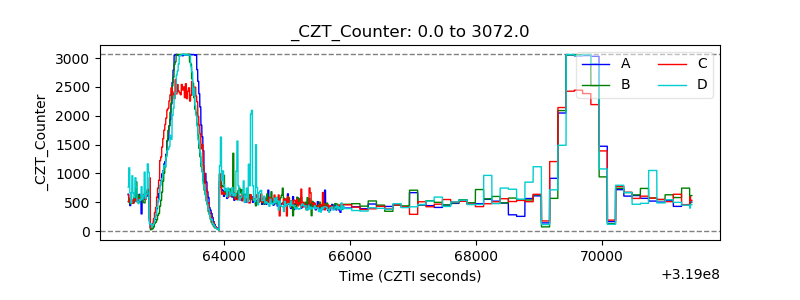 |
| +2.5 Volts monitor | 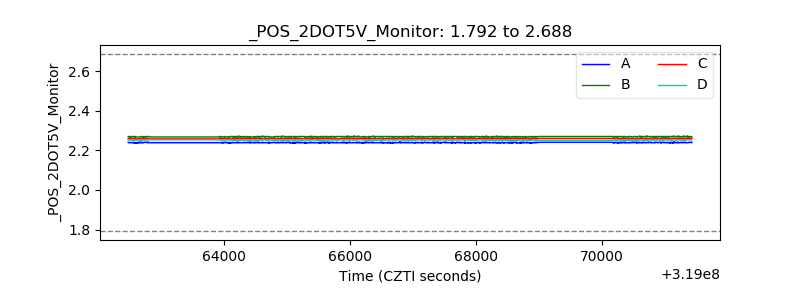 |
| +5 Volts monitor |  |
| _ROLL_ROT | 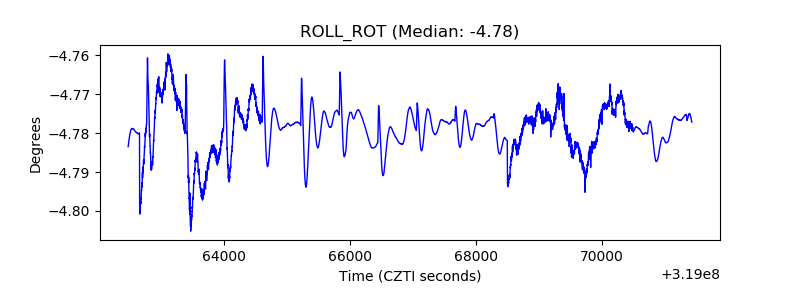 |
| _Roll_DEC | 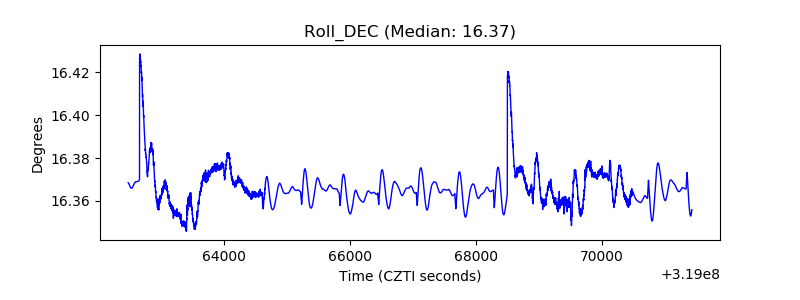 |
| _Roll_RA | 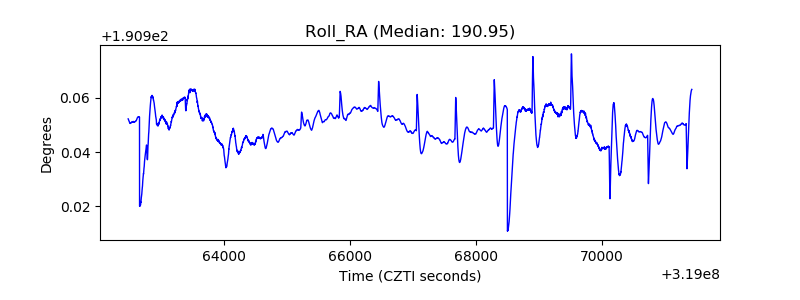 |
| Veto Counter | 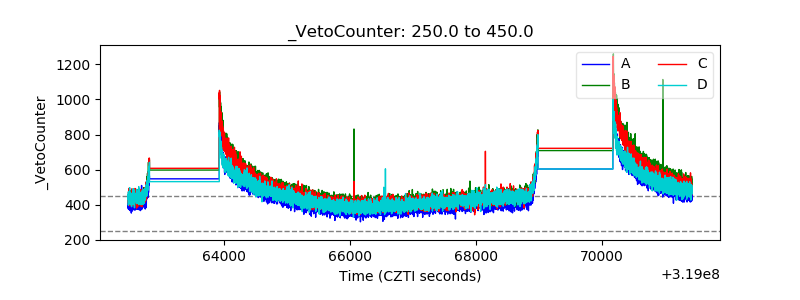 |