| Param | Original file | Final file |
|---|---|---|
| Filename | modeM0/AS1A07_147T01_9000003490_23637cztM0_level2.evt | modeM0/AS1A07_147T01_9000003490_23637cztM0_level2_quad_clean.evt |
| Size (bytes) | 512,049,600 | 101,528,640 |
| Size | 488.3 MB | 96.8 MB |
| Events in quadrant A | 3,269,515 | 667,910 |
| Events in quadrant B | 3,544,843 | 693,706 |
| Events in quadrant C | 3,329,765 | 646,371 |
| Events in quadrant D | 4,925,954 | 616,962 |
| Mode M9 | |||
|---|---|---|---|
| Quadrant | BADHDUFLAG | Total packets | Discarded packets |
| A | 0 | 21 | 0 |
| B | 0 | 22 | 0 |
| C | 0 | 22 | 0 |
| D | 0 | 22 | 0 |
| Mode SS | |||
|---|---|---|---|
| Quadrant | BADHDUFLAG | Total packets | Discarded packets |
| A | 0 | 130 | 0 |
| B | 0 | 130 | 0 |
| C | 0 | 130 | 0 |
| D | 0 | 130 | 0 |
| Mode M0 | |||
|---|---|---|---|
| Quadrant | BADHDUFLAG | Total packets | Discarded packets |
| A | 0 | 13550 | 2 |
| B | 0 | 14449 | 2 |
| C | 0 | 13727 | 2 |
| D | 0 | 18949 | 2 |
| Quadrant | Total seconds | Saturated seconds | Saturation percentage |
|---|---|---|---|
| A | 6451 | 23 | 0.356534% |
| B | 6451 | 74 | 1.147109% |
| C | 6451 | 81 | 1.255619% |
| D | 6451 | 386 | 5.983568% |
Noise dominated data is calculated using 1-second bins in cleaned event files. If a bin has >2000 counts, and if more than 50% of those come from <1% of pixels, then it is considered to be noise-dominated and hence unusable.
| Quadrant | # 1 sec bins | Bins with >0 counts | Bins with >2000 counts | High rate bins dominated by noise | Noise dominated (total time) | Noise dominated (detector-on time) | Marked lightcurve |
|---|---|---|---|---|---|---|---|
| A | 7816 | 6453 | 0 | 0 | 0.00% | 0.00% | 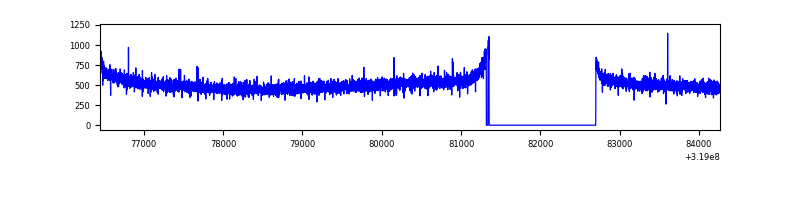 |
| B | 7816 | 6452 | 15 | 15 | 0.19% | 0.23% | 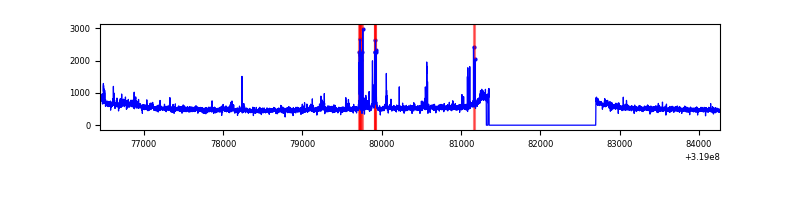 |
| C | 7816 | 6452 | 1 | 1 | 0.01% | 0.02% | 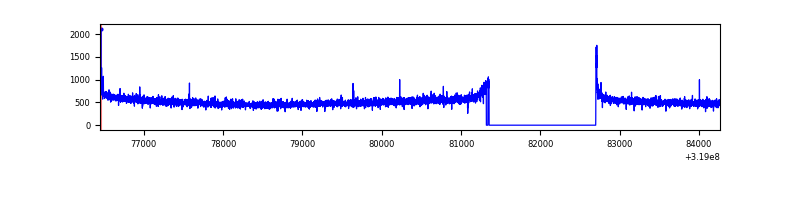 |
| D | 7816 | 6453 | 326 | 326 | 4.17% | 5.05% | 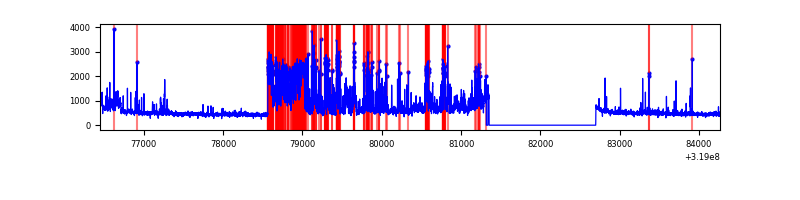 |
Top three noisy pixels from each quadrant. If the there are fewer than three noisy pixels in the level2.evt file, extra rows are filled as -1
| Pixel properties | Quadrant properties | ||||||
|---|---|---|---|---|---|---|---|
| Quadrant | DetID | PixID | Counts | Sigma | Mean | Median | Sigma |
| A | 13 | 254 | 9286 | 49.95 | 848 | 832 | 169.2 |
| A | 0 | 226 | 7347 | 38.5 | 848 | 832 | 169.2 |
| A | 3 | 137 | 7019 | 36.56 | 848 | 832 | 169.2 |
| B | 0 | 189 | 102201 | 634.58 | 849 | 829 | 159.7 |
| B | 3 | 64 | 70013 | 433.09 | 849 | 829 | 159.7 |
| B | 10 | 247 | 39827 | 244.12 | 849 | 829 | 159.7 |
| C | 14 | 238 | 131262 | 690.46 | 810 | 817 | 188.9 |
| C | 7 | 247 | 17475 | 88.17 | 810 | 817 | 188.9 |
| C | 0 | 10 | 15792 | 79.26 | 810 | 817 | 188.9 |
| D | 1 | 52 | 1425138 | 7364.42 | 802 | 780 | 193.4 |
| D | 12 | 233 | 298610 | 1539.88 | 802 | 780 | 193.4 |
| D | 9 | 85 | 139867 | 719.13 | 802 | 780 | 193.4 |
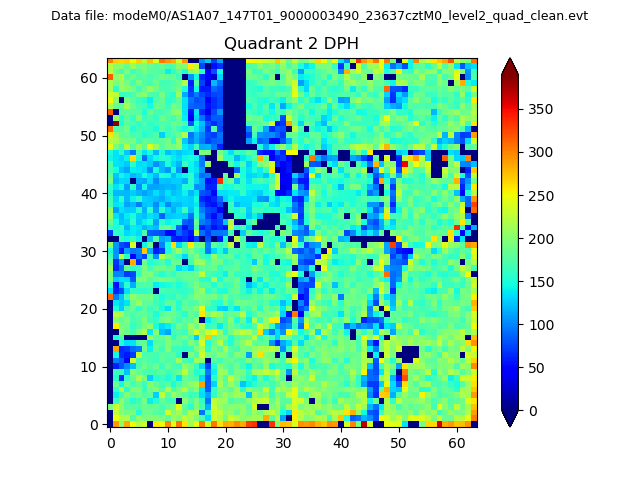
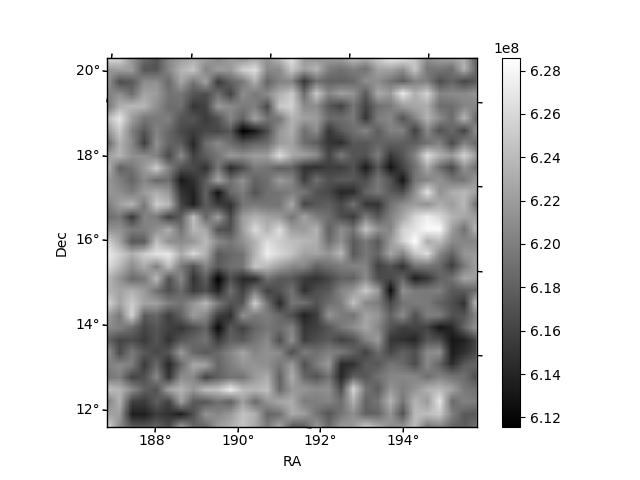
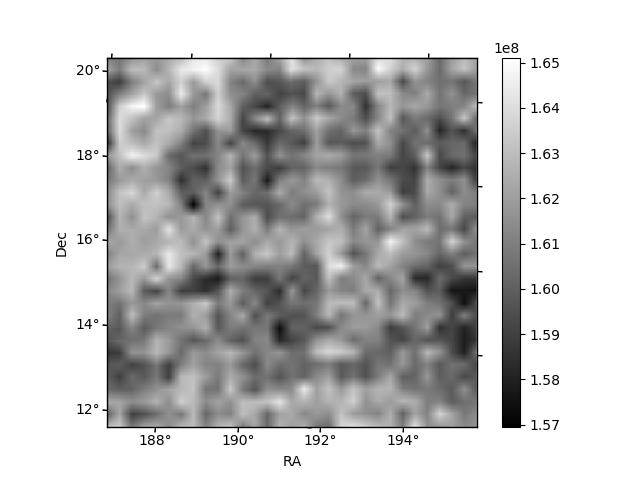
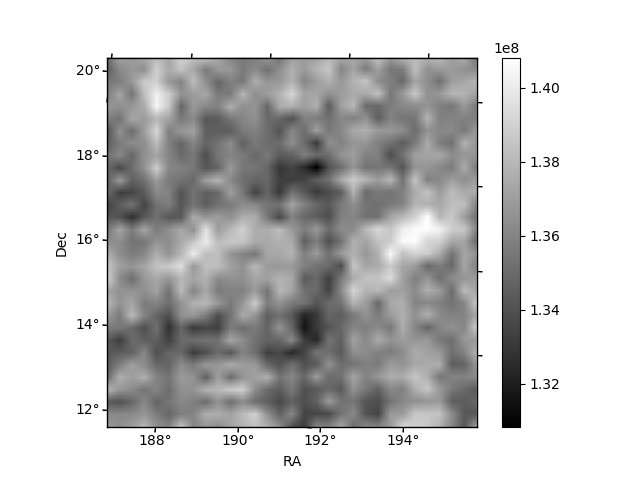
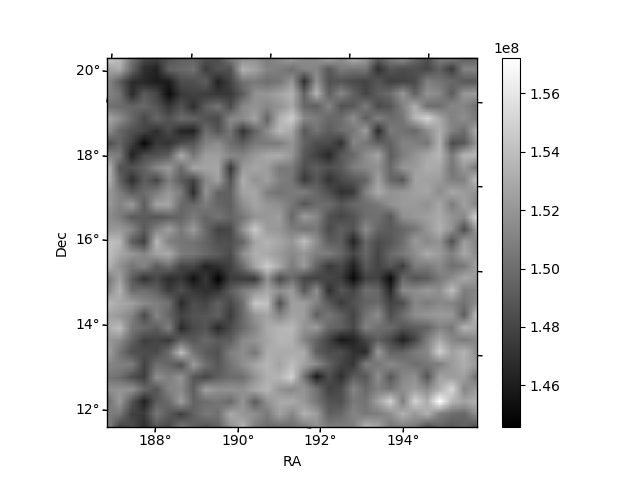
Histogram calculated using DETX and DETY for each event in the final _common_clean file
| Quadrant A | 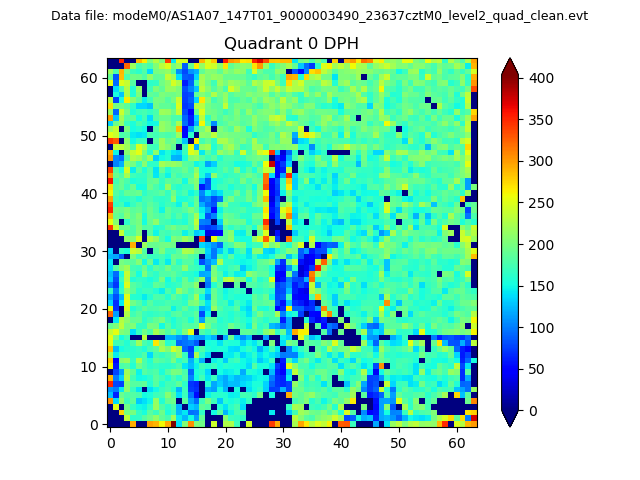 |
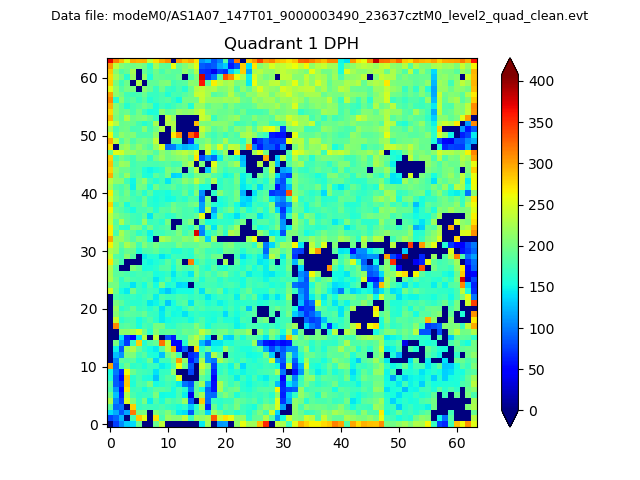 |
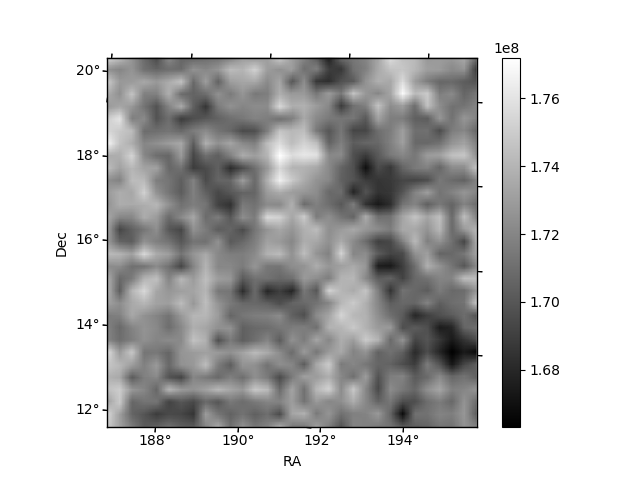
Quadrant B |
|---|---|---|---|
| Quadrant D | 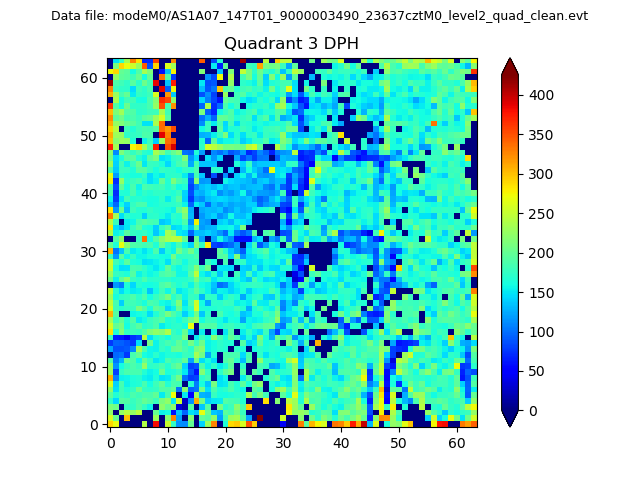 |
 |
Quadrant C |
| Plot type | Count rate plots | Images |
|---|---|---|
| Comparison with Poisson distribution Blue bars denote a histogram of data divided into 1 sec bins. Red curve is a Poisson curve with rate = median count rate of data. |
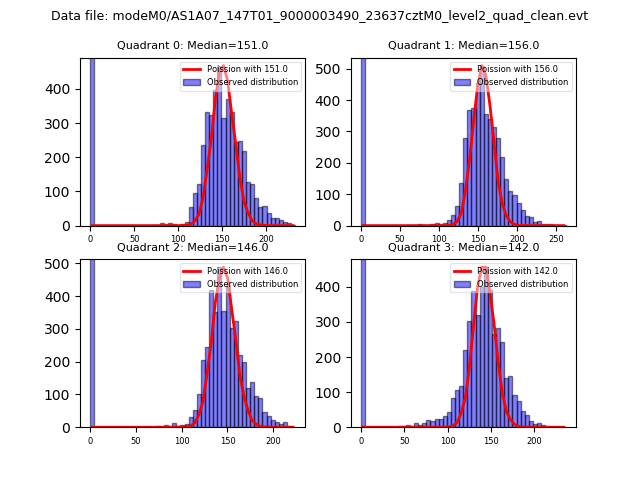 |
 |
| Quadrant-wise count rates Data is divided into 100 sec bins |
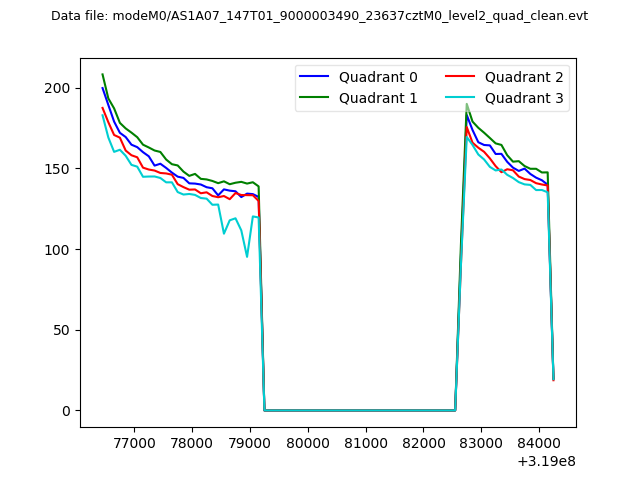 |
|
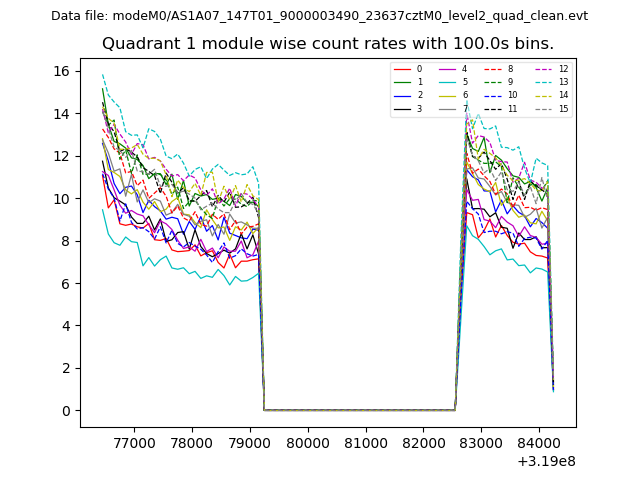
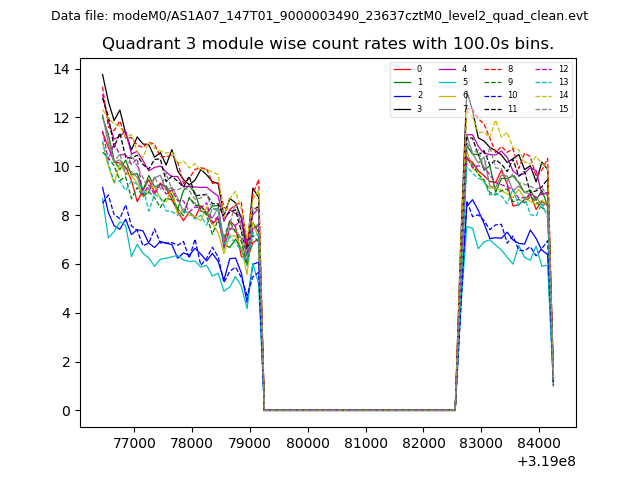
| Module-wise count rates for Quadrant A Data is divided into 100 sec bins |
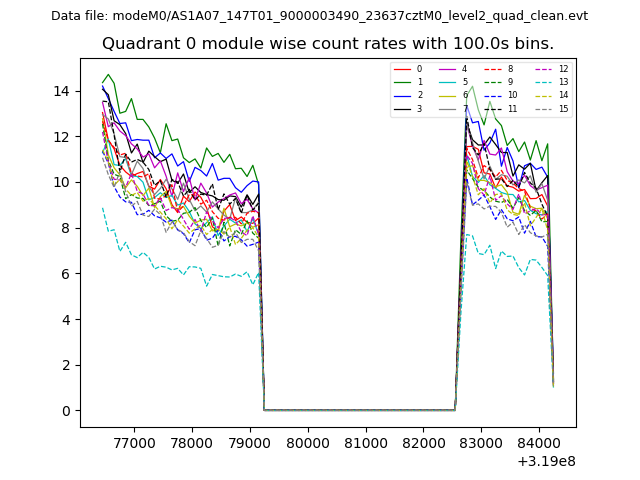 |
 |
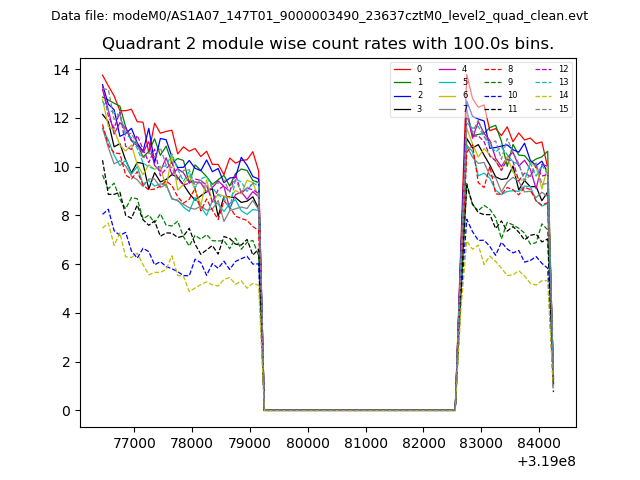
| Module-wise count rates for Quadrant B Data is divided into 100 sec bins |
 |
 |
| Module-wise count rates for Quadrant C Data is divided into 100 sec bins |
 |
 |
| Module-wise count rates for Quadrant D Data is divided into 100 sec bins |
 |
 |
| Parameter | Plot |
|---|---|
| CZT HV Monitor | 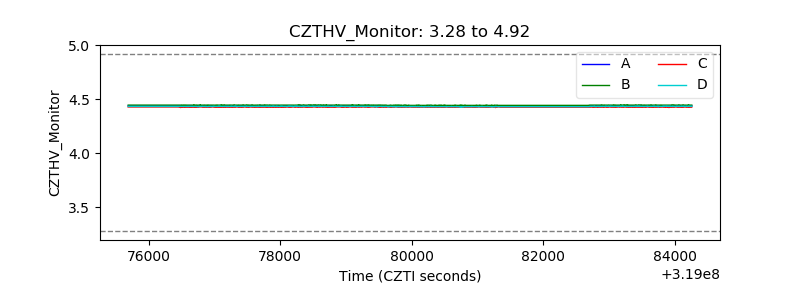 |
| D_VDD | 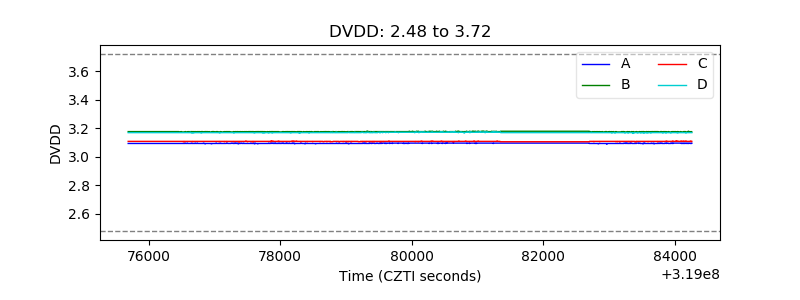 |
| Temperature 1 | 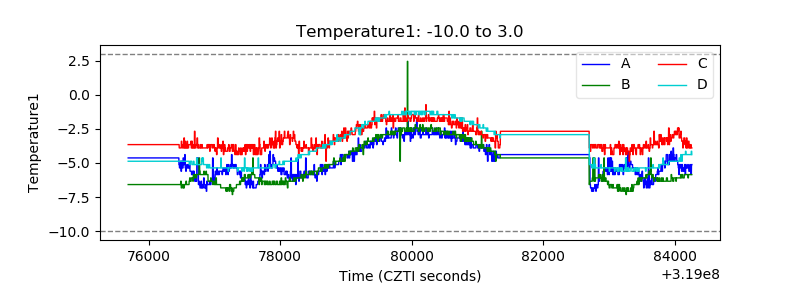 |
| Veto HV Monitor |  |
| Veto LLD | 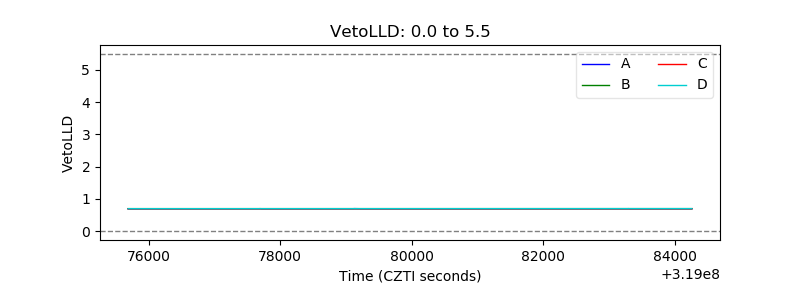 |
| Alpha Counter | 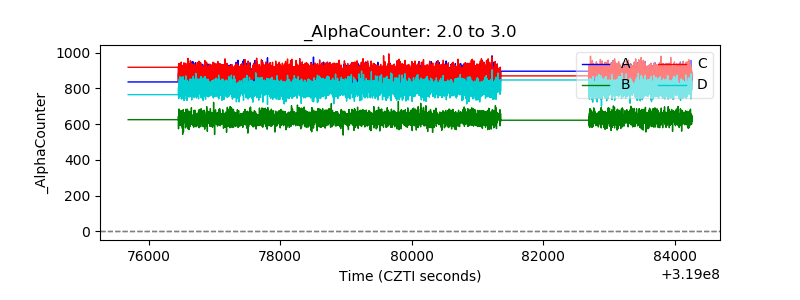 |
| _CPM_Rate | 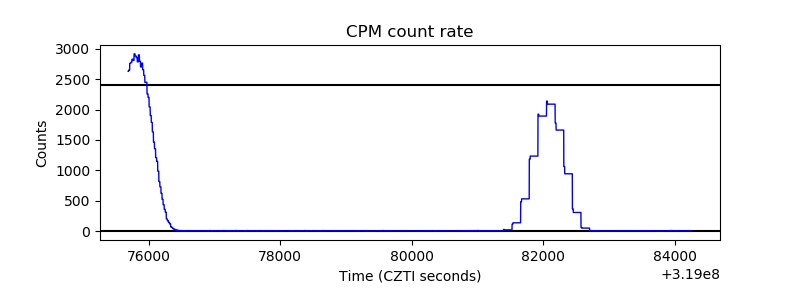 |
| CZT Counter | 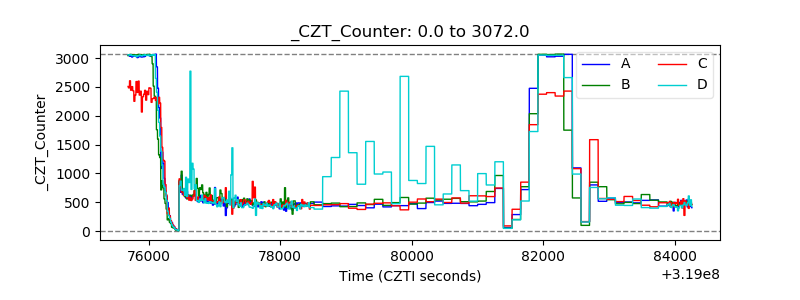 |
| +2.5 Volts monitor | 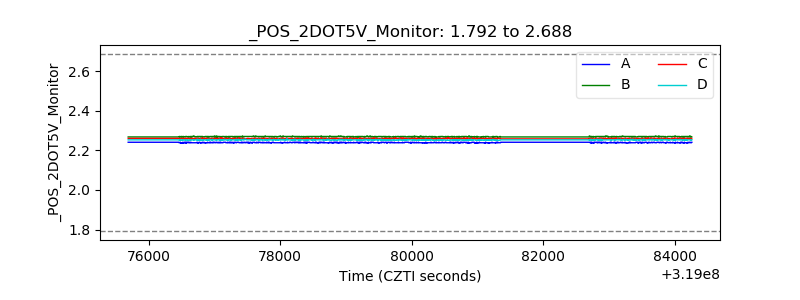 |
| +5 Volts monitor |  |
| _ROLL_ROT | 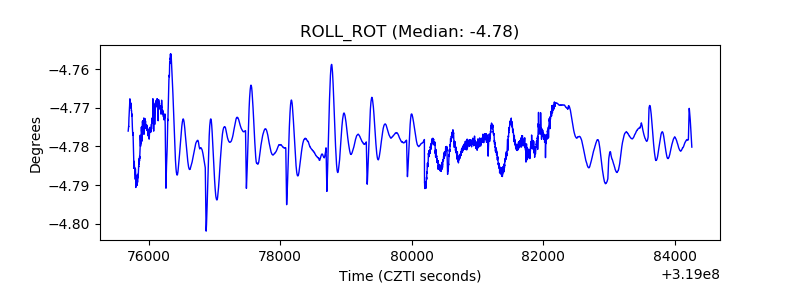 |
| _Roll_DEC | 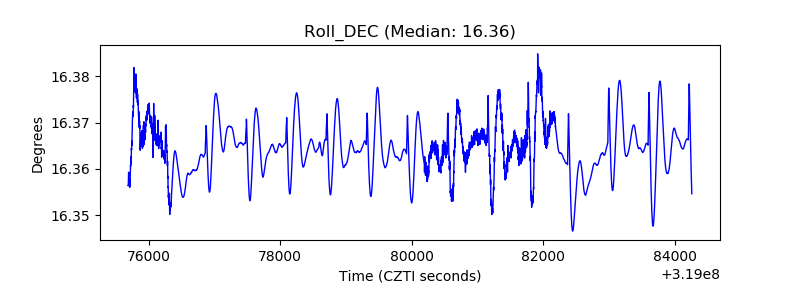 |
| _Roll_RA | 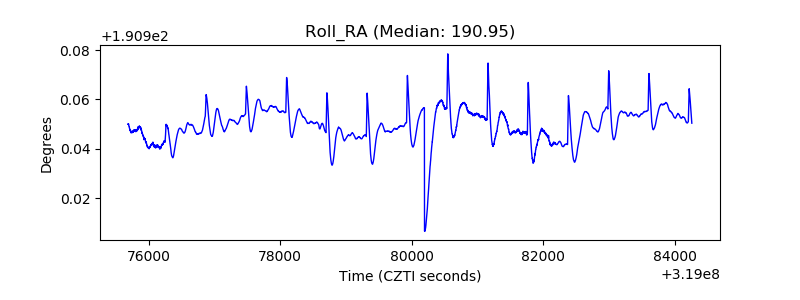 |
| Veto Counter | 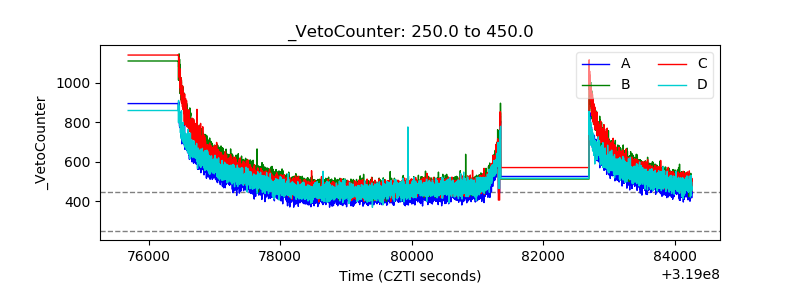 |