| Param | Original file | Final file |
|---|---|---|
| Filename | modeM0/AS1A07_147T01_9000003490_23638cztM0_level2.evt | modeM0/AS1A07_147T01_9000003490_23638cztM0_level2_quad_clean.evt |
| Size (bytes) | 482,221,440 | 97,845,120 |
| Size | 459.9 MB | 93.3 MB |
| Events in quadrant A | 3,285,805 | 635,345 |
| Events in quadrant B | 3,458,650 | 652,781 |
| Events in quadrant C | 3,324,759 | 618,237 |
| Events in quadrant D | 4,092,396 | 602,323 |
| Mode M9 | |||
|---|---|---|---|
| Quadrant | BADHDUFLAG | Total packets | Discarded packets |
| A | 0 | 22 | 0 |
| B | 0 | 23 | 0 |
| C | 0 | 23 | 0 |
| D | 0 | 23 | 0 |
| Mode SS | |||
|---|---|---|---|
| Quadrant | BADHDUFLAG | Total packets | Discarded packets |
| A | 0 | 132 | 0 |
| B | 0 | 132 | 0 |
| C | 0 | 132 | 0 |
| D | 0 | 132 | 0 |
| Mode M0 | |||
|---|---|---|---|
| Quadrant | BADHDUFLAG | Total packets | Discarded packets |
| A | 0 | 13608 | 2 |
| B | 0 | 14149 | 2 |
| C | 0 | 13726 | 2 |
| D | 0 | 16431 | 2 |
| Quadrant | Total seconds | Saturated seconds | Saturation percentage |
|---|---|---|---|
| A | 6521 | 35 | 0.536727% |
| B | 6520 | 80 | 1.226994% |
| C | 6520 | 80 | 1.226994% |
| D | 6520 | 106 | 1.625767% |
Noise dominated data is calculated using 1-second bins in cleaned event files. If a bin has >2000 counts, and if more than 50% of those come from <1% of pixels, then it is considered to be noise-dominated and hence unusable.
| Quadrant | # 1 sec bins | Bins with >0 counts | Bins with >2000 counts | High rate bins dominated by noise | Noise dominated (total time) | Noise dominated (detector-on time) | Marked lightcurve |
|---|---|---|---|---|---|---|---|
| A | 7821 | 6522 | 0 | 0 | 0.00% | 0.00% | 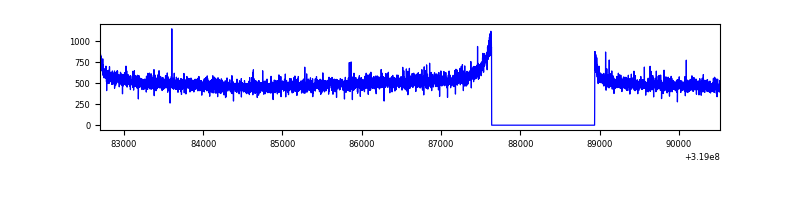 |
| B | 7820 | 6521 | 21 | 21 | 0.27% | 0.32% | 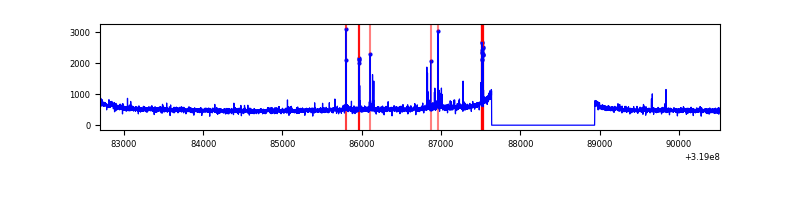 |
| C | 7820 | 6521 | 1 | 1 | 0.01% | 0.02% | 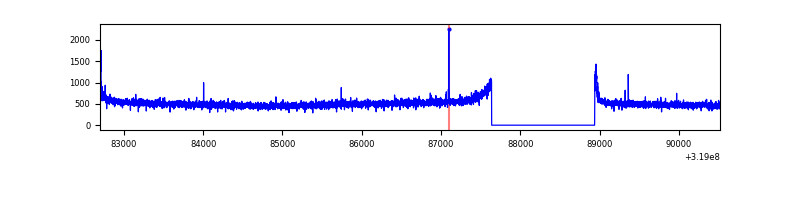 |
| D | 7820 | 6521 | 65 | 65 | 0.83% | 1.00% | 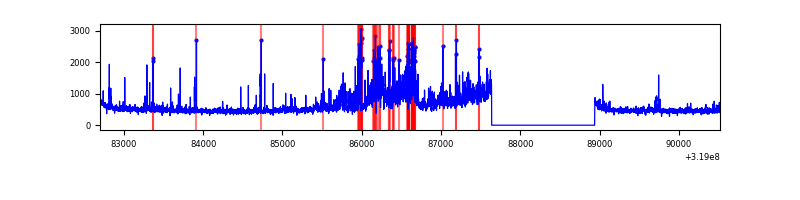 |
Top three noisy pixels from each quadrant. If the there are fewer than three noisy pixels in the level2.evt file, extra rows are filled as -1
| Pixel properties | Quadrant properties | ||||||
|---|---|---|---|---|---|---|---|
| Quadrant | DetID | PixID | Counts | Sigma | Mean | Median | Sigma |
| A | 13 | 254 | 9682 | 51.81 | 853 | 838 | 170.7 |
| A | 0 | 226 | 7415 | 38.53 | 853 | 838 | 170.7 |
| A | 3 | 137 | 7124 | 36.82 | 853 | 838 | 170.7 |
| B | 3 | 64 | 69631 | 431.04 | 845 | 829 | 159.6 |
| B | 0 | 189 | 30380 | 185.14 | 845 | 829 | 159.6 |
| B | 4 | 216 | 21165 | 127.4 | 845 | 829 | 159.6 |
| C | 14 | 238 | 131471 | 694.07 | 810 | 817 | 188.2 |
| C | 0 | 10 | 24085 | 123.61 | 810 | 817 | 188.2 |
| C | 7 | 247 | 10793 | 53.0 | 810 | 817 | 188.2 |
| D | 1 | 52 | 406131 | 2043.02 | 819 | 796 | 198.4 |
| D | 9 | 85 | 384638 | 1934.68 | 819 | 796 | 198.4 |
| D | 12 | 233 | 180045 | 903.47 | 819 | 796 | 198.4 |
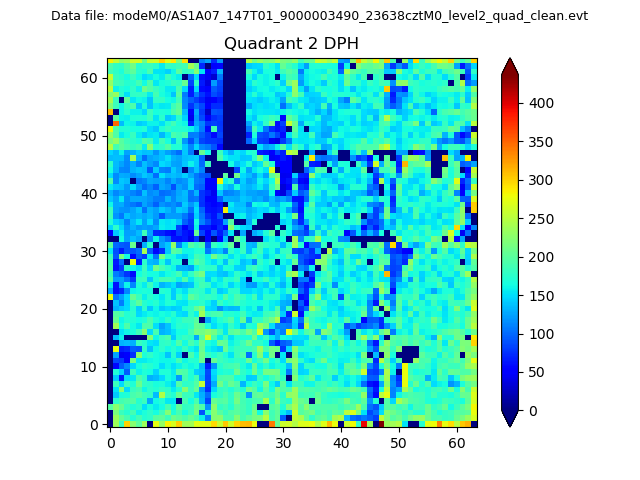
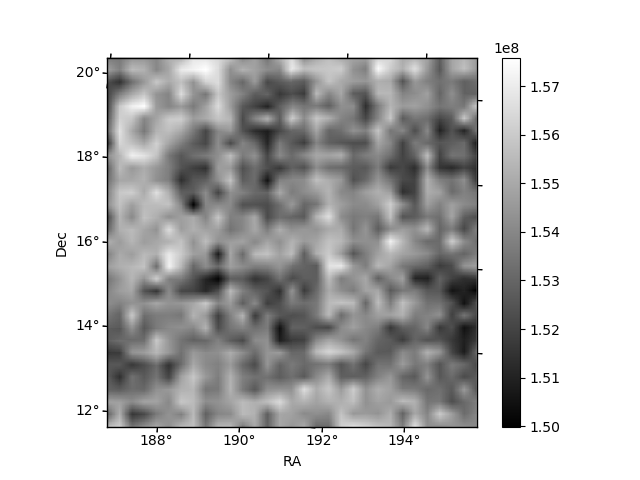
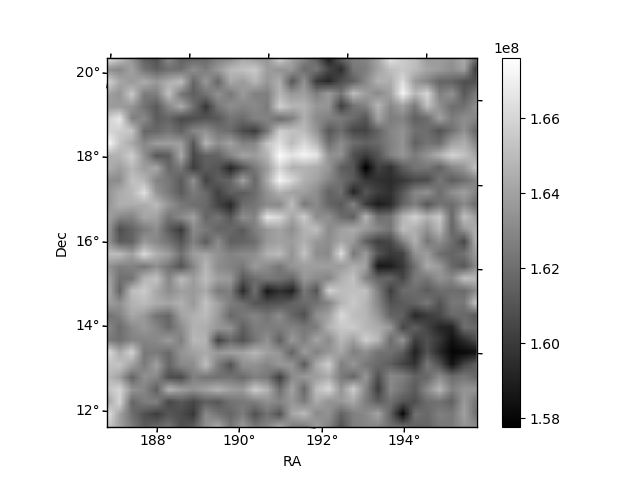
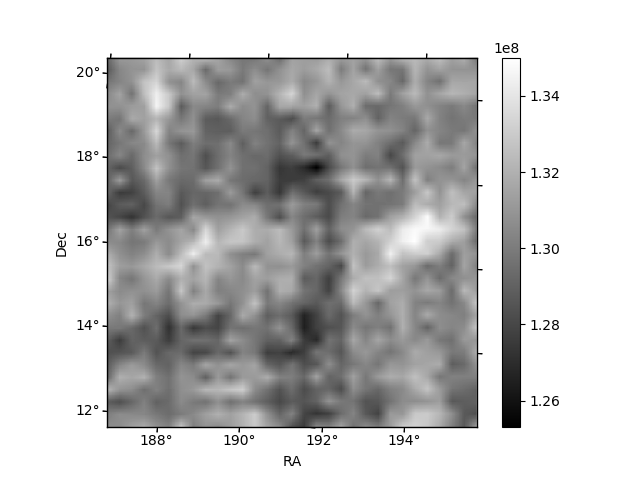
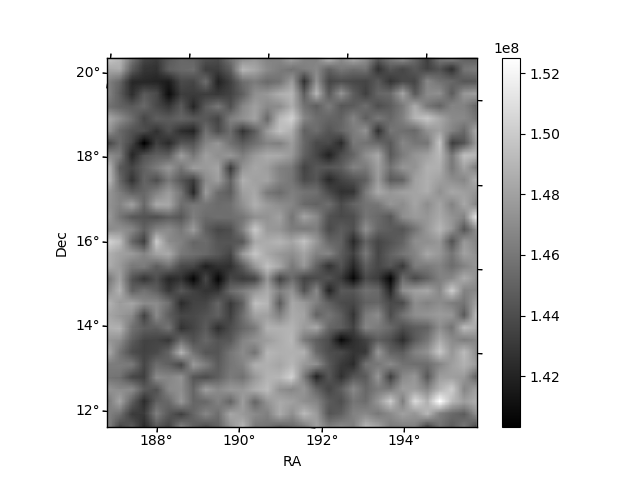
Histogram calculated using DETX and DETY for each event in the final _common_clean file
| Quadrant A |  |
 |
Quadrant B |
|---|---|---|---|
| Quadrant D | 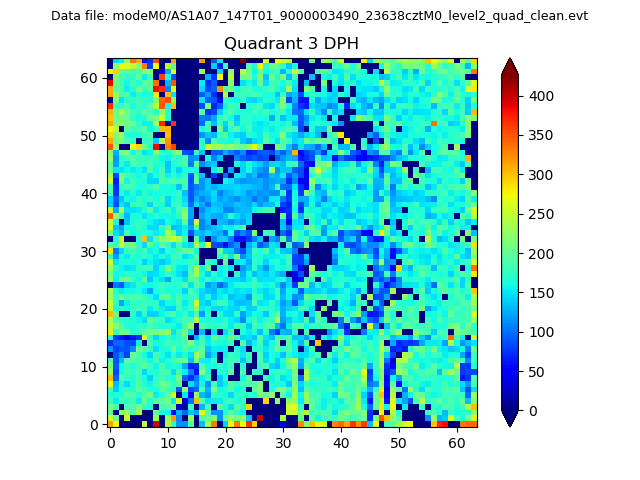 |
 |
Quadrant C |
| Plot type | Count rate plots | Images |
|---|---|---|
| Comparison with Poisson distribution Blue bars denote a histogram of data divided into 1 sec bins. Red curve is a Poisson curve with rate = median count rate of data. |
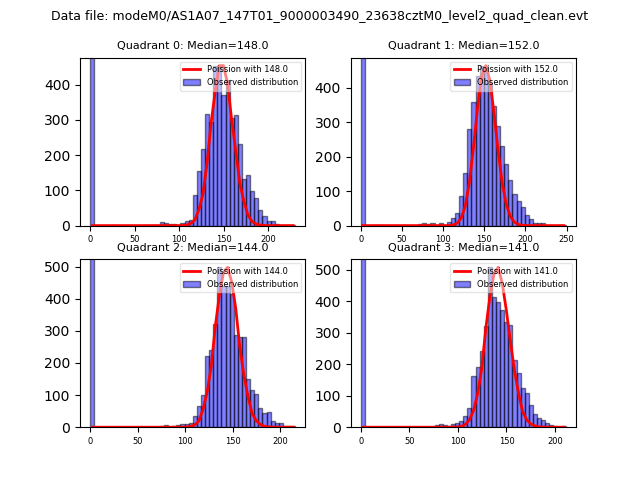 |
 |
| Quadrant-wise count rates Data is divided into 100 sec bins |
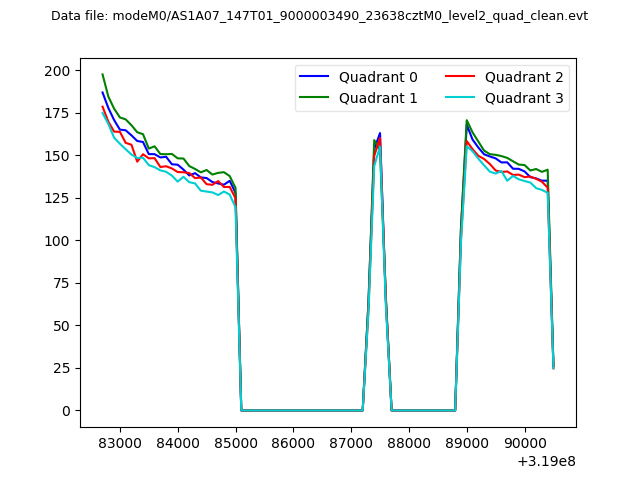 |
|
| Module-wise count rates for Quadrant A Data is divided into 100 sec bins |
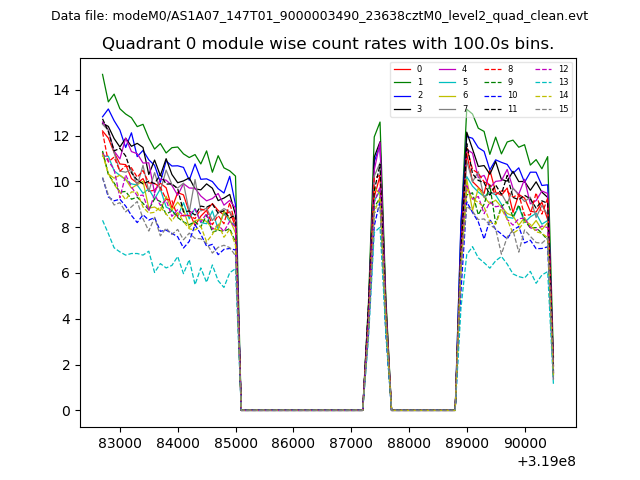 |
 |
| Module-wise count rates for Quadrant B Data is divided into 100 sec bins |
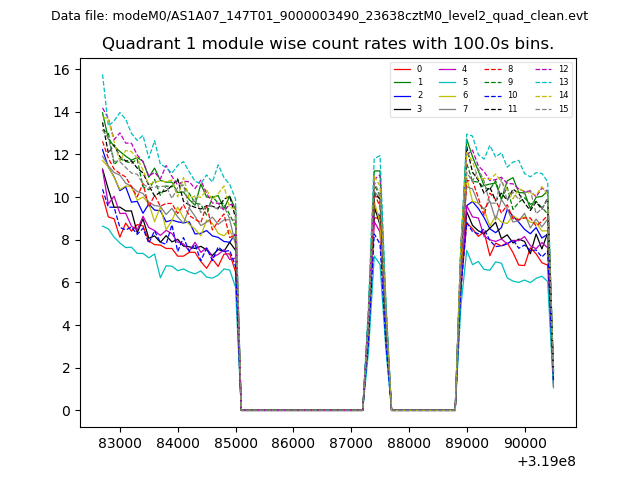 |
 |
| Module-wise count rates for Quadrant C Data is divided into 100 sec bins |
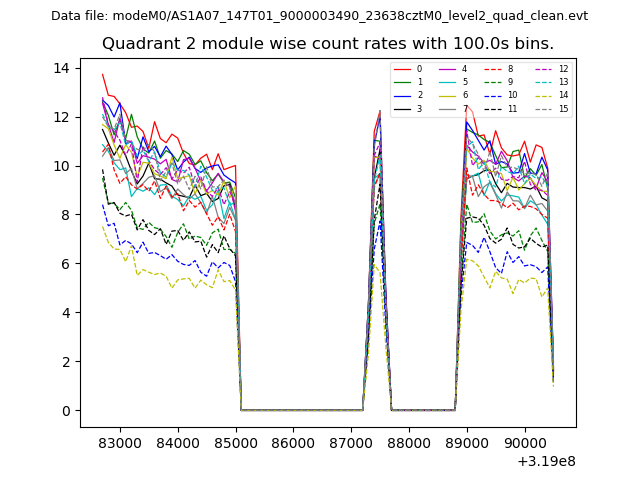 |
 |
| Module-wise count rates for Quadrant D Data is divided into 100 sec bins |
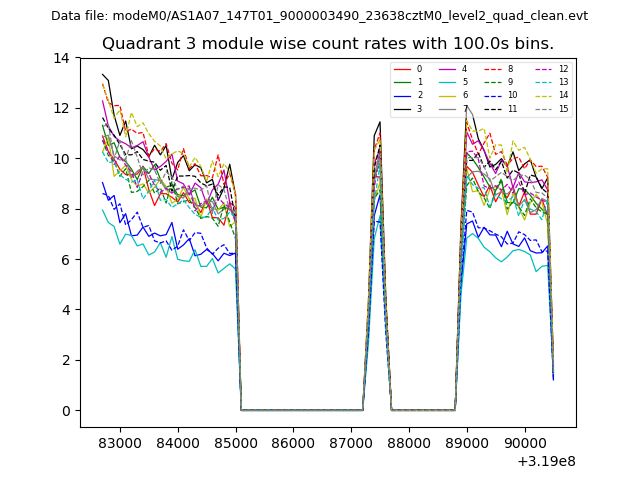 |
 |
| Parameter | Plot |
|---|---|
| CZT HV Monitor | 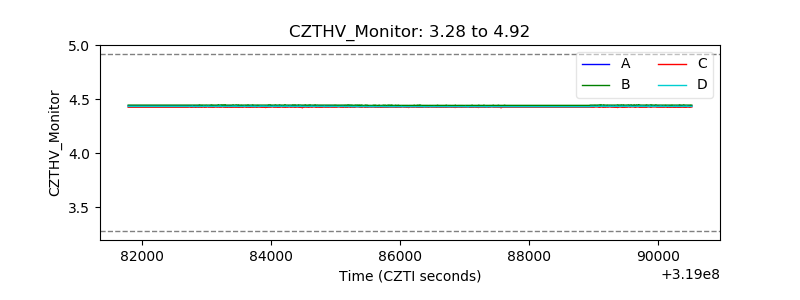 |
| D_VDD | 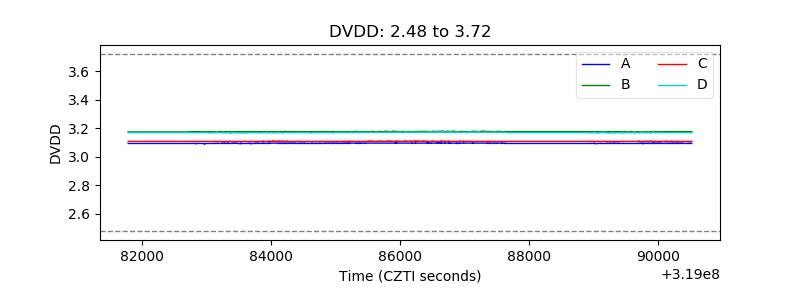 |
| Temperature 1 | 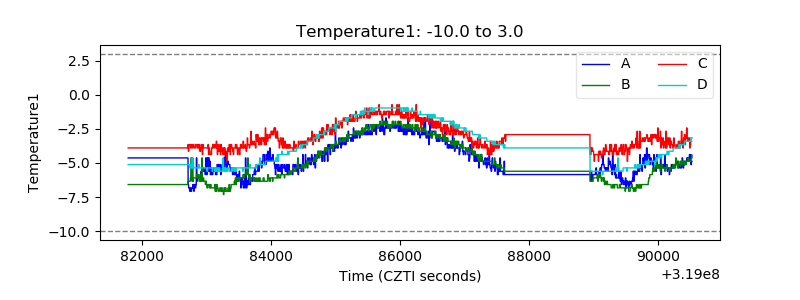 |
| Veto HV Monitor |  |
| Veto LLD | 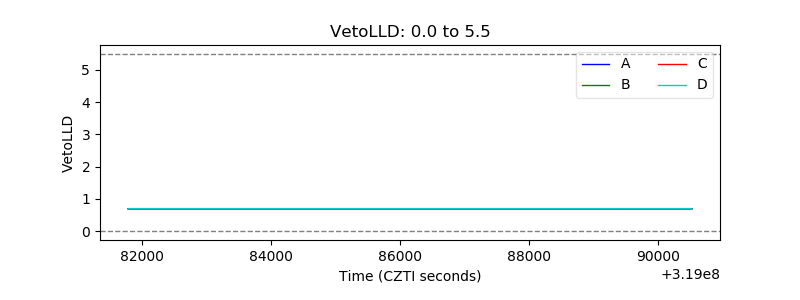 |
| Alpha Counter | 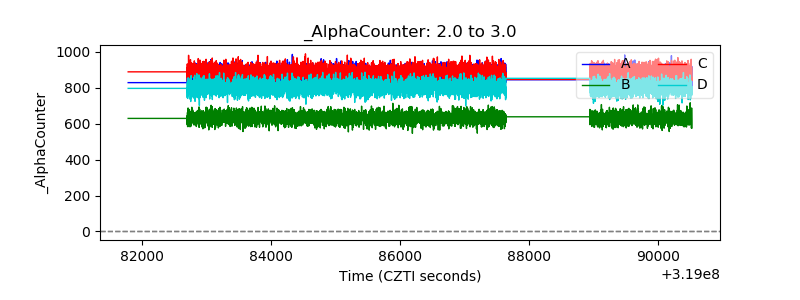 |
| _CPM_Rate | 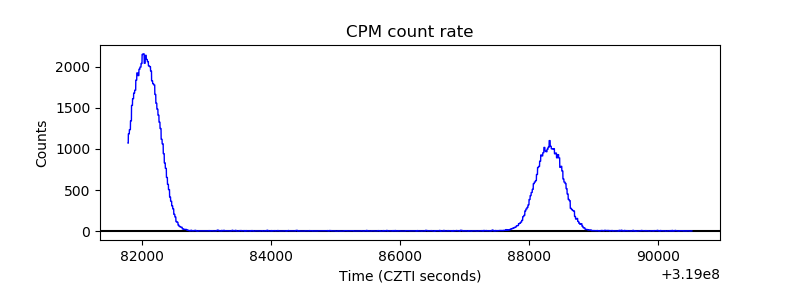 |
| CZT Counter | 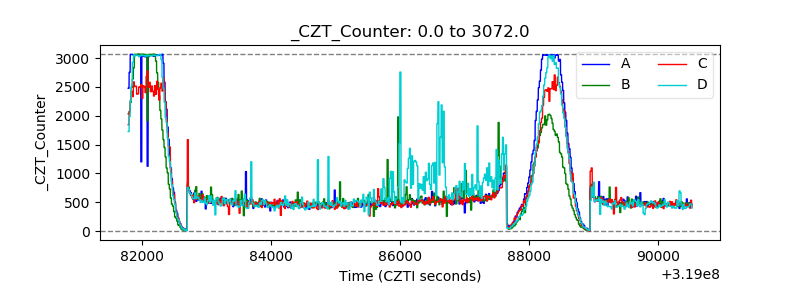 |
| +2.5 Volts monitor |  |
| +5 Volts monitor |  |
| _ROLL_ROT | 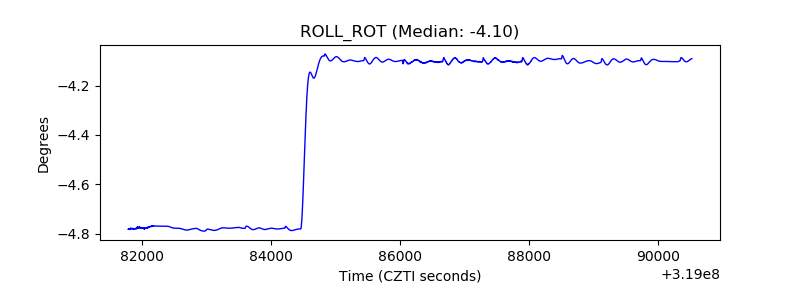 |
| _Roll_DEC | 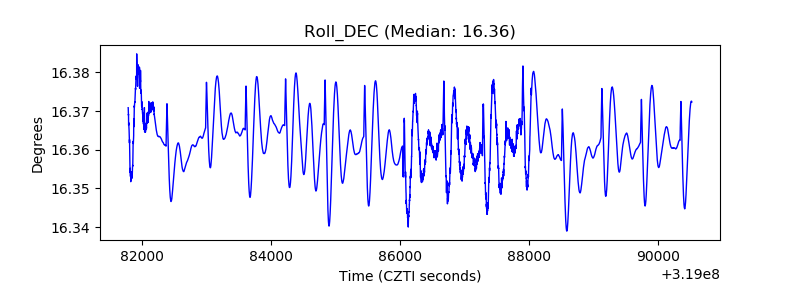 |
| _Roll_RA | 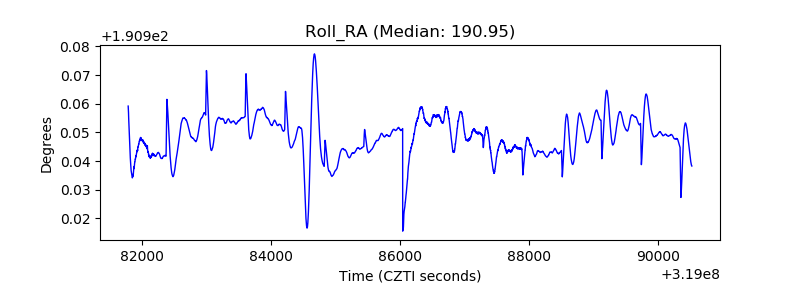 |
| Veto Counter | 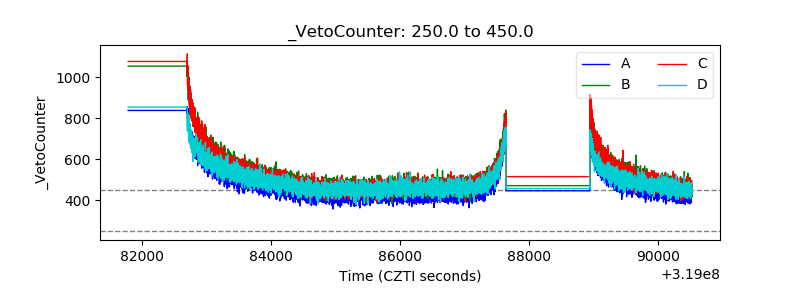 |