| Param | Original file | Final file |
|---|---|---|
| Filename | modeM0/AS1A07_147T01_9000003490_23641cztM0_level2.evt | modeM0/AS1A07_147T01_9000003490_23641cztM0_level2_quad_clean.evt |
| Size (bytes) | 513,768,960 | 85,743,360 |
| Size | 490.0 MB | 81.8 MB |
| Events in quadrant A | 3,403,511 | 531,871 |
| Events in quadrant B | 4,255,767 | 540,120 |
| Events in quadrant C | 3,418,062 | 522,984 |
| Events in quadrant D | 4,001,738 | 508,651 |
| Mode M9 | |||
|---|---|---|---|
| Quadrant | BADHDUFLAG | Total packets | Discarded packets |
| A | 0 | 4 | 0 |
| B | 0 | 4 | 0 |
| C | 0 | 4 | 0 |
| D | 0 | 4 | 0 |
| Mode SS | |||
|---|---|---|---|
| Quadrant | BADHDUFLAG | Total packets | Discarded packets |
| A | 0 | 142 | 0 |
| B | 0 | 142 | 0 |
| C | 0 | 142 | 0 |
| D | 0 | 142 | 0 |
| Mode M0 | |||
|---|---|---|---|
| Quadrant | BADHDUFLAG | Total packets | Discarded packets |
| A | 0 | 14592 | 1 |
| B | 0 | 17039 | 1 |
| C | 0 | 14582 | 1 |
| D | 0 | 16634 | 1 |
| Quadrant | Total seconds | Saturated seconds | Saturation percentage |
|---|---|---|---|
| A | 7078 | 137 | 1.935575% |
| B | 7078 | 306 | 4.323255% |
| C | 7078 | 173 | 2.444193% |
| D | 7078 | 240 | 3.390788% |
Noise dominated data is calculated using 1-second bins in cleaned event files. If a bin has >2000 counts, and if more than 50% of those come from <1% of pixels, then it is considered to be noise-dominated and hence unusable.
| Quadrant | # 1 sec bins | Bins with >0 counts | Bins with >2000 counts | High rate bins dominated by noise | Noise dominated (total time) | Noise dominated (detector-on time) | Marked lightcurve |
|---|---|---|---|---|---|---|---|
| A | 7403 | 7078 | 0 | 0 | 0.00% | 0.00% | 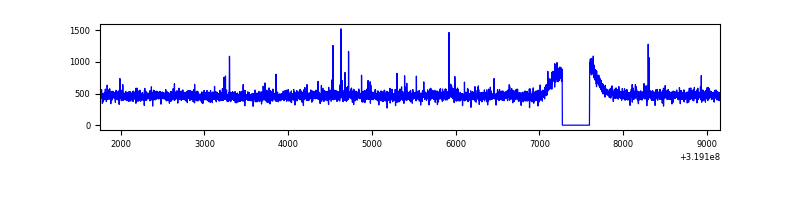 |
| B | 7403 | 7078 | 115 | 115 | 1.55% | 1.62% | 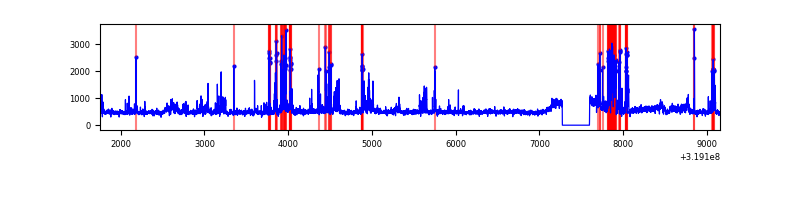 |
| C | 7403 | 7078 | 2 | 2 | 0.03% | 0.03% | 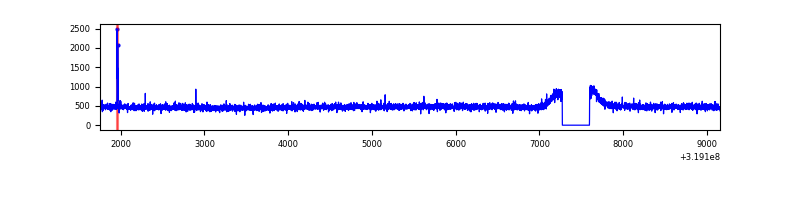 |
| D | 7403 | 7078 | 133 | 133 | 1.80% | 1.88% | 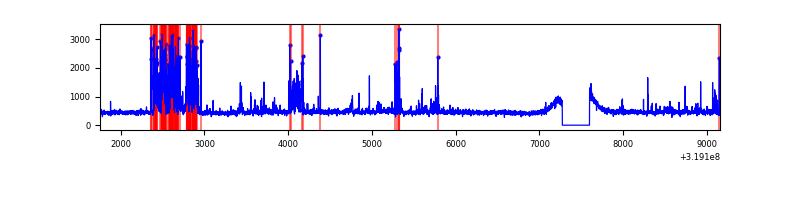 |
Top three noisy pixels from each quadrant. If the there are fewer than three noisy pixels in the level2.evt file, extra rows are filled as -1
| Pixel properties | Quadrant properties | ||||||
|---|---|---|---|---|---|---|---|
| Quadrant | DetID | PixID | Counts | Sigma | Mean | Median | Sigma |
| A | 12 | 96 | 26973 | 146.38 | 876 | 856 | 178.4 |
| A | 13 | 254 | 11443 | 59.34 | 876 | 856 | 178.4 |
| A | 3 | 137 | 8023 | 40.17 | 876 | 856 | 178.4 |
| B | 3 | 64 | 343739 | 2037.57 | 861 | 839 | 168.3 |
| B | 0 | 229 | 271979 | 1611.16 | 861 | 839 | 168.3 |
| B | 0 | 189 | 205228 | 1214.51 | 861 | 839 | 168.3 |
| C | 14 | 238 | 131508 | 662.35 | 836 | 842 | 197.3 |
| C | 10 | 9 | 14750 | 70.5 | 836 | 842 | 197.3 |
| C | 13 | 61 | 5928 | 25.78 | 836 | 842 | 197.3 |
| D | 12 | 233 | 740728 | 3584.35 | 846 | 821 | 206.4 |
| D | 2 | 234 | 28904 | 136.04 | 846 | 821 | 206.4 |
| D | 1 | 52 | 22659 | 105.79 | 846 | 821 | 206.4 |
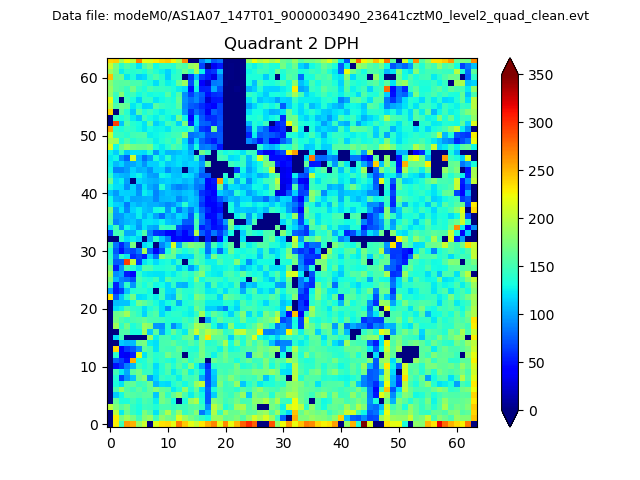
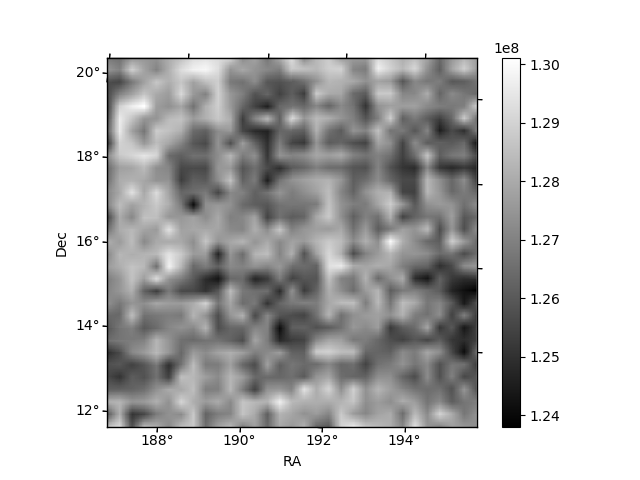
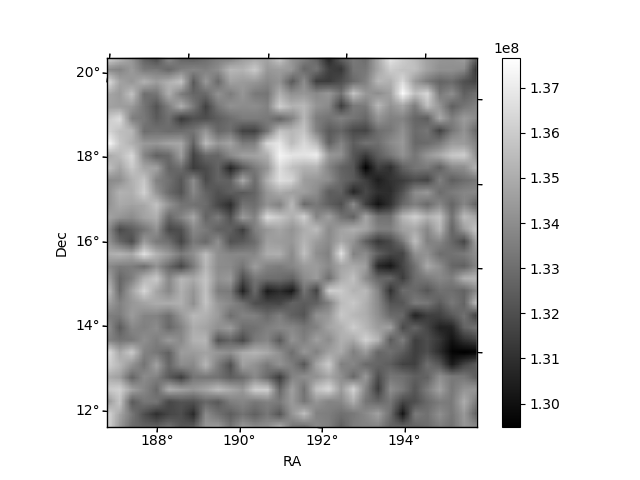
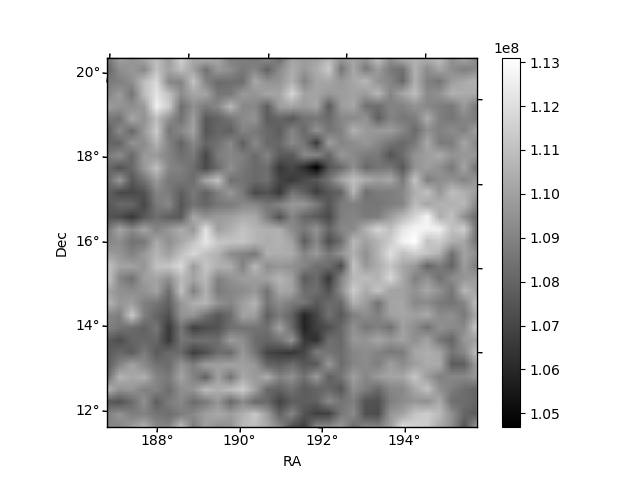
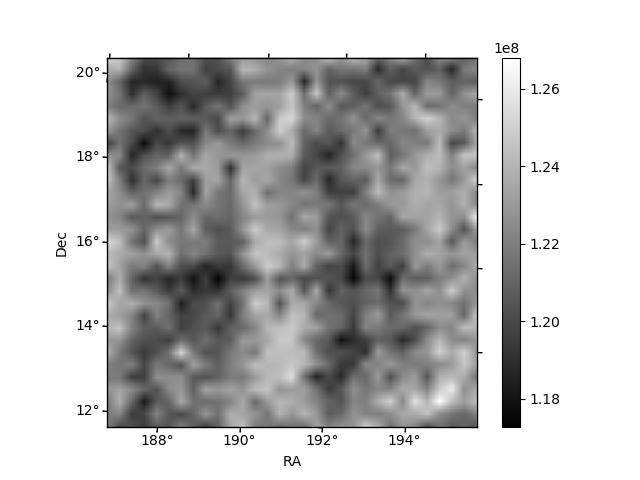
Histogram calculated using DETX and DETY for each event in the final _common_clean file
| Quadrant A |  |
 |
Quadrant B |
|---|---|---|---|
| Quadrant D | 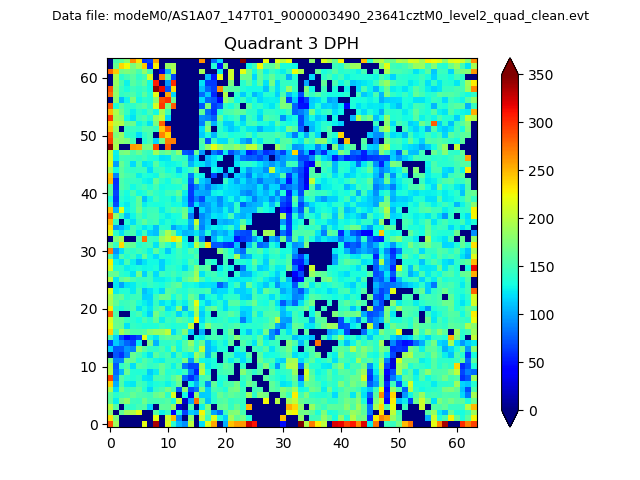 |
 |
Quadrant C |
| Plot type | Count rate plots | Images |
|---|---|---|
| Comparison with Poisson distribution Blue bars denote a histogram of data divided into 1 sec bins. Red curve is a Poisson curve with rate = median count rate of data. |
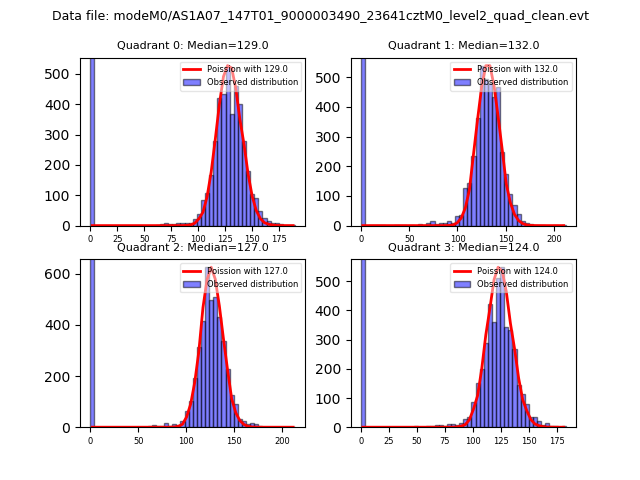 |
 |
| Quadrant-wise count rates Data is divided into 100 sec bins |
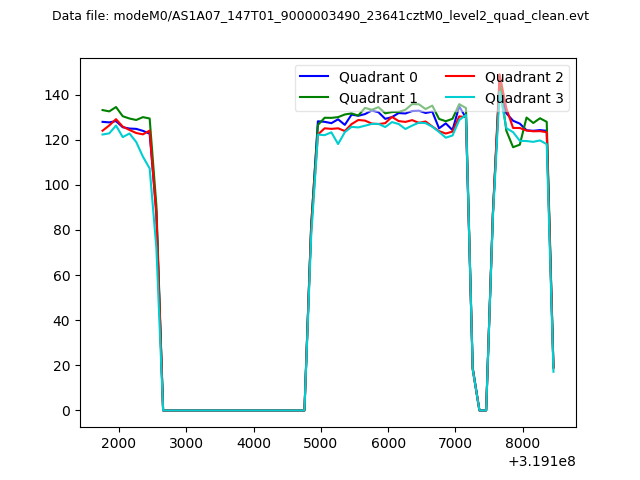 |
|
| Module-wise count rates for Quadrant A Data is divided into 100 sec bins |
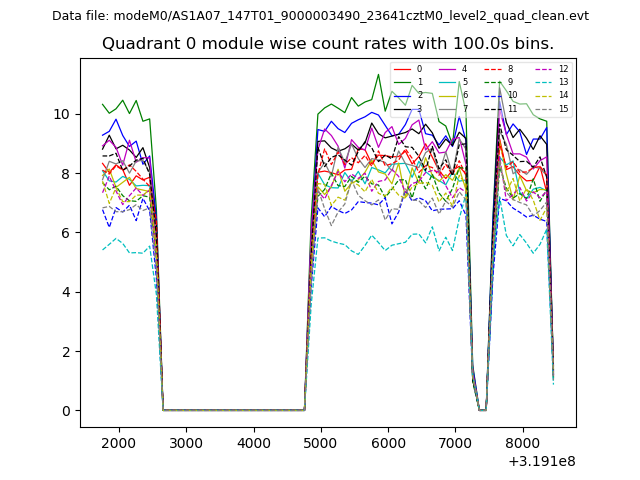 |
 |
| Module-wise count rates for Quadrant B Data is divided into 100 sec bins |
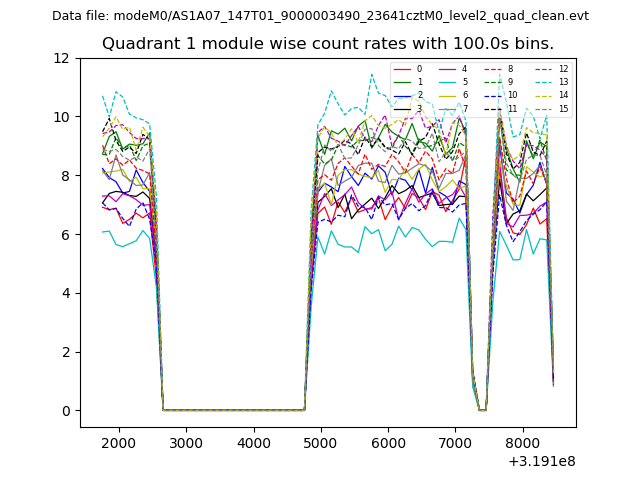 |
 |
| Module-wise count rates for Quadrant C Data is divided into 100 sec bins |
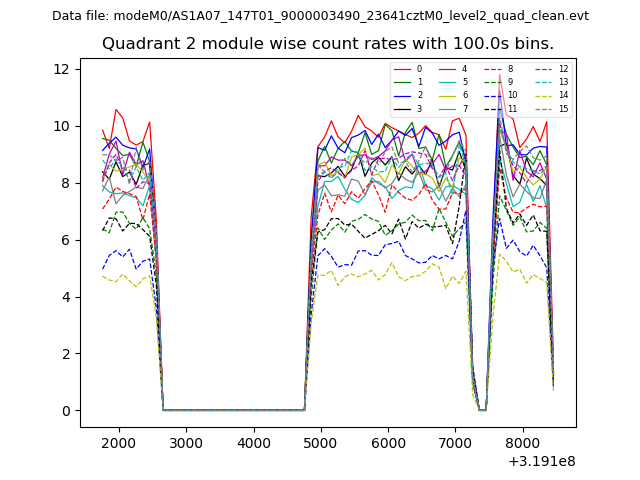 |
 |
| Module-wise count rates for Quadrant D Data is divided into 100 sec bins |
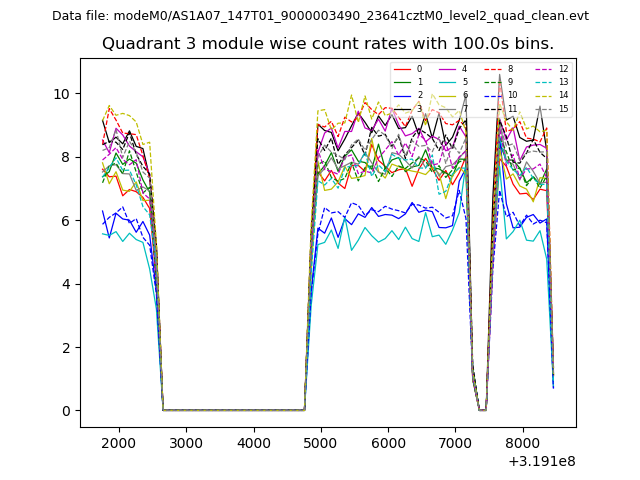 |
 |
| Parameter | Plot |
|---|---|
| CZT HV Monitor | 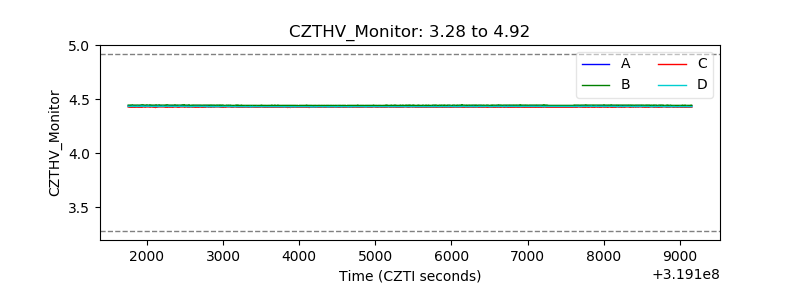 |
| D_VDD | 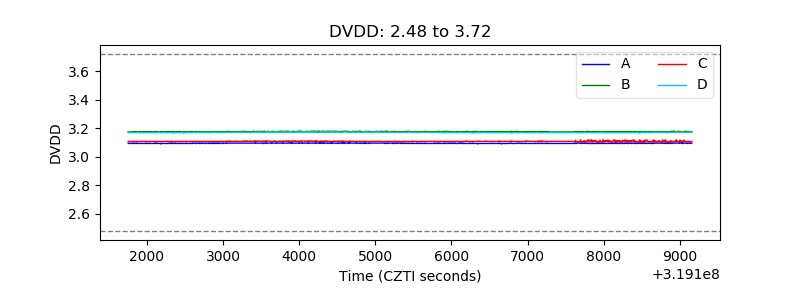 |
| Temperature 1 | 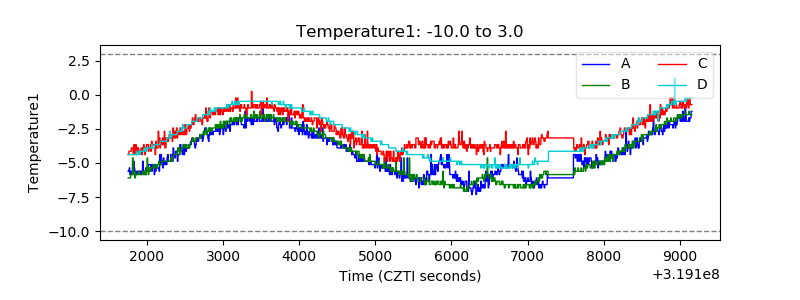 |
| Veto HV Monitor |  |
| Veto LLD | 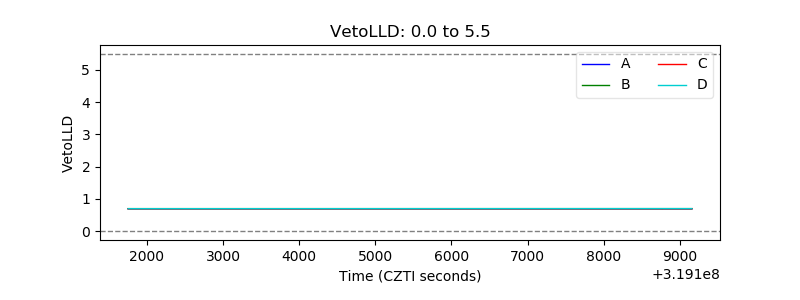 |
| Alpha Counter | 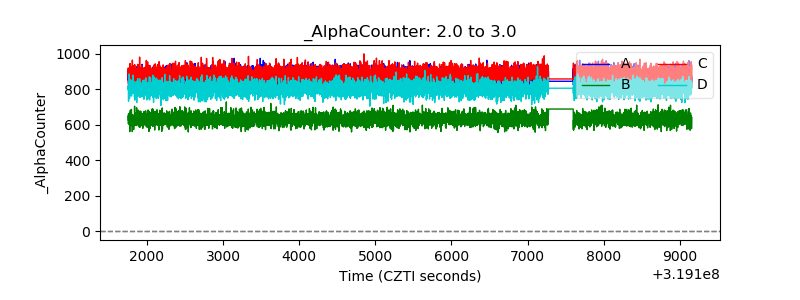 |
| _CPM_Rate |  |
| CZT Counter | 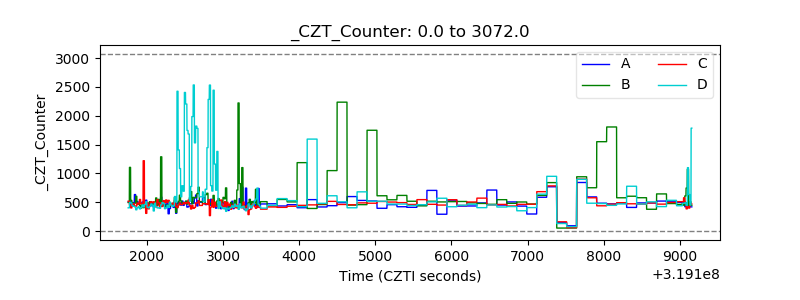 |
| +2.5 Volts monitor | 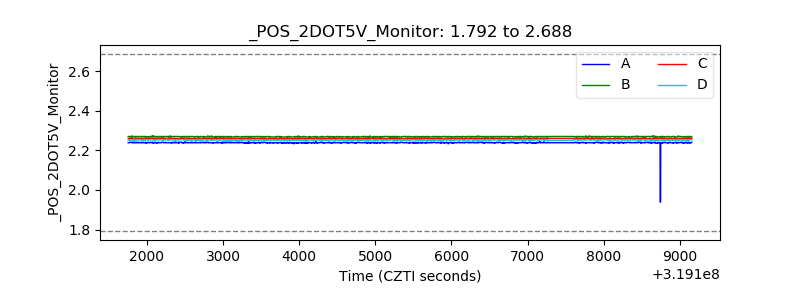 |
| +5 Volts monitor | 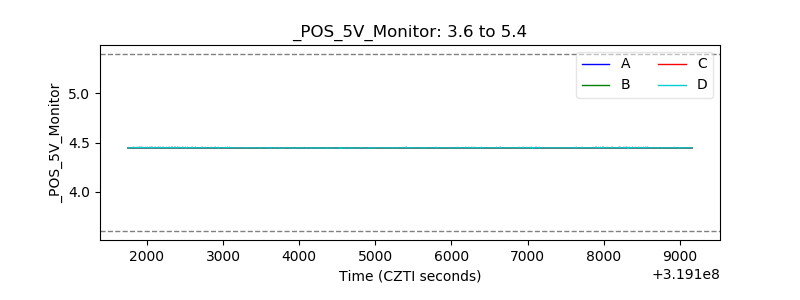 |
| _ROLL_ROT | 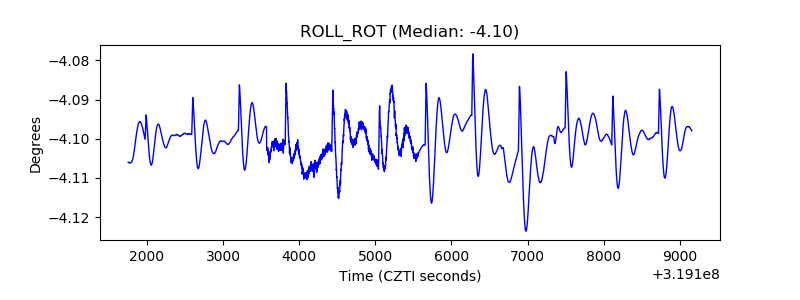 |
| _Roll_DEC |  |
| _Roll_RA | 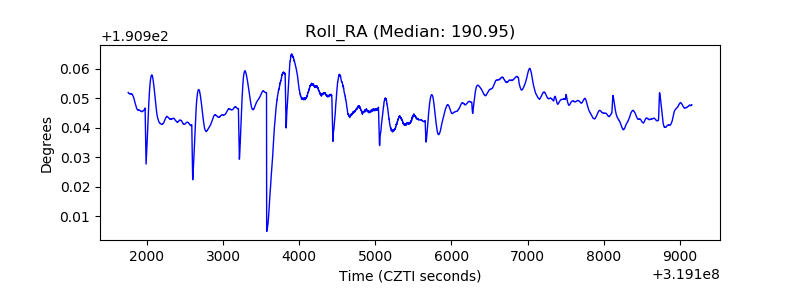 |
| Veto Counter | 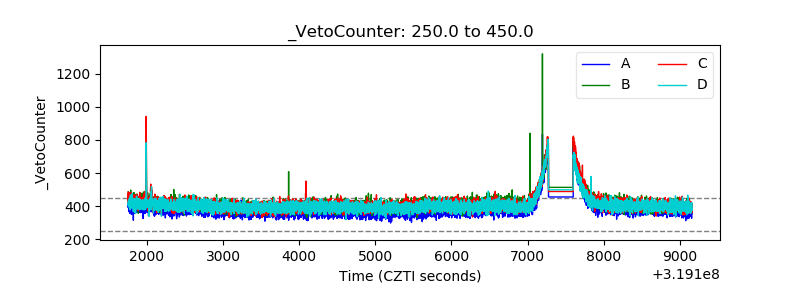 |