| Param | Original file | Final file |
|---|---|---|
| Filename | modeM0/AS1A07_147T01_9000003490_23645cztM0_level2.evt | modeM0/AS1A07_147T01_9000003490_23645cztM0_level2_quad_clean.evt |
| Size (bytes) | 936,527,040 | 148,014,720 |
| Size | 893.1 MB | 141.2 MB |
| Events in quadrant A | 6,008,545 | 915,380 |
| Events in quadrant B | 7,770,967 | 911,969 |
| Events in quadrant C | 6,134,913 | 893,793 |
| Events in quadrant D | 7,585,599 | 880,100 |
| Mode M9 | |||
|---|---|---|---|
| Quadrant | BADHDUFLAG | Total packets | Discarded packets |
| A | 0 | 13 | 0 |
| B | 0 | 13 | 0 |
| C | 0 | 13 | 0 |
| D | 0 | 13 | 0 |
| Mode SS | |||
|---|---|---|---|
| Quadrant | BADHDUFLAG | Total packets | Discarded packets |
| A | 0 | 260 | 0 |
| B | 0 | 260 | 0 |
| C | 0 | 260 | 0 |
| D | 0 | 260 | 0 |
| Mode M0 | |||
|---|---|---|---|
| Quadrant | BADHDUFLAG | Total packets | Discarded packets |
| A | 0 | 26052 | 3 |
| B | 0 | 31140 | 3 |
| C | 0 | 26158 | 3 |
| D | 0 | 31044 | 3 |
| Quadrant | Total seconds | Saturated seconds | Saturation percentage |
|---|---|---|---|
| A | 12750 | 105 | 0.823529% |
| B | 12750 | 556 | 4.360784% |
| C | 12750 | 165 | 1.294118% |
| D | 12750 | 281 | 2.203922% |
Noise dominated data is calculated using 1-second bins in cleaned event files. If a bin has >2000 counts, and if more than 50% of those come from <1% of pixels, then it is considered to be noise-dominated and hence unusable.
| Quadrant | # 1 sec bins | Bins with >0 counts | Bins with >2000 counts | High rate bins dominated by noise | Noise dominated (total time) | Noise dominated (detector-on time) | Marked lightcurve |
|---|---|---|---|---|---|---|---|
| A | 14095 | 12750 | 0 | 0 | 0.00% | 0.00% | 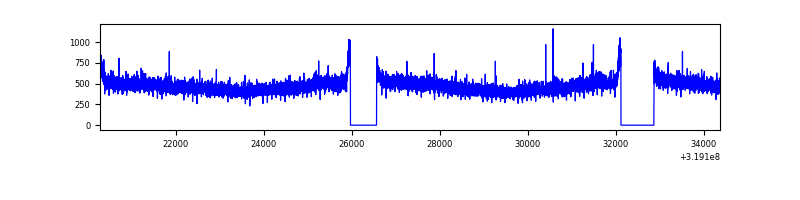 |
| B | 14095 | 12750 | 330 | 330 | 2.34% | 2.59% | 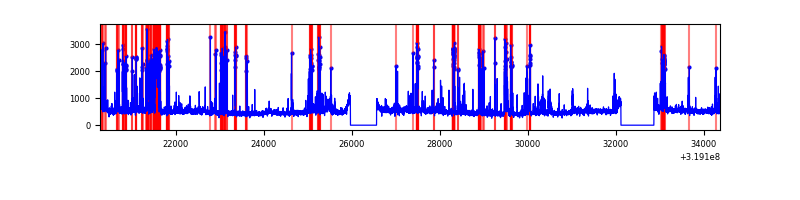 |
| C | 14095 | 12750 | 0 | 0 | 0.00% | 0.00% | 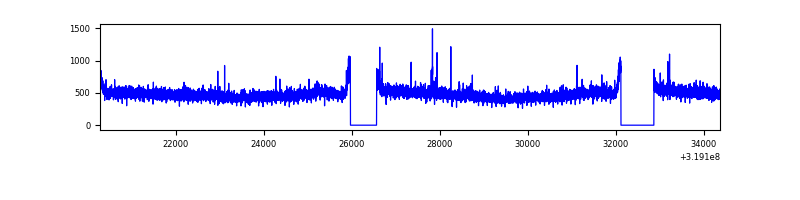 |
| D | 14095 | 12750 | 173 | 173 | 1.23% | 1.36% | 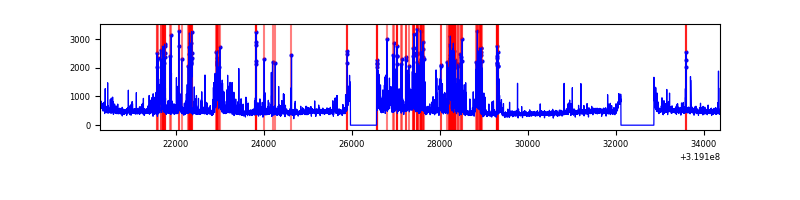 |
Top three noisy pixels from each quadrant. If the there are fewer than three noisy pixels in the level2.evt file, extra rows are filled as -1
| Pixel properties | Quadrant properties | ||||||
|---|---|---|---|---|---|---|---|
| Quadrant | DetID | PixID | Counts | Sigma | Mean | Median | Sigma |
| A | 13 | 254 | 21345 | 62.73 | 1557 | 1523 | 316.0 |
| A | 3 | 137 | 14054 | 39.66 | 1557 | 1523 | 316.0 |
| A | 0 | 226 | 13379 | 37.52 | 1557 | 1523 | 316.0 |
| B | 3 | 64 | 1302008 | 4441.94 | 1524 | 1486 | 292.8 |
| B | 0 | 229 | 210990 | 715.56 | 1524 | 1486 | 292.8 |
| B | 5 | 172 | 114287 | 385.27 | 1524 | 1486 | 292.8 |
| C | 14 | 238 | 234892 | 664.58 | 1495 | 1505 | 351.2 |
| C | 7 | 247 | 30435 | 82.38 | 1495 | 1505 | 351.2 |
| C | 0 | 207 | 20392 | 53.78 | 1495 | 1505 | 351.2 |
| D | 1 | 52 | 826503 | 2219.74 | 1512 | 1466 | 371.7 |
| D | 9 | 85 | 632988 | 1699.09 | 1512 | 1466 | 371.7 |
| D | 12 | 233 | 261632 | 699.97 | 1512 | 1466 | 371.7 |
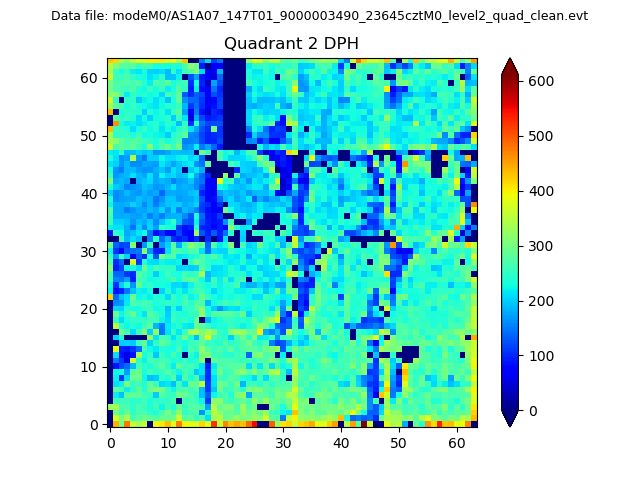
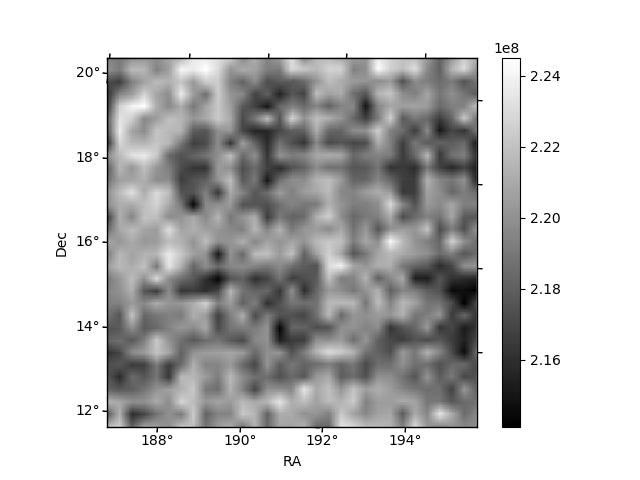
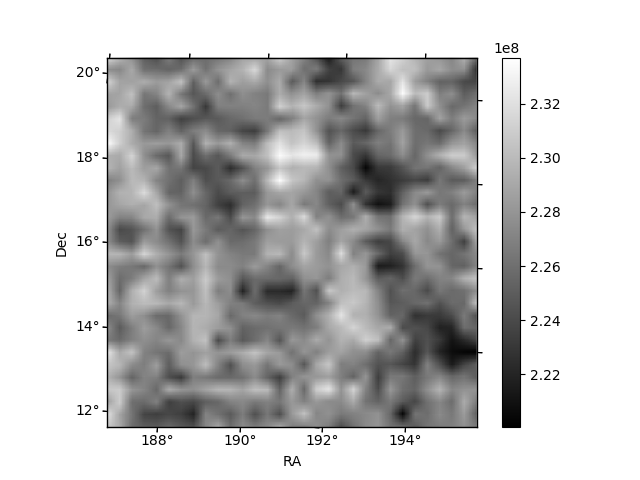
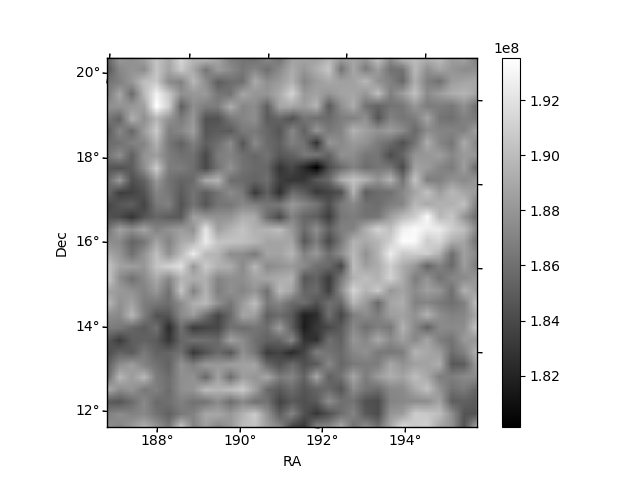
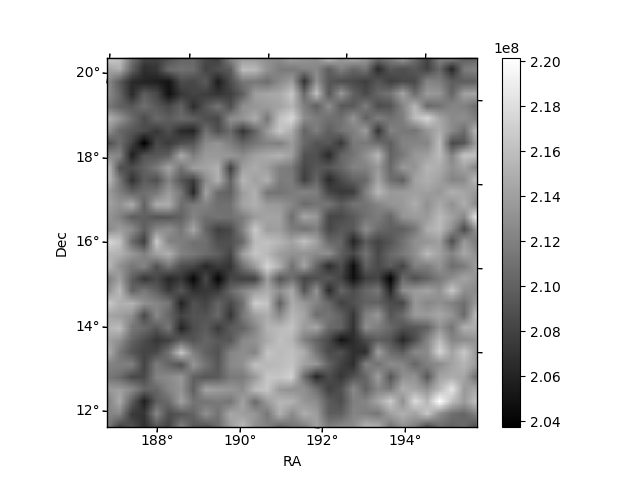
Histogram calculated using DETX and DETY for each event in the final _common_clean file
| Quadrant A | 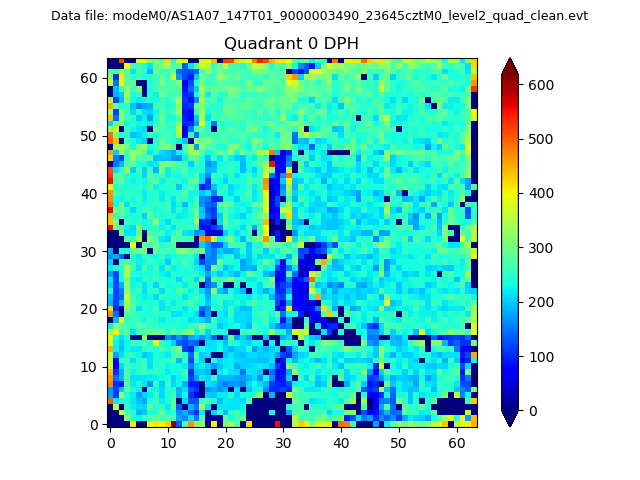 |
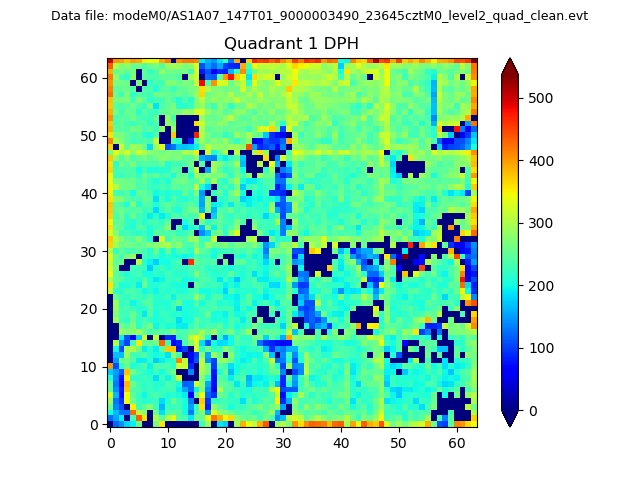 |
Quadrant B |
|---|---|---|---|
| Quadrant D | 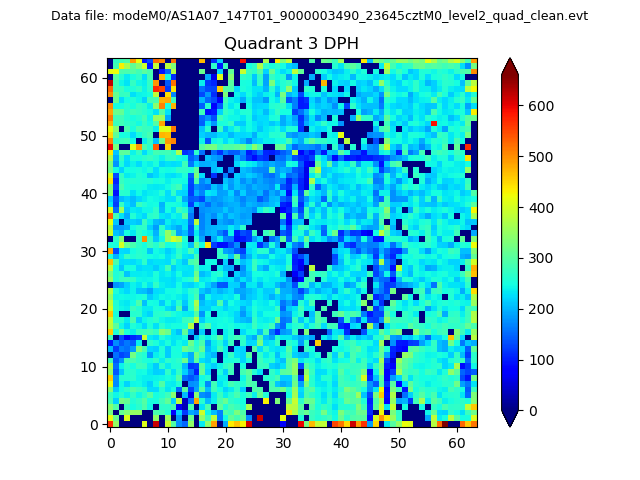 |
 |
Quadrant C |
| Plot type | Count rate plots | Images |
|---|---|---|
| Comparison with Poisson distribution Blue bars denote a histogram of data divided into 1 sec bins. Red curve is a Poisson curve with rate = median count rate of data. |
 |
 |
| Quadrant-wise count rates Data is divided into 100 sec bins |
 |
|
| Module-wise count rates for Quadrant A Data is divided into 100 sec bins |
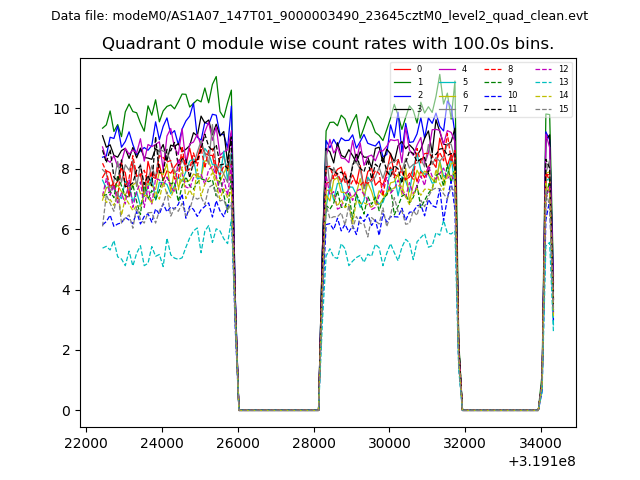 |
 |
| Module-wise count rates for Quadrant B Data is divided into 100 sec bins |
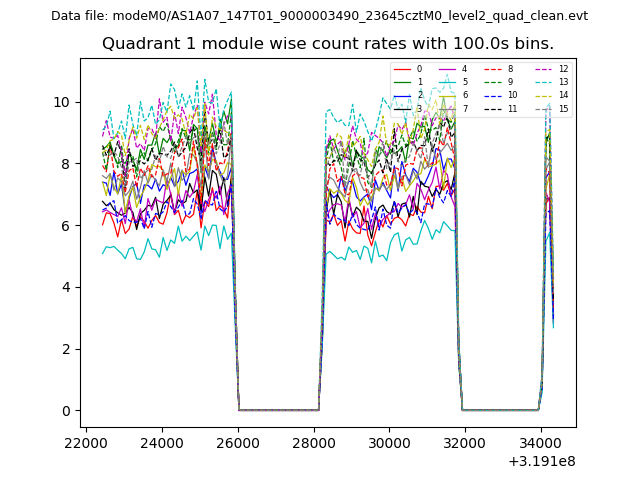 |
 |
| Module-wise count rates for Quadrant C Data is divided into 100 sec bins |
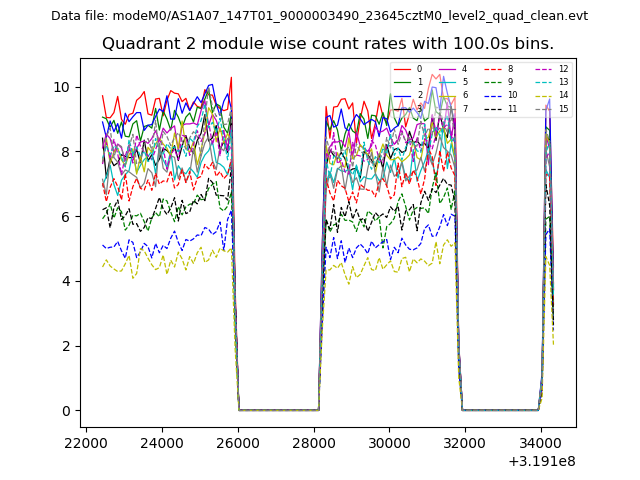 |
 |
| Module-wise count rates for Quadrant D Data is divided into 100 sec bins |
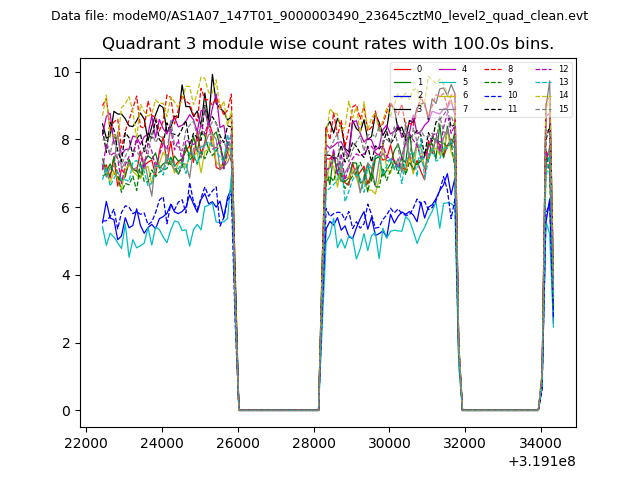 |
 |
| Parameter | Plot |
|---|---|
| CZT HV Monitor | 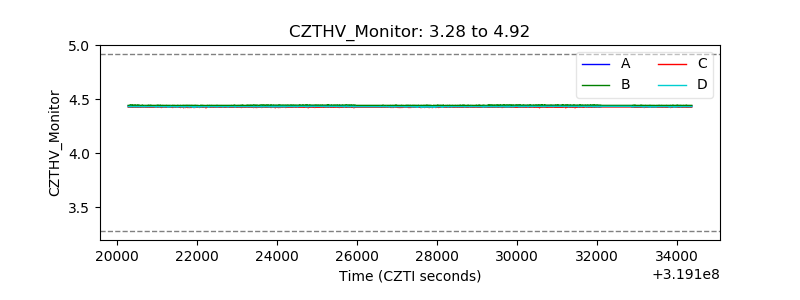 |
| D_VDD | 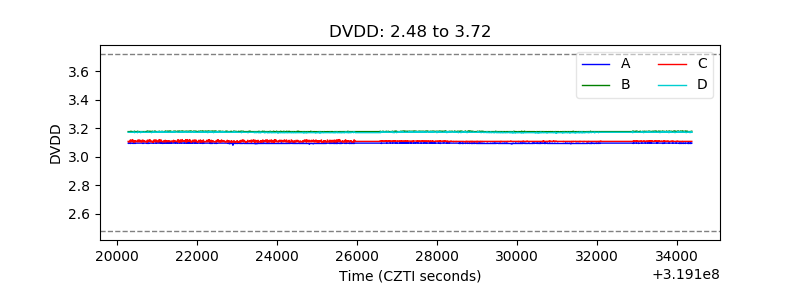 |
| Temperature 1 | 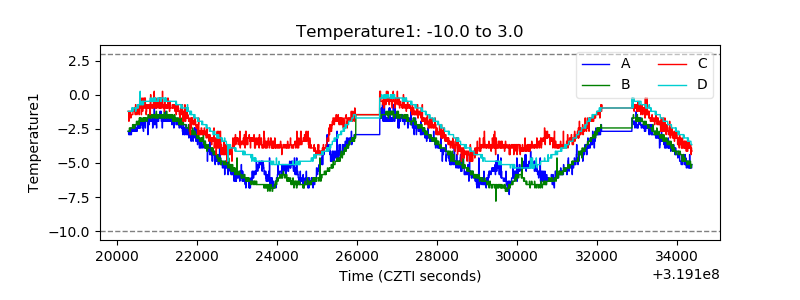 |
| Veto HV Monitor | 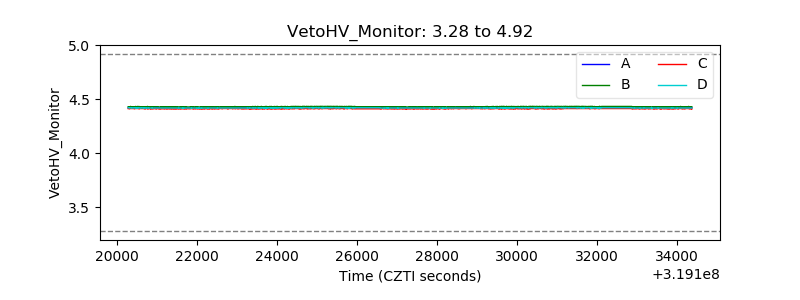 |
| Veto LLD | 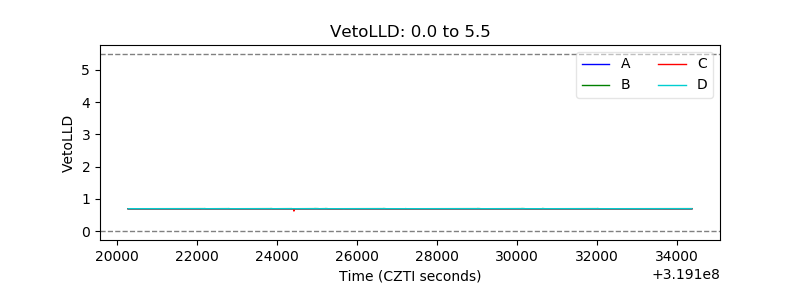 |
| Alpha Counter |  |
| _CPM_Rate | 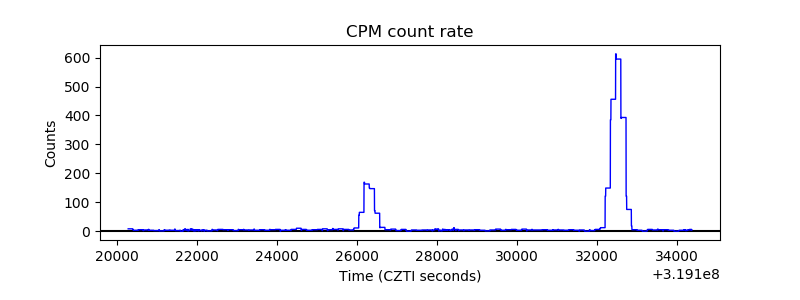 |
| CZT Counter | 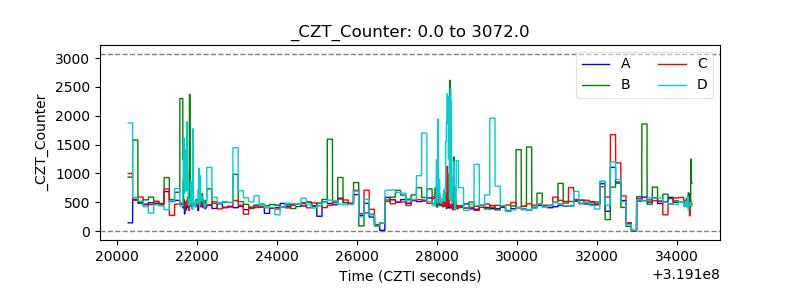 |
| +2.5 Volts monitor |  |
| +5 Volts monitor |  |
| _ROLL_ROT | 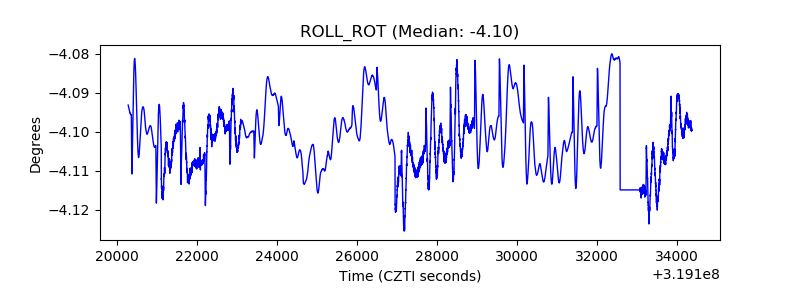 |
| _Roll_DEC | 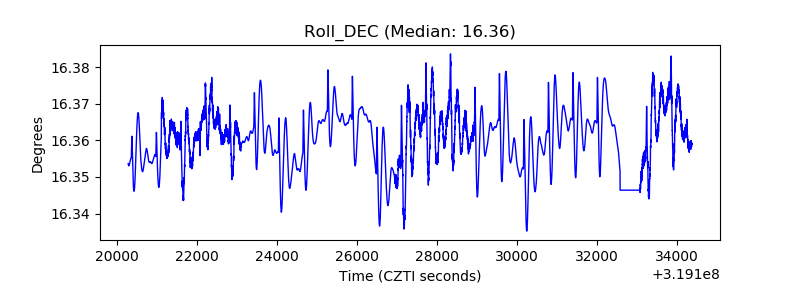 |
| _Roll_RA | 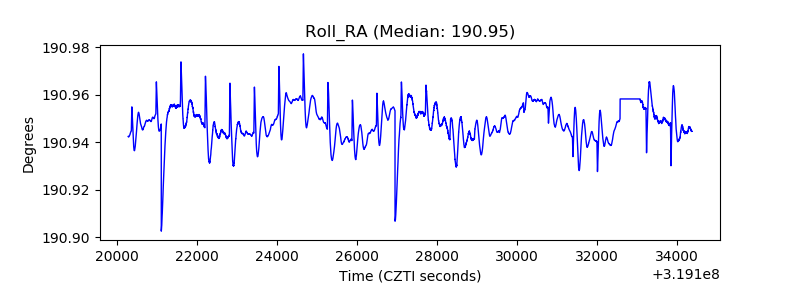 |
| Veto Counter | 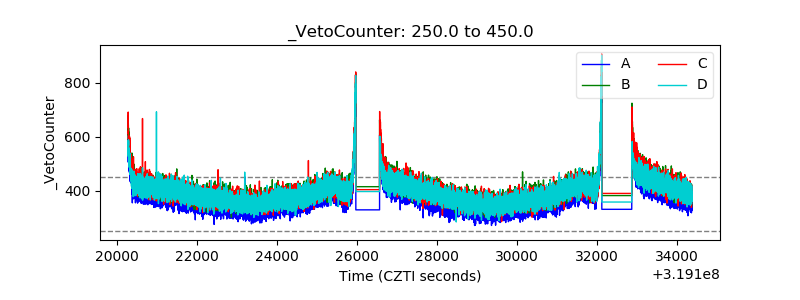 |