| Param | Original file | Final file |
|---|---|---|
| Filename | modeM0/AS1A07_147T01_9000003490_23646cztM0_level2.evt | modeM0/AS1A07_147T01_9000003490_23646cztM0_level2_quad_clean.evt |
| Size (bytes) | 812,753,280 | 149,785,920 |
| Size | 775.1 MB | 142.8 MB |
| Events in quadrant A | 5,143,371 | 965,008 |
| Events in quadrant B | 7,433,523 | 944,764 |
| Events in quadrant C | 5,300,982 | 944,494 |
| Events in quadrant D | 6,000,463 | 929,495 |
| Mode M9 | |||
|---|---|---|---|
| Quadrant | BADHDUFLAG | Total packets | Discarded packets |
| A | 0 | 22 | 2 |
| B | 0 | 22 | 1 |
| C | 0 | 21 | 1 |
| D | 0 | 22 | 2 |
| Mode SS | |||
|---|---|---|---|
| Quadrant | BADHDUFLAG | Total packets | Discarded packets |
| A | 0 | 233 | 11 |
| B | 0 | 234 | 10 |
| C | 0 | 235 | 11 |
| D | 0 | 234 | 12 |
| Mode M0 | |||
|---|---|---|---|
| Quadrant | BADHDUFLAG | Total packets | Discarded packets |
| A | 0 | 23595 | 1166 |
| B | 0 | 30579 | 1499 |
| C | 0 | 23859 | 1191 |
| D | 0 | 26487 | 1249 |
| Quadrant | Total seconds | Saturated seconds | Saturation percentage |
|---|---|---|---|
| A | 10878 | 133 | 1.222651% |
| B | 10871 | 814 | 7.487812% |
| C | 10867 | 211 | 1.941658% |
| D | 10867 | 217 | 1.996871% |
Noise dominated data is calculated using 1-second bins in cleaned event files. If a bin has >2000 counts, and if more than 50% of those come from <1% of pixels, then it is considered to be noise-dominated and hence unusable.
| Quadrant | # 1 sec bins | Bins with >0 counts | Bins with >2000 counts | High rate bins dominated by noise | Noise dominated (total time) | Noise dominated (detector-on time) | Marked lightcurve |
|---|---|---|---|---|---|---|---|
| A | 28949 | 10907 | 0 | 0 | 0.00% | 0.00% | 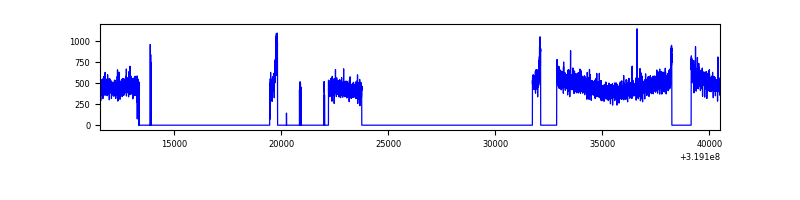 |
| B | 28948 | 10895 | 459 | 459 | 1.59% | 4.21% | 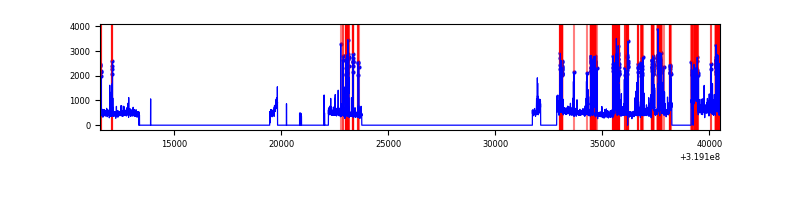 |
| C | 28948 | 10899 | 4 | 4 | 0.01% | 0.04% | 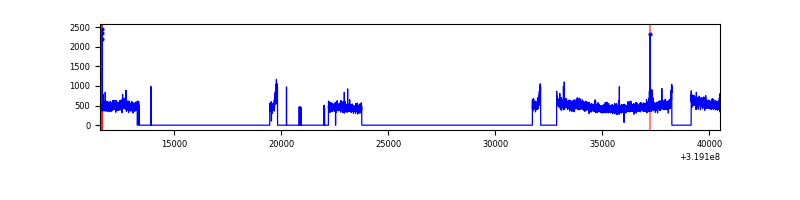 |
| D | 28948 | 10893 | 73 | 73 | 0.25% | 0.67% | 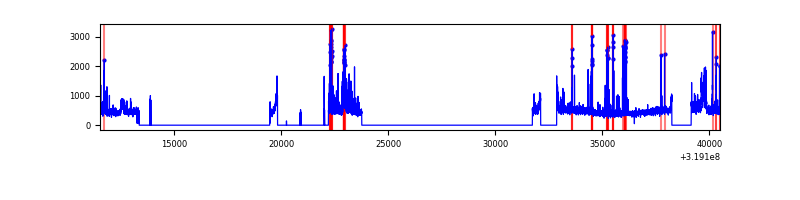 |
Top three noisy pixels from each quadrant. If the there are fewer than three noisy pixels in the level2.evt file, extra rows are filled as -1
| Pixel properties | Quadrant properties | ||||||
|---|---|---|---|---|---|---|---|
| Quadrant | DetID | PixID | Counts | Sigma | Mean | Median | Sigma |
| A | 13 | 254 | 18707 | 64.14 | 1333 | 1303 | 271.3 |
| A | 3 | 137 | 12358 | 40.74 | 1333 | 1303 | 271.3 |
| A | 0 | 226 | 11409 | 37.24 | 1333 | 1303 | 271.3 |
| B | 3 | 64 | 2024712 | 8119.6 | 1295 | 1262 | 249.2 |
| B | 5 | 172 | 108283 | 429.45 | 1295 | 1262 | 249.2 |
| B | 0 | 229 | 71928 | 283.56 | 1295 | 1262 | 249.2 |
| C | 14 | 238 | 200006 | 656.86 | 1287 | 1297 | 302.5 |
| C | 7 | 247 | 31165 | 98.73 | 1287 | 1297 | 302.5 |
| C | 10 | 91 | 20894 | 64.78 | 1287 | 1297 | 302.5 |
| D | 1 | 52 | 387398 | 1230.12 | 1299 | 1264 | 313.9 |
| D | 9 | 85 | 298638 | 947.35 | 1299 | 1264 | 313.9 |
| D | 7 | 238 | 180978 | 572.52 | 1299 | 1264 | 313.9 |
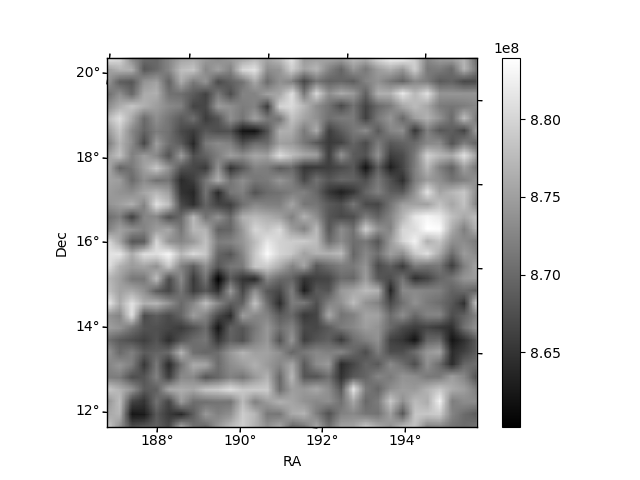
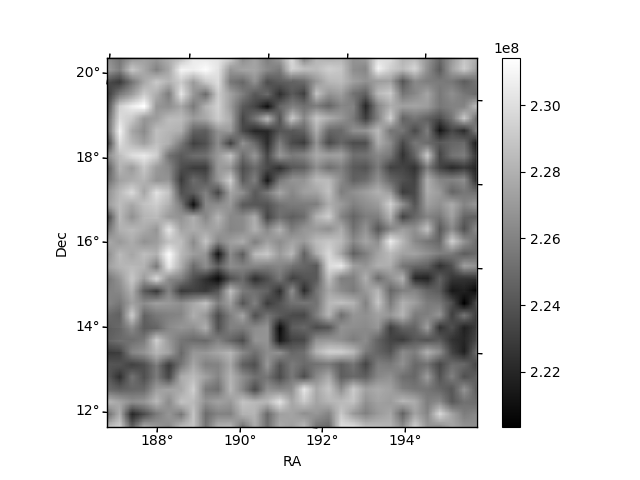
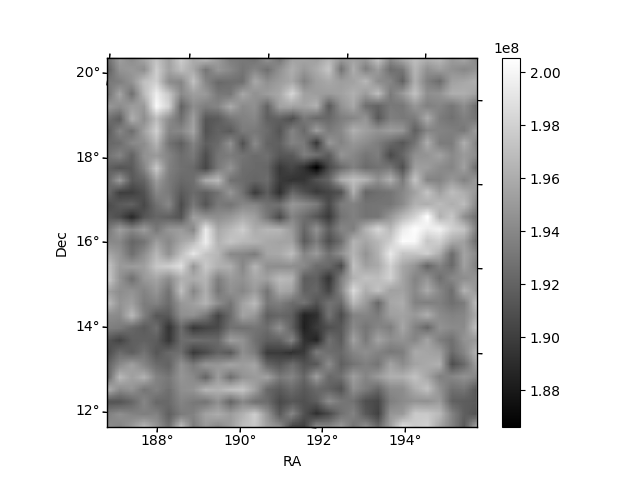
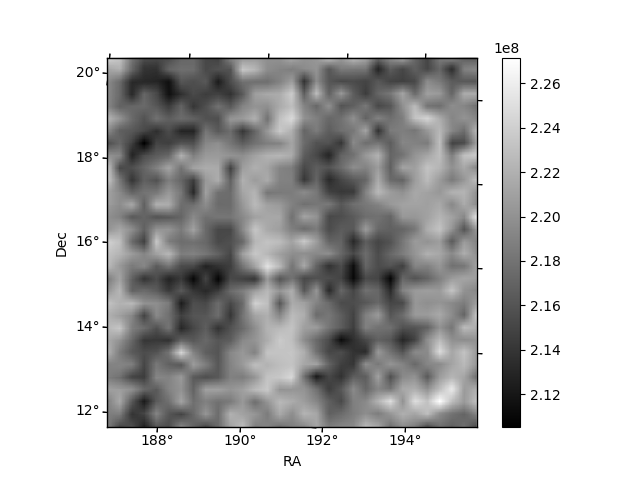
Histogram calculated using DETX and DETY for each event in the final _common_clean file
| Quadrant A | 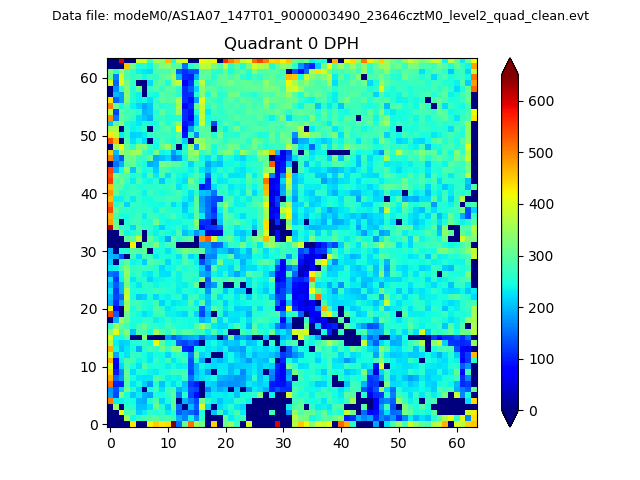 |
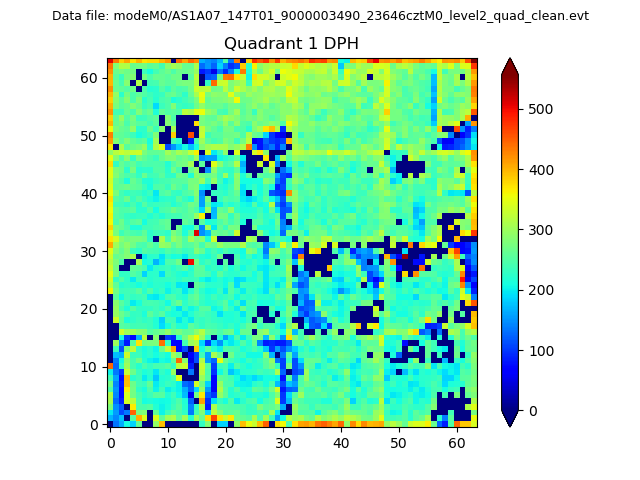 |
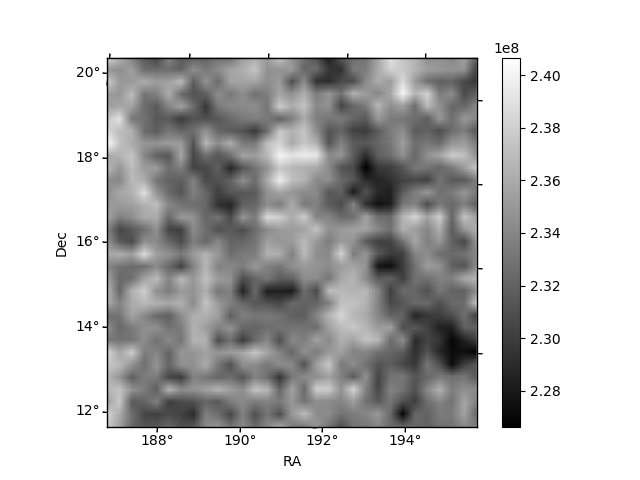
Quadrant B |
|---|---|---|---|
| Quadrant D | 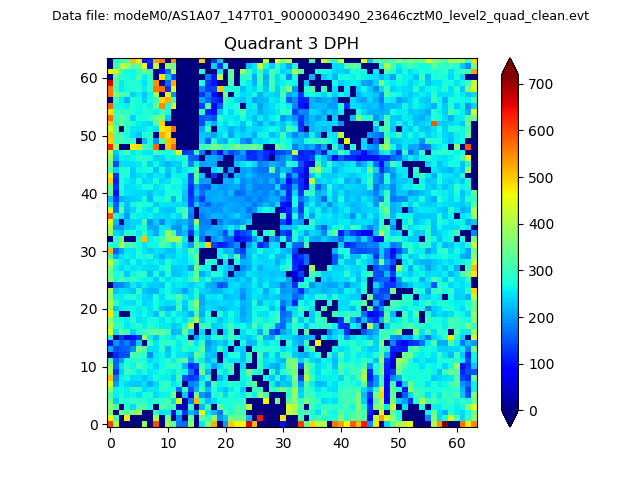 |
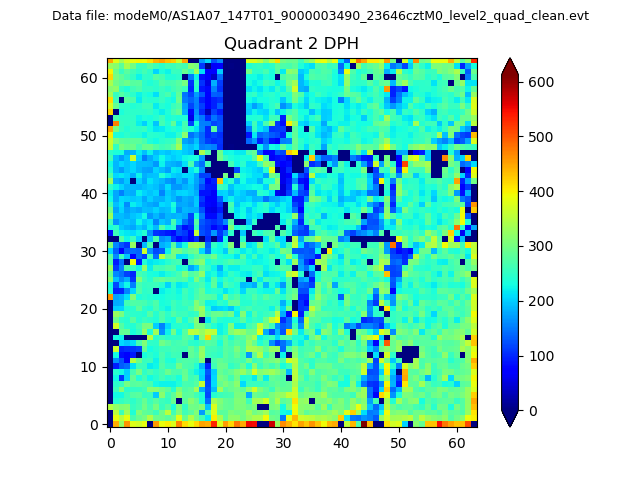 |
Quadrant C |
| Plot type | Count rate plots | Images |
|---|---|---|
| Comparison with Poisson distribution Blue bars denote a histogram of data divided into 1 sec bins. Red curve is a Poisson curve with rate = median count rate of data. |
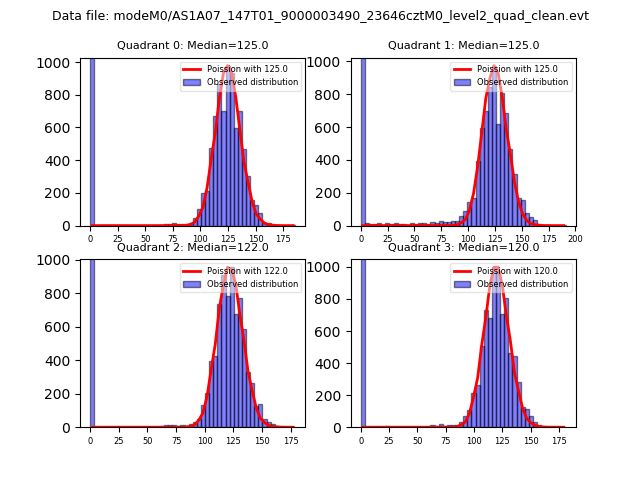 |
 |
| Quadrant-wise count rates Data is divided into 100 sec bins |
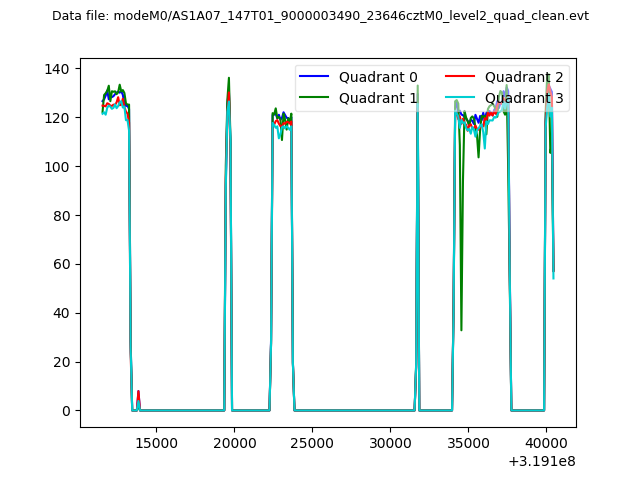 |
|
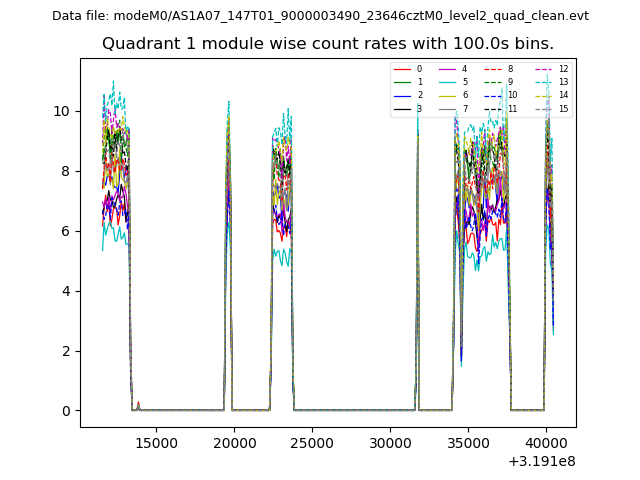
| Module-wise count rates for Quadrant A Data is divided into 100 sec bins |
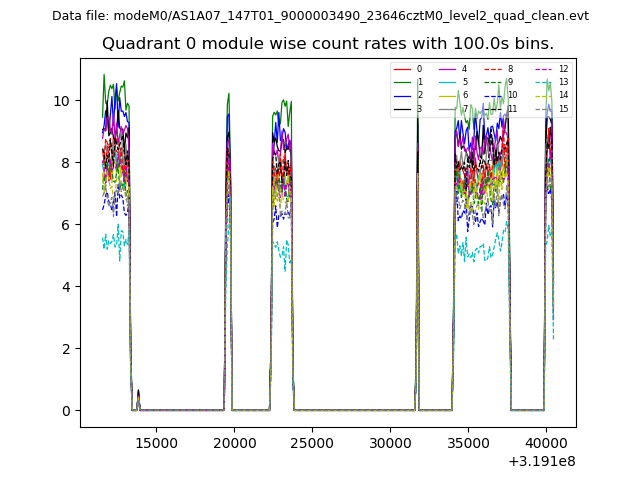 |
 |
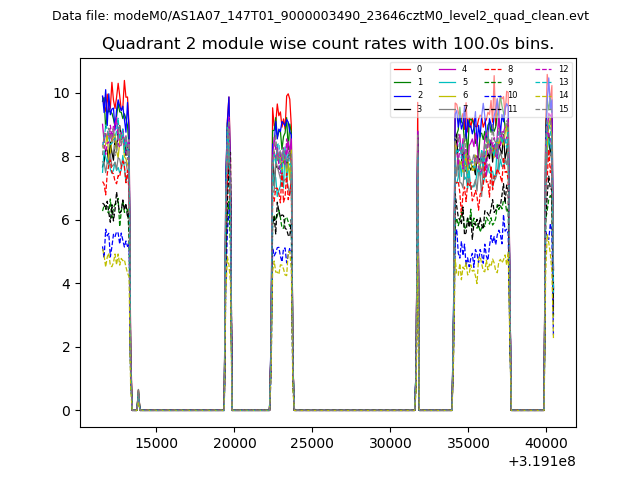
| Module-wise count rates for Quadrant B Data is divided into 100 sec bins |
 |
 |
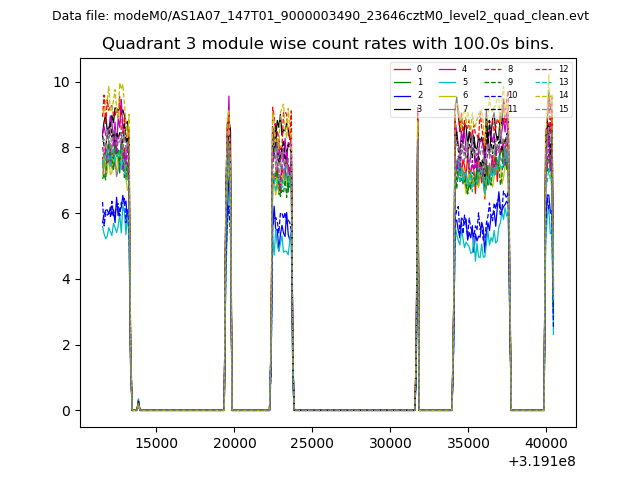
| Module-wise count rates for Quadrant C Data is divided into 100 sec bins |
 |
 |
| Module-wise count rates for Quadrant D Data is divided into 100 sec bins |
 |
 |
| Parameter | Plot |
|---|---|
| CZT HV Monitor | 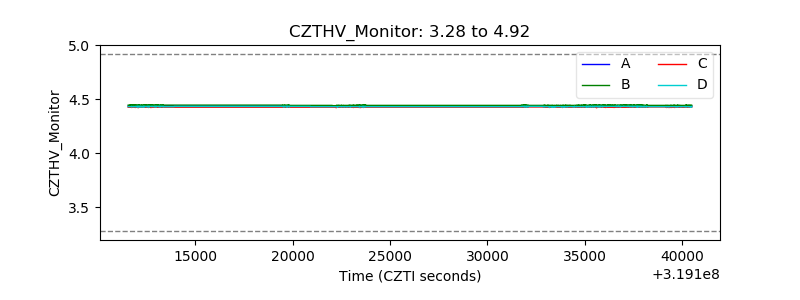 |
| D_VDD | 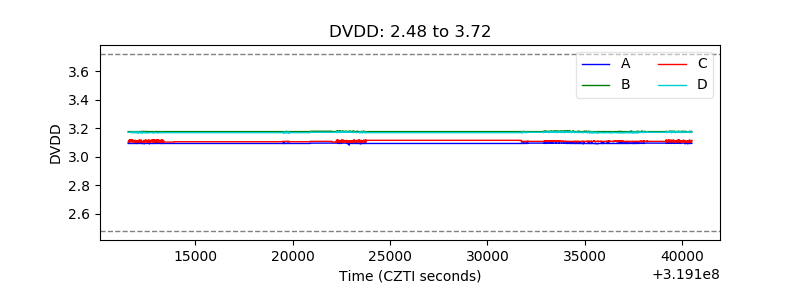 |
| Temperature 1 | 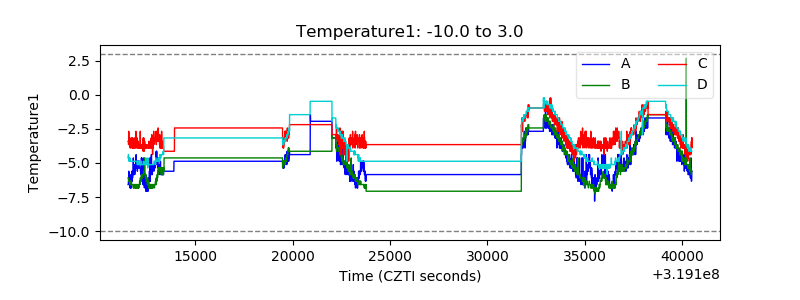 |
| Veto HV Monitor | 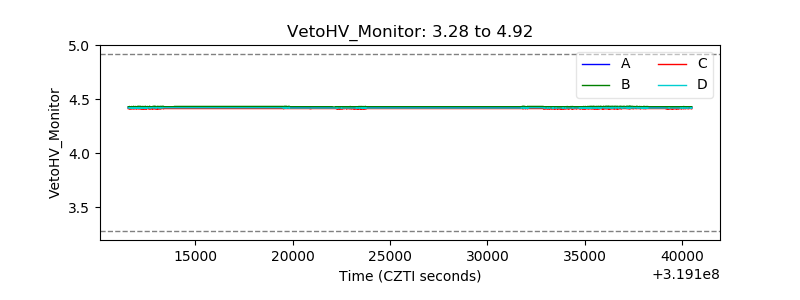 |
| Veto LLD | 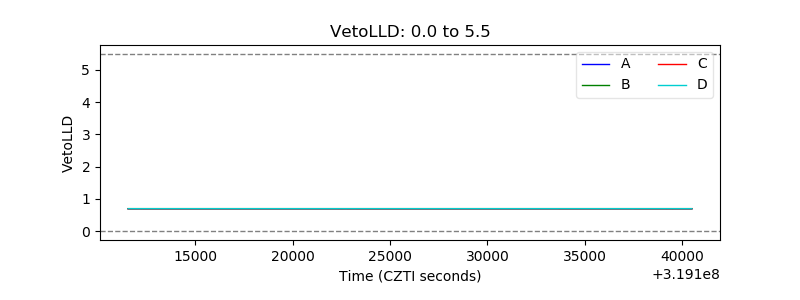 |
| Alpha Counter | 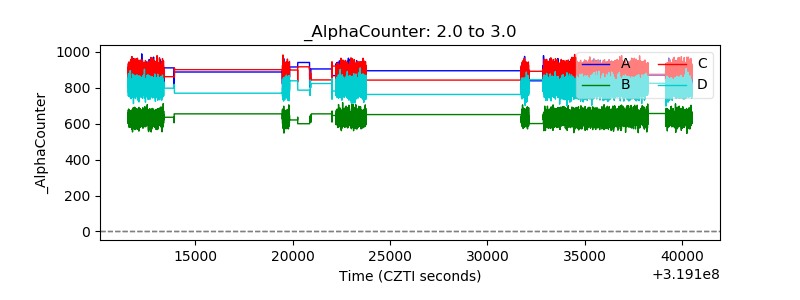 |
| _CPM_Rate | 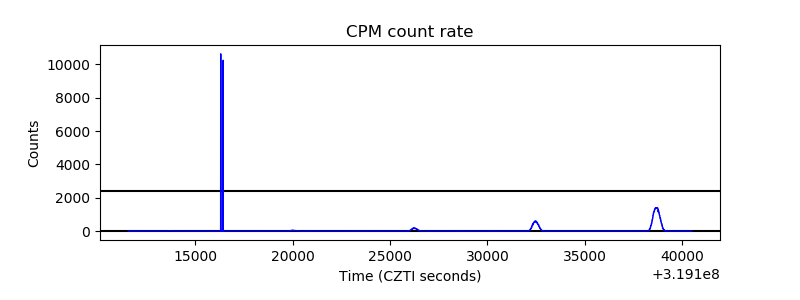 |
| CZT Counter | 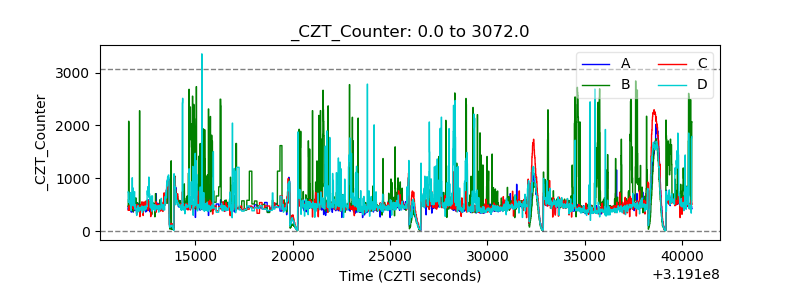 |
| +2.5 Volts monitor |  |
| +5 Volts monitor |  |
| _ROLL_ROT | 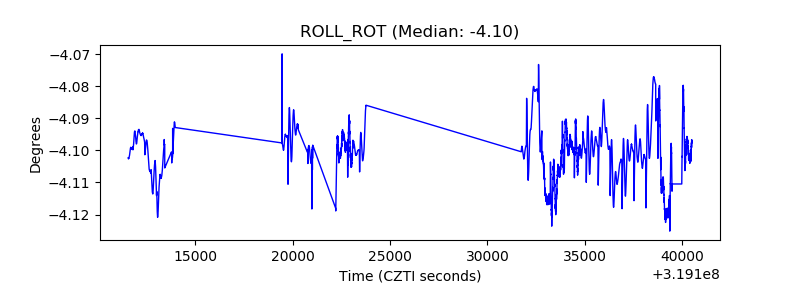 |
| _Roll_DEC | 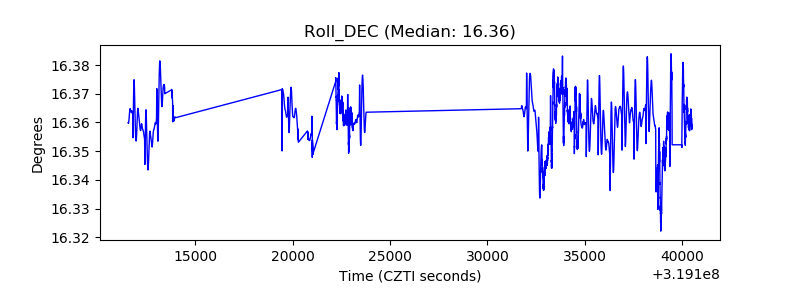 |
| _Roll_RA | 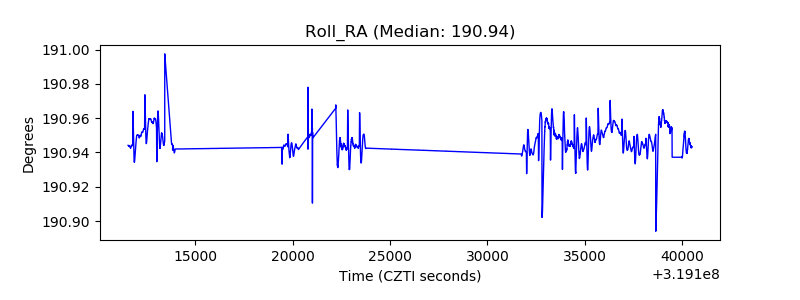 |
| Veto Counter | 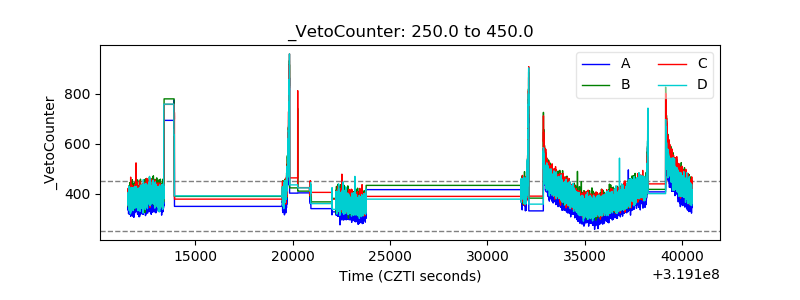 |