| Param | Original file | Final file |
|---|---|---|
| Filename | modeM0/AS1A07_147T01_9000003490_23647cztM0_level2.evt | modeM0/AS1A07_147T01_9000003490_23647cztM0_level2_quad_clean.evt |
| Size (bytes) | 1,403,850,240 | 235,690,560 |
| Size | 1.3 GB | 224.8 MB |
| Events in quadrant A | 8,880,979 | 1,491,224 |
| Events in quadrant B | 12,353,745 | 1,490,945 |
| Events in quadrant C | 9,135,492 | 1,456,443 |
| Events in quadrant D | 10,899,637 | 1,428,847 |
| Mode M9 | |||
|---|---|---|---|
| Quadrant | BADHDUFLAG | Total packets | Discarded packets |
| A | 0 | 31 | 0 |
| B | 0 | 31 | 0 |
| C | 0 | 31 | 0 |
| D | 0 | 31 | 0 |
| Mode SS | |||
|---|---|---|---|
| Quadrant | BADHDUFLAG | Total packets | Discarded packets |
| A | 0 | 394 | 16 |
| B | 0 | 392 | 20 |
| C | 0 | 393 | 13 |
| D | 0 | 391 | 17 |
| Mode M0 | |||
|---|---|---|---|
| Quadrant | BADHDUFLAG | Total packets | Discarded packets |
| A | 0 | 40057 | 1715 |
| B | 0 | 51270 | 2689 |
| C | 0 | 40409 | 1722 |
| D | 0 | 47379 | 2284 |
| Quadrant | Total seconds | Saturated seconds | Saturation percentage |
|---|---|---|---|
| A | 18478 | 273 | 1.477433% |
| B | 18401 | 1246 | 6.771371% |
| C | 18473 | 397 | 2.149082% |
| D | 18414 | 526 | 2.856522% |
Noise dominated data is calculated using 1-second bins in cleaned event files. If a bin has >2000 counts, and if more than 50% of those come from <1% of pixels, then it is considered to be noise-dominated and hence unusable.
| Quadrant | # 1 sec bins | Bins with >0 counts | Bins with >2000 counts | High rate bins dominated by noise | Noise dominated (total time) | Noise dominated (detector-on time) | Marked lightcurve |
|---|---|---|---|---|---|---|---|
| A | 35303 | 18651 | 0 | 0 | 0.00% | 0.00% | 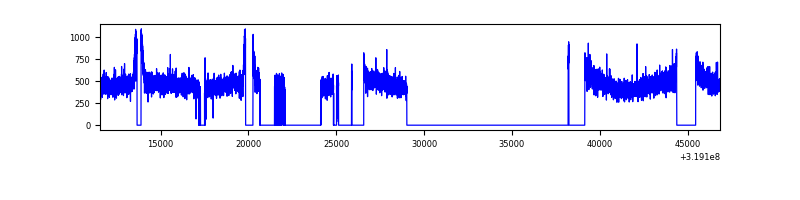 |
| B | 35303 | 18551 | 613 | 613 | 1.74% | 3.30% | 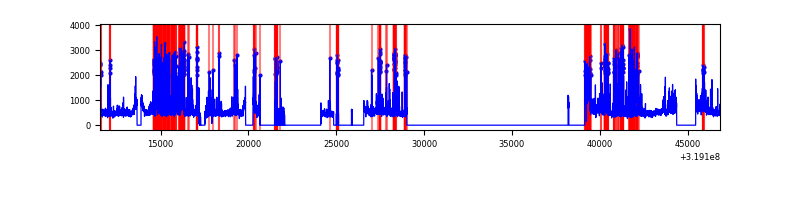 |
| C | 35303 | 18649 | 3 | 3 | 0.01% | 0.02% | 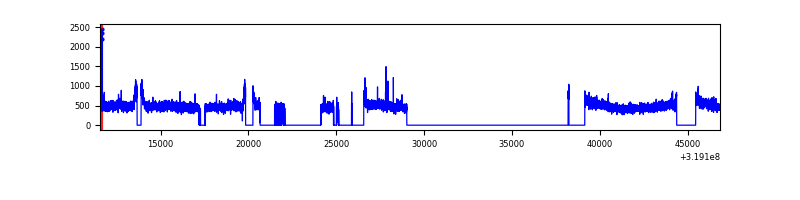 |
| D | 35302 | 18586 | 229 | 229 | 0.65% | 1.23% | 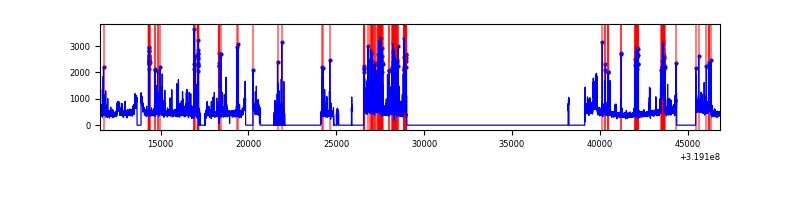 |
Top three noisy pixels from each quadrant. If the there are fewer than three noisy pixels in the level2.evt file, extra rows are filled as -1
| Pixel properties | Quadrant properties | ||||||
|---|---|---|---|---|---|---|---|
| Quadrant | DetID | PixID | Counts | Sigma | Mean | Median | Sigma |
| A | 13 | 254 | 30906 | 61.69 | 2302 | 2250 | 464.5 |
| A | 3 | 137 | 20789 | 39.91 | 2302 | 2250 | 464.5 |
| A | 0 | 226 | 20023 | 38.26 | 2302 | 2250 | 464.5 |
| B | 3 | 64 | 2792107 | 6453.71 | 2240 | 2186 | 432.3 |
| B | 0 | 229 | 370441 | 851.85 | 2240 | 2186 | 432.3 |
| B | 0 | 189 | 255760 | 586.57 | 2240 | 2186 | 432.3 |
| C | 14 | 238 | 344833 | 661.68 | 2215 | 2232 | 517.8 |
| C | 7 | 247 | 47859 | 88.12 | 2215 | 2232 | 517.8 |
| C | 10 | 91 | 41774 | 76.37 | 2215 | 2232 | 517.8 |
| D | 1 | 52 | 678902 | 1240.53 | 2231 | 2162 | 545.5 |
| D | 9 | 85 | 549912 | 1004.08 | 2231 | 2162 | 545.5 |
| D | 7 | 238 | 475575 | 867.81 | 2231 | 2162 | 545.5 |
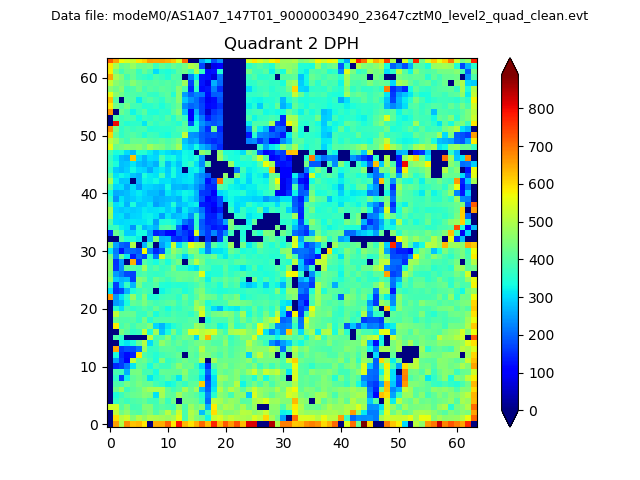
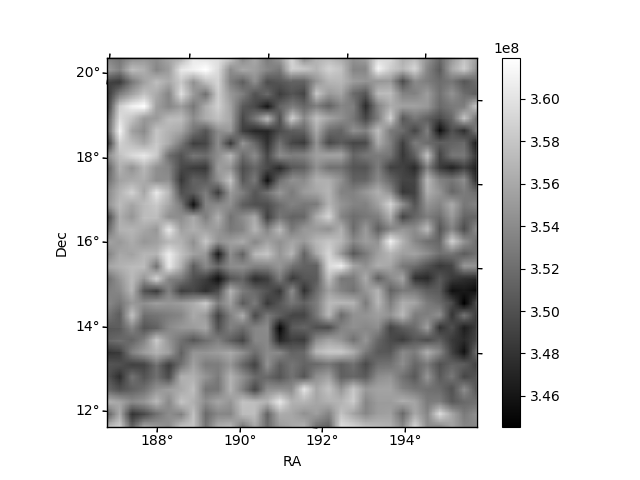
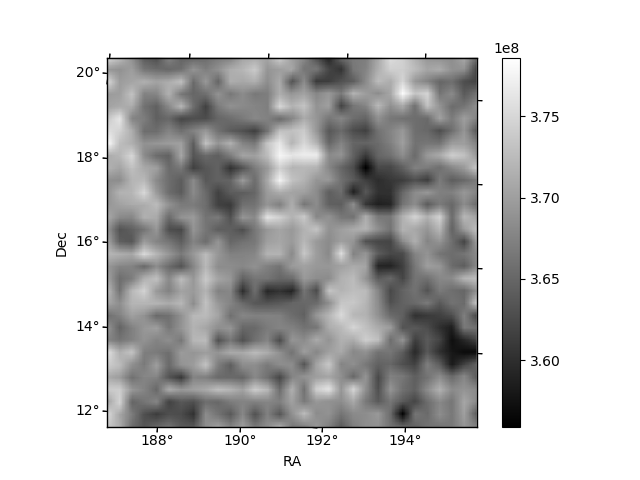
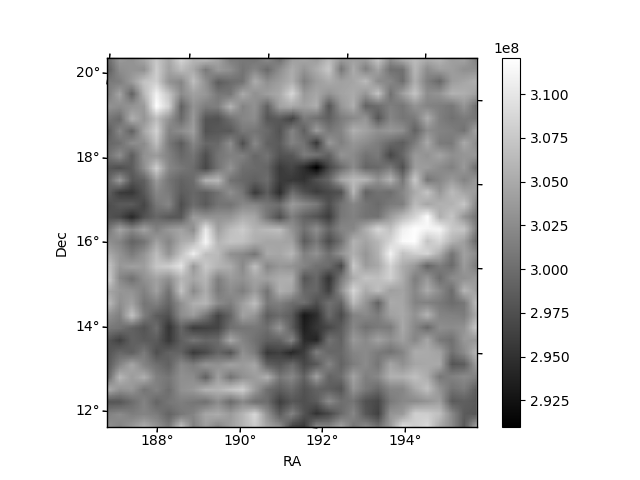
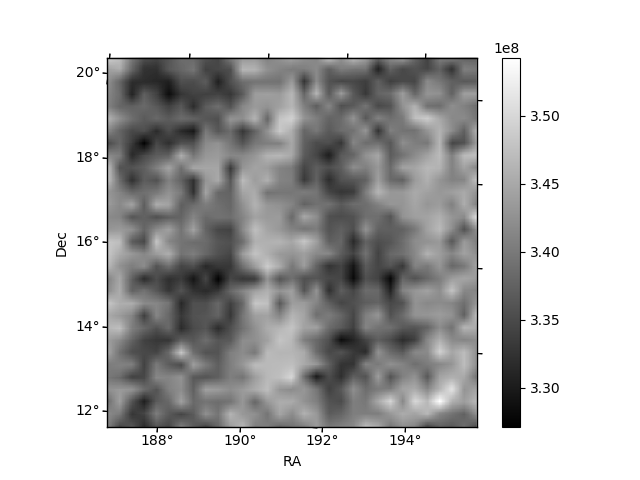
Histogram calculated using DETX and DETY for each event in the final _common_clean file
| Quadrant A | 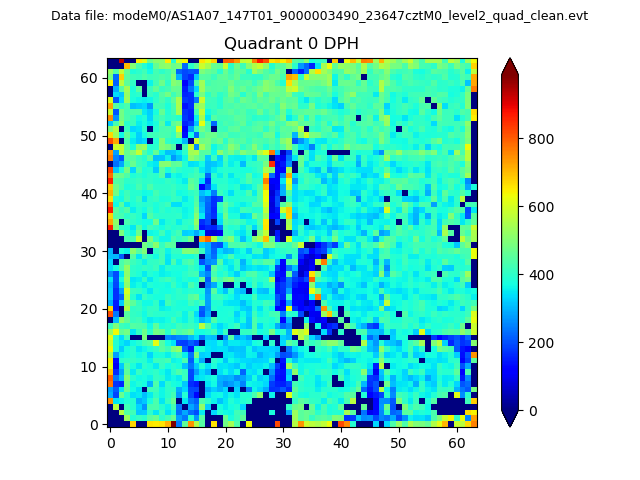 |
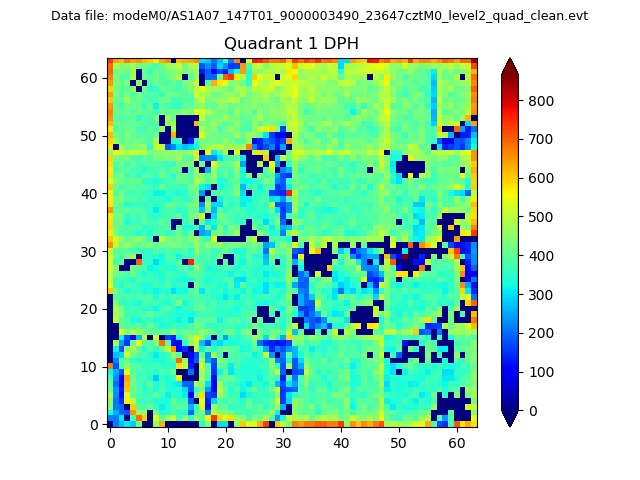 |
Quadrant B |
|---|---|---|---|
| Quadrant D | 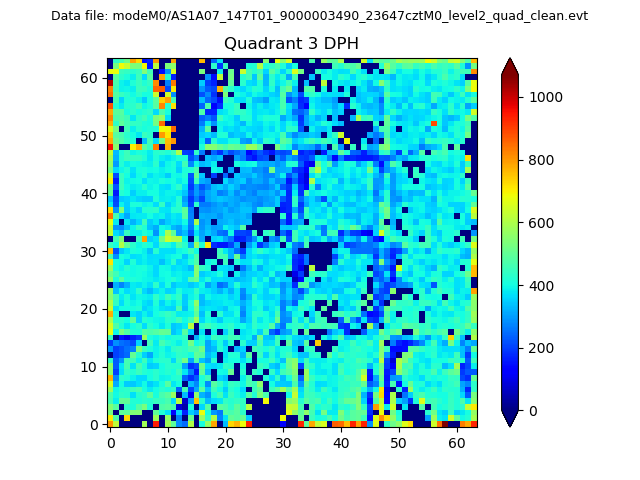 |
 |
Quadrant C |
| Plot type | Count rate plots | Images |
|---|---|---|
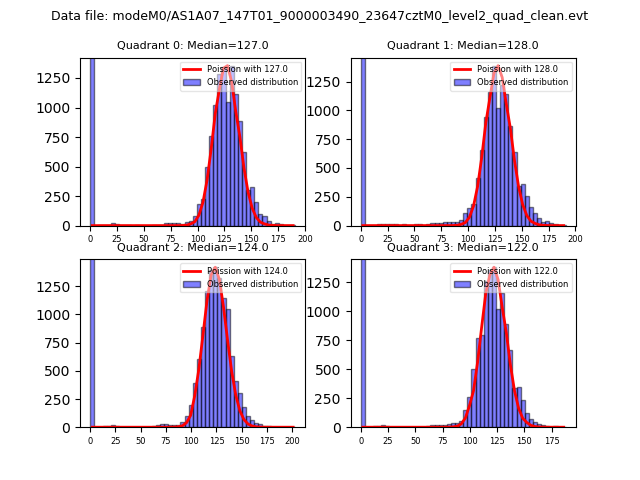
| Comparison with Poisson distribution Blue bars denote a histogram of data divided into 1 sec bins. Red curve is a Poisson curve with rate = median count rate of data. |
 |
 |
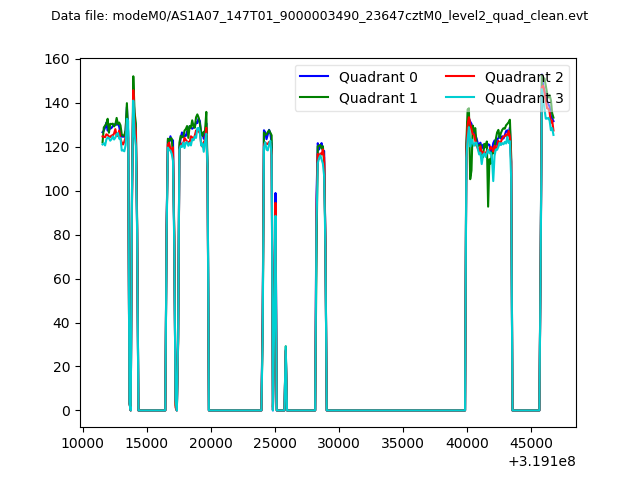
| Quadrant-wise count rates Data is divided into 100 sec bins |
 |
|
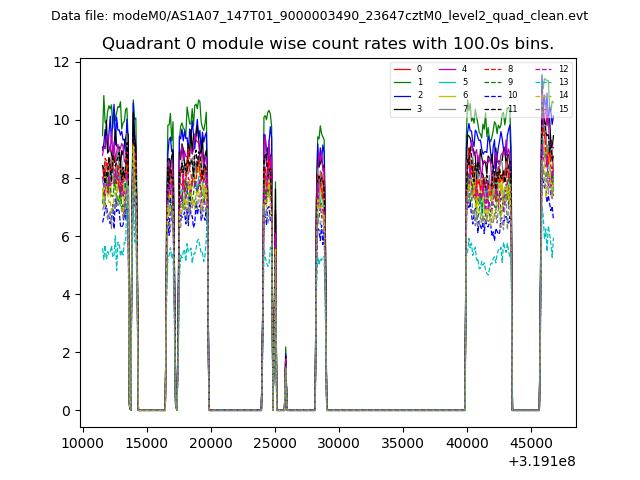
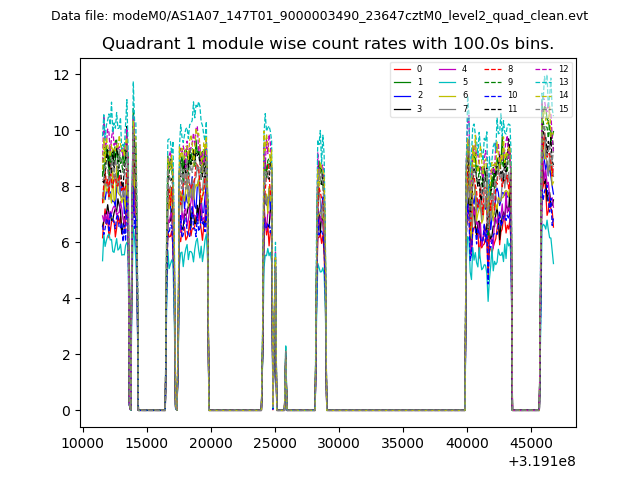
| Module-wise count rates for Quadrant A Data is divided into 100 sec bins |
 |
 |
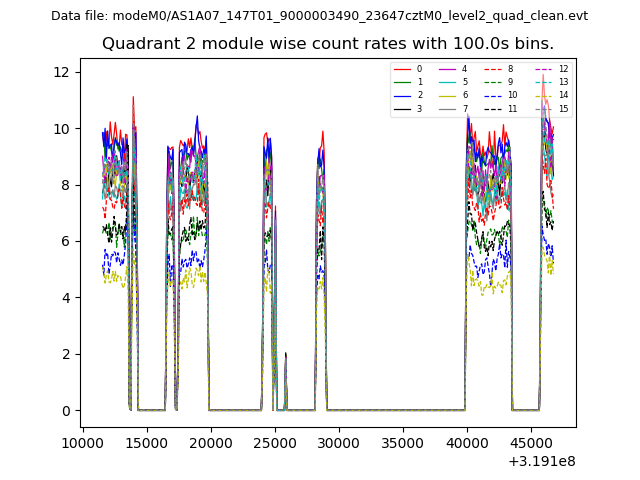
| Module-wise count rates for Quadrant B Data is divided into 100 sec bins |
 |
 |
| Module-wise count rates for Quadrant C Data is divided into 100 sec bins |
 |
 |
| Module-wise count rates for Quadrant D Data is divided into 100 sec bins |
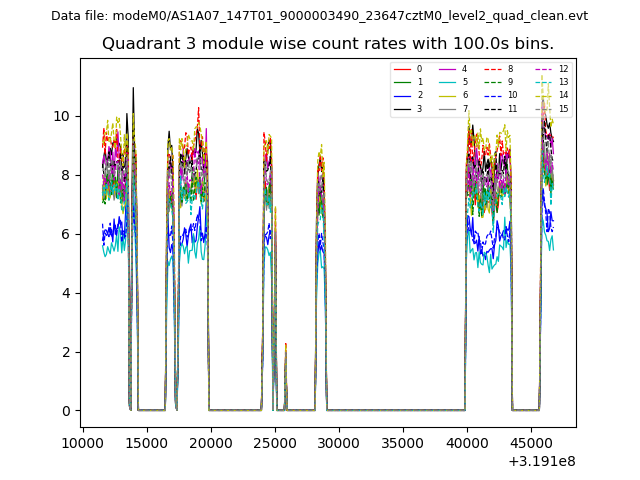 |
 |
| Parameter | Plot |
|---|---|
| CZT HV Monitor | 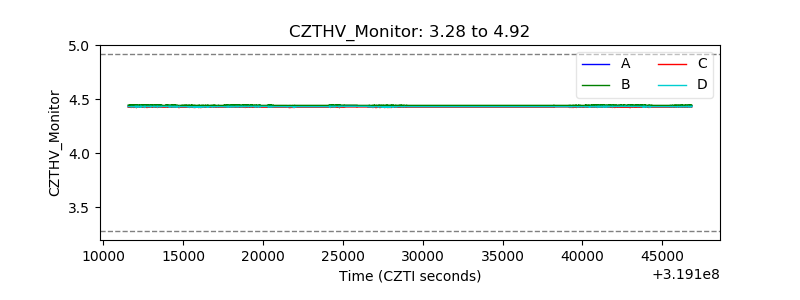 |
| D_VDD | 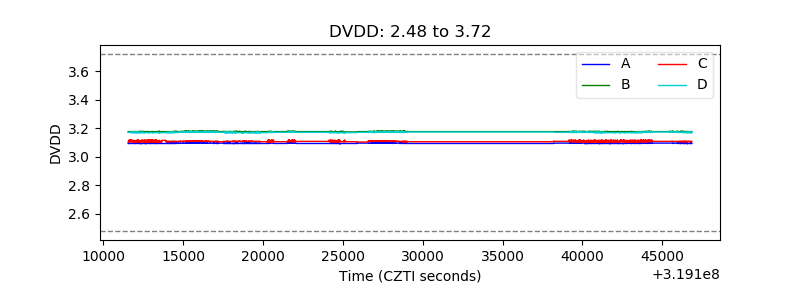 |
| Temperature 1 |  |
| Veto HV Monitor | 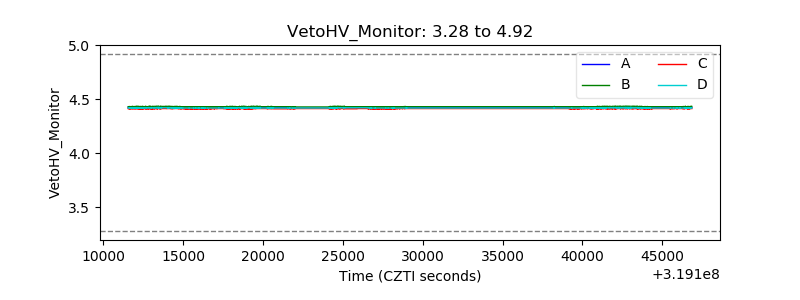 |
| Veto LLD | 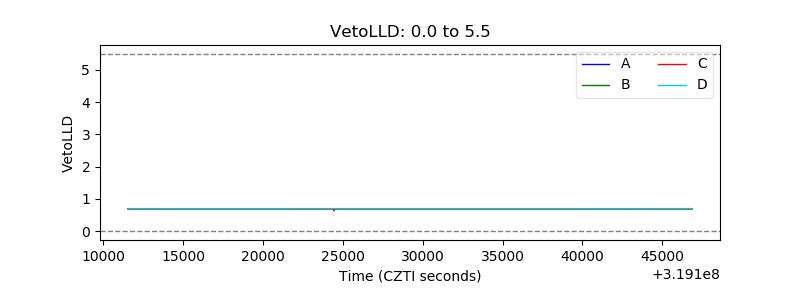 |
| Alpha Counter | 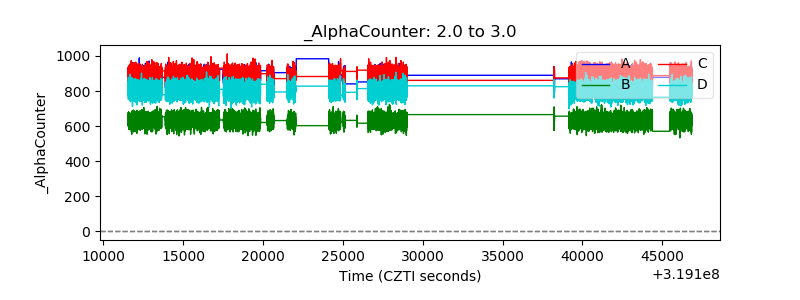 |
| _CPM_Rate | 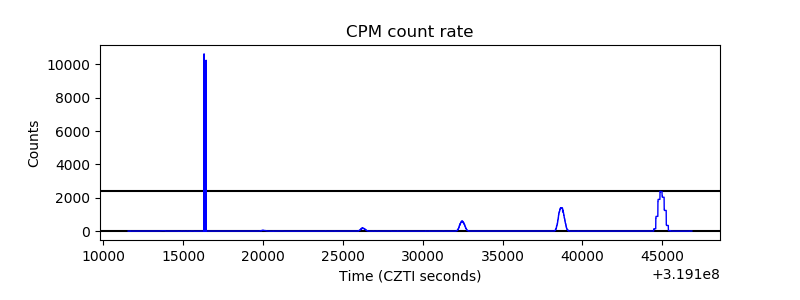 |
| CZT Counter | 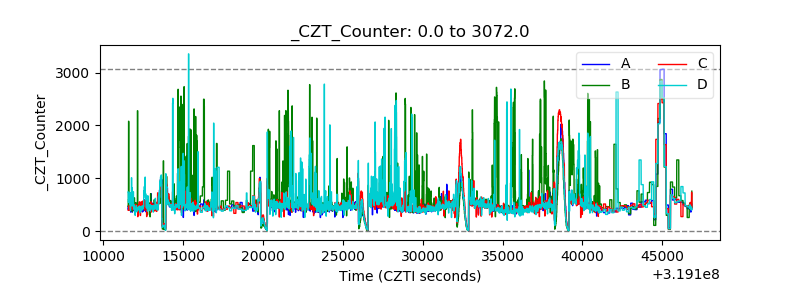 |
| +2.5 Volts monitor | 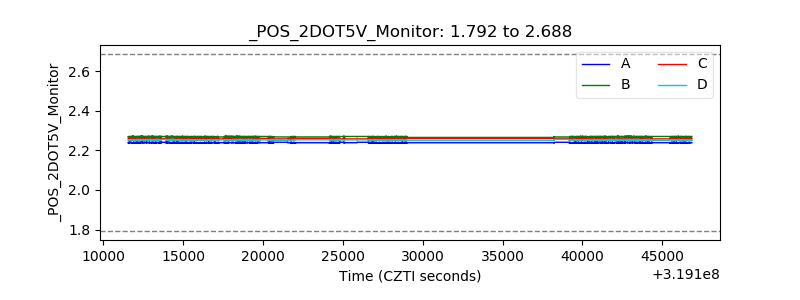 |
| +5 Volts monitor | 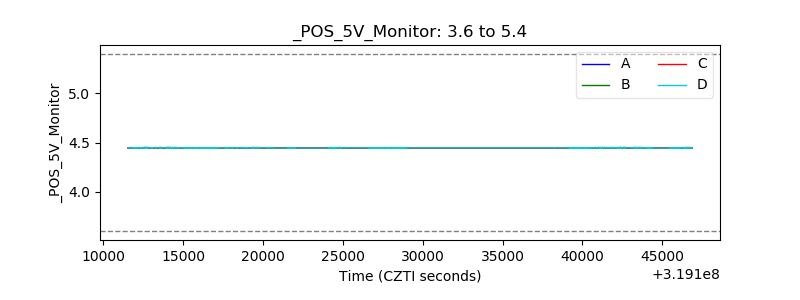 |
| _ROLL_ROT | 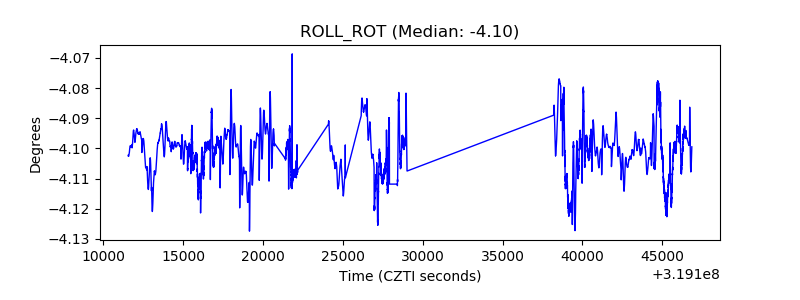 |
| _Roll_DEC | 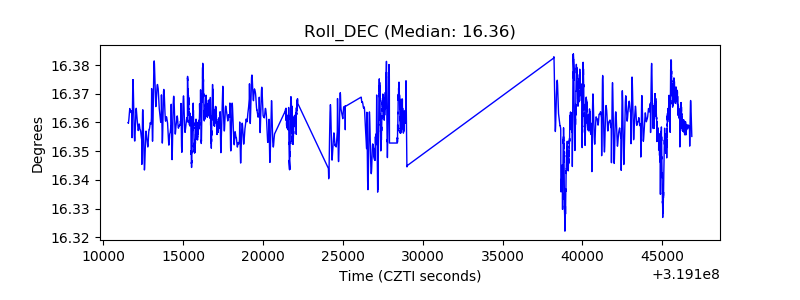 |
| _Roll_RA | 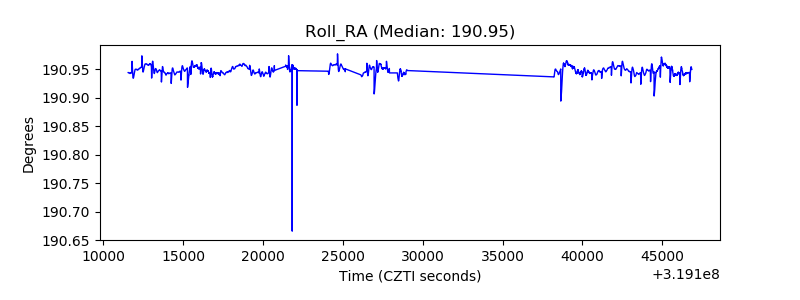 |
| Veto Counter | 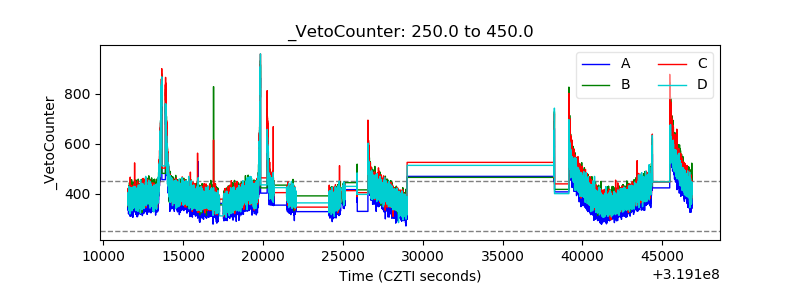 |