| Param | Original file | Final file |
|---|---|---|
| Filename | modeM0/AS1A07_147T01_9000003490_23649cztM0_level2.evt | modeM0/AS1A07_147T01_9000003490_23649cztM0_level2_quad_clean.evt |
| Size (bytes) | 1,174,697,280 | 216,616,320 |
| Size | 1.1 GB | 206.6 MB |
| Events in quadrant A | 7,602,869 | 1,386,202 |
| Events in quadrant B | 10,313,155 | 1,395,130 |
| Events in quadrant C | 7,790,523 | 1,351,493 |
| Events in quadrant D | 8,793,114 | 1,329,881 |
| Mode M9 | |||
|---|---|---|---|
| Quadrant | BADHDUFLAG | Total packets | Discarded packets |
| A | 0 | 14 | 1 |
| B | 0 | 14 | 0 |
| C | 0 | 14 | 0 |
| D | 0 | 14 | 0 |
| Mode SS | |||
|---|---|---|---|
| Quadrant | BADHDUFLAG | Total packets | Discarded packets |
| A | 0 | 327 | 3 |
| B | 0 | 327 | 3 |
| C | 0 | 328 | 4 |
| D | 0 | 328 | 4 |
| Mode M0 | |||
|---|---|---|---|
| Quadrant | BADHDUFLAG | Total packets | Discarded packets |
| A | 0 | 33441 | 462 |
| B | 0 | 41290 | 470 |
| C | 0 | 33589 | 458 |
| D | 0 | 37387 | 443 |
| Quadrant | Total seconds | Saturated seconds | Saturation percentage |
|---|---|---|---|
| A | 15909 | 280 | 1.760010% |
| B | 15913 | 1053 | 6.617231% |
| C | 15912 | 375 | 2.356712% |
| D | 15921 | 383 | 2.405628% |
Noise dominated data is calculated using 1-second bins in cleaned event files. If a bin has >2000 counts, and if more than 50% of those come from <1% of pixels, then it is considered to be noise-dominated and hence unusable.
| Quadrant | # 1 sec bins | Bins with >0 counts | Bins with >2000 counts | High rate bins dominated by noise | Noise dominated (total time) | Noise dominated (detector-on time) | Marked lightcurve |
|---|---|---|---|---|---|---|---|
| A | 35855 | 15948 | 0 | 0 | 0.00% | 0.00% | 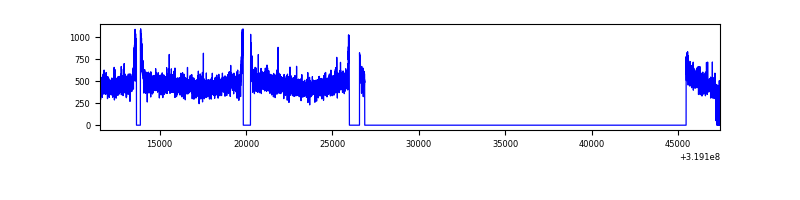 |
| B | 35852 | 15951 | 527 | 527 | 1.47% | 3.30% | 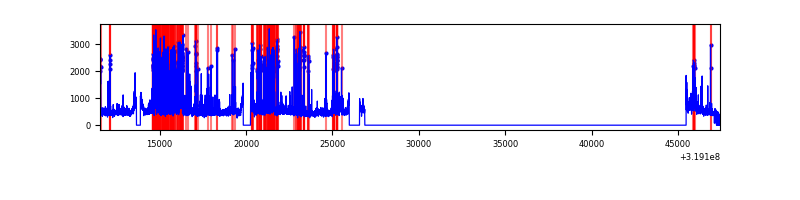 |
| C | 35878 | 15953 | 3 | 3 | 0.01% | 0.02% | 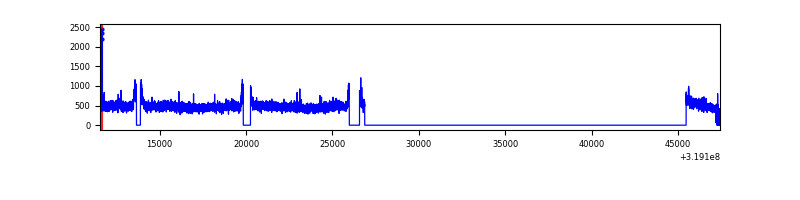 |
| D | 35854 | 15962 | 120 | 120 | 0.33% | 0.75% | 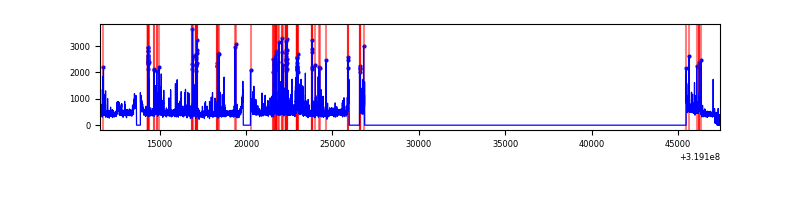 |
Top three noisy pixels from each quadrant. If the there are fewer than three noisy pixels in the level2.evt file, extra rows are filled as -1
| Pixel properties | Quadrant properties | ||||||
|---|---|---|---|---|---|---|---|
| Quadrant | DetID | PixID | Counts | Sigma | Mean | Median | Sigma |
| A | 13 | 254 | 27031 | 62.92 | 1971 | 1929 | 398.9 |
| A | 3 | 137 | 17964 | 40.19 | 1971 | 1929 | 398.9 |
| A | 0 | 226 | 16935 | 37.62 | 1971 | 1929 | 398.9 |
| B | 3 | 64 | 2079011 | 5607.94 | 1926 | 1883 | 370.4 |
| B | 0 | 229 | 399245 | 1072.82 | 1926 | 1883 | 370.4 |
| B | 0 | 189 | 147988 | 394.46 | 1926 | 1883 | 370.4 |
| C | 14 | 238 | 293356 | 653.45 | 1898 | 1914 | 446.0 |
| C | 10 | 91 | 41540 | 88.85 | 1898 | 1914 | 446.0 |
| C | 8 | 128 | 15459 | 30.37 | 1898 | 1914 | 446.0 |
| D | 1 | 52 | 743759 | 1574.97 | 1919 | 1864 | 471.1 |
| D | 9 | 85 | 379024 | 800.67 | 1919 | 1864 | 471.1 |
| D | 12 | 233 | 209574 | 440.95 | 1919 | 1864 | 471.1 |
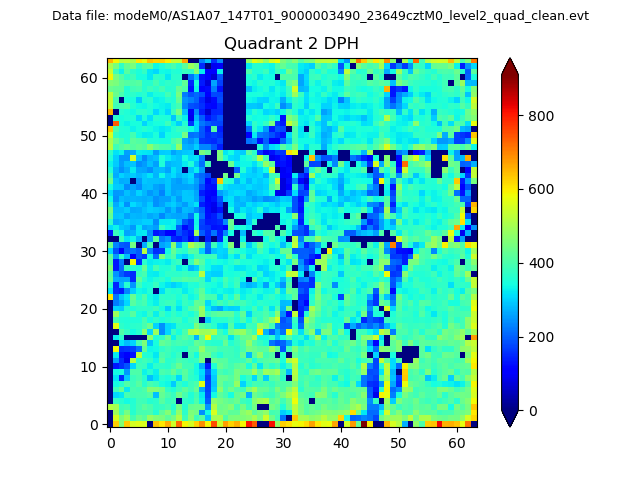
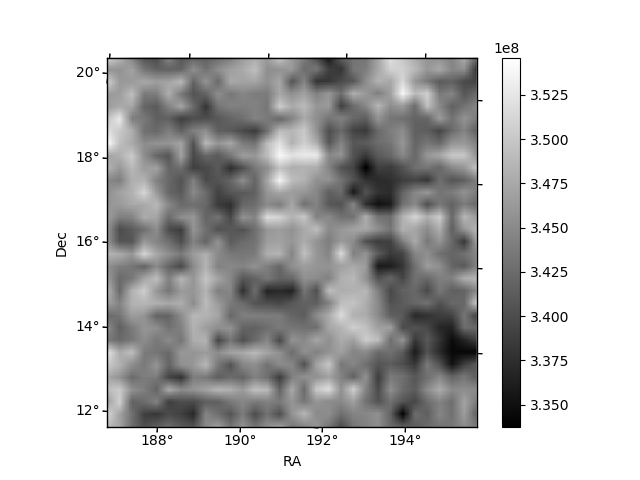
Histogram calculated using DETX and DETY for each event in the final _common_clean file
| Quadrant A | 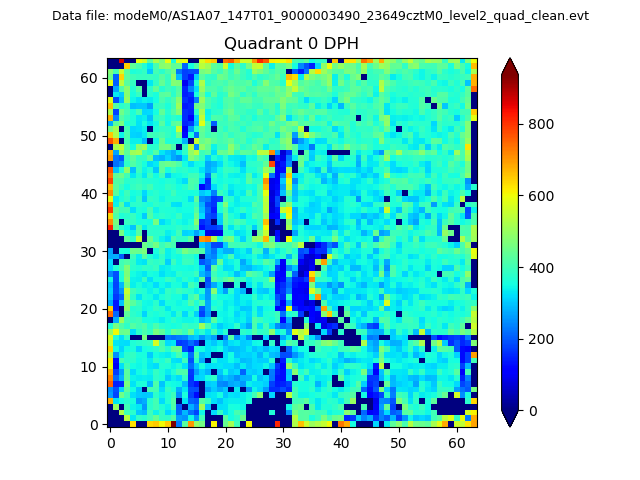 |
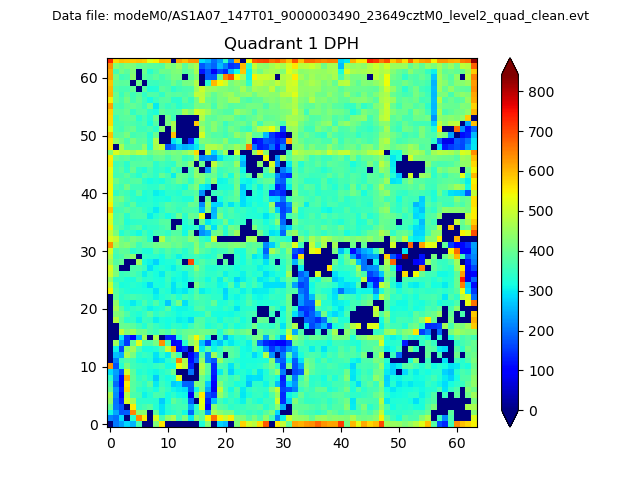 |
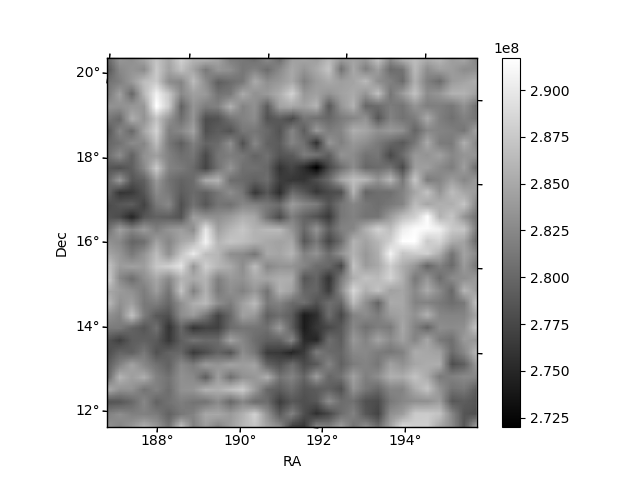
Quadrant B |
|---|---|---|---|
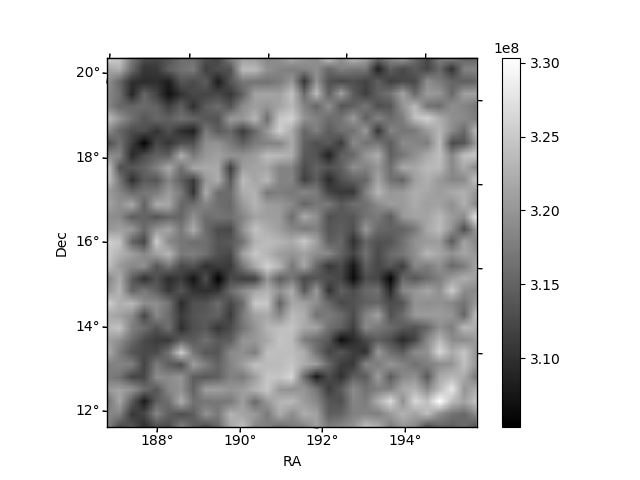
| Quadrant D | 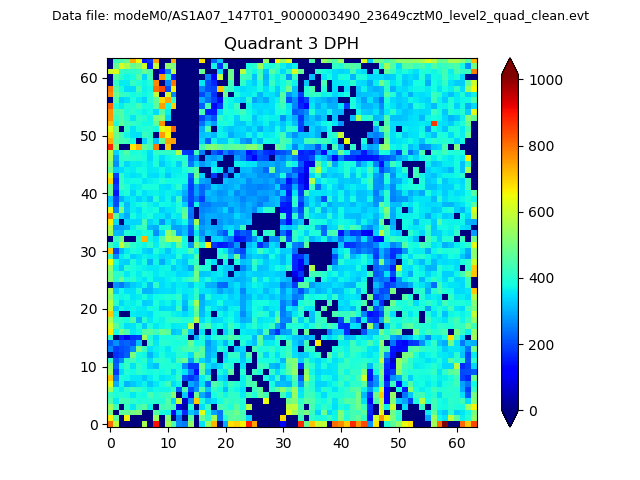 |
 |
Quadrant C |
| Plot type | Count rate plots | Images |
|---|---|---|
| Comparison with Poisson distribution Blue bars denote a histogram of data divided into 1 sec bins. Red curve is a Poisson curve with rate = median count rate of data. |
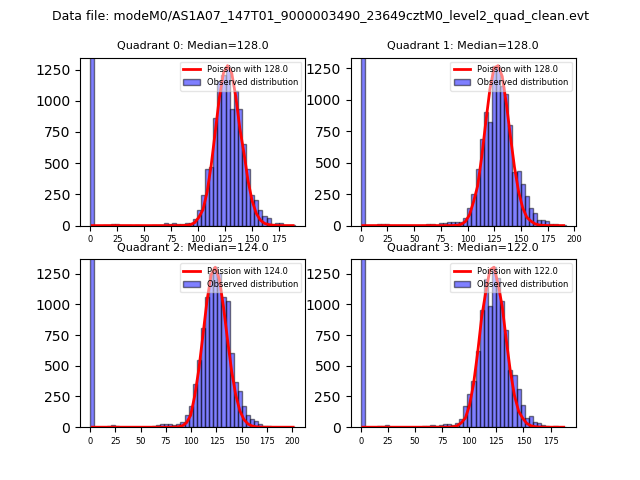 |
 |
| Quadrant-wise count rates Data is divided into 100 sec bins |
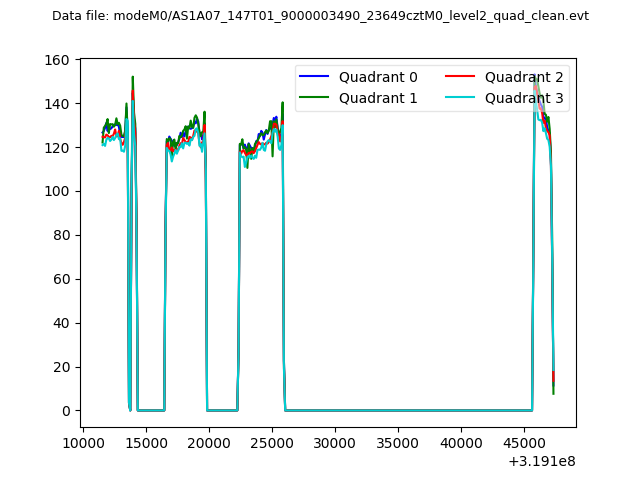 |
|
| Module-wise count rates for Quadrant A Data is divided into 100 sec bins |
 |
 |
| Module-wise count rates for Quadrant B Data is divided into 100 sec bins |
 |
 |
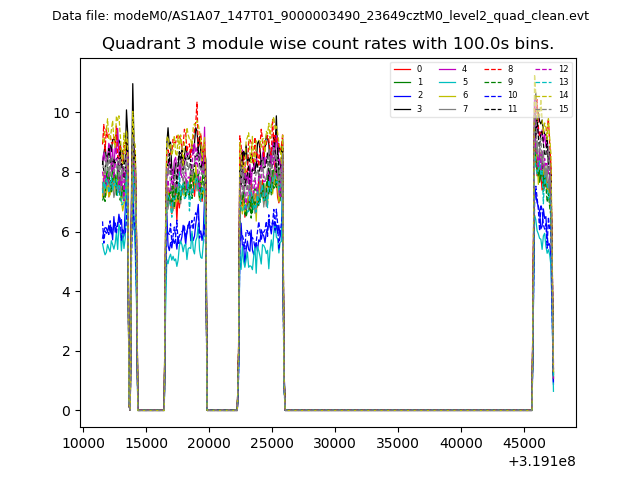
| Module-wise count rates for Quadrant C Data is divided into 100 sec bins |
 |
 |
| Module-wise count rates for Quadrant D Data is divided into 100 sec bins |
 |
 |
| Parameter | Plot |
|---|---|
| CZT HV Monitor |  |
| D_VDD | 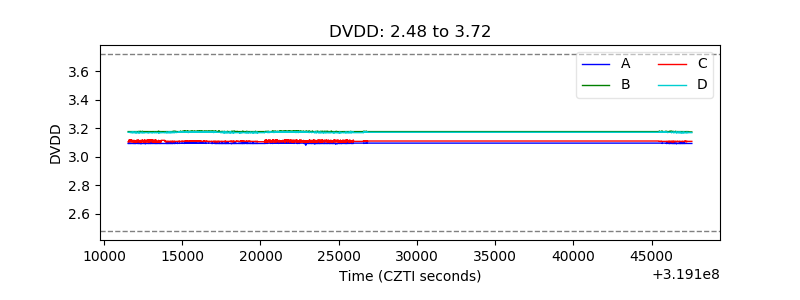 |
| Temperature 1 | 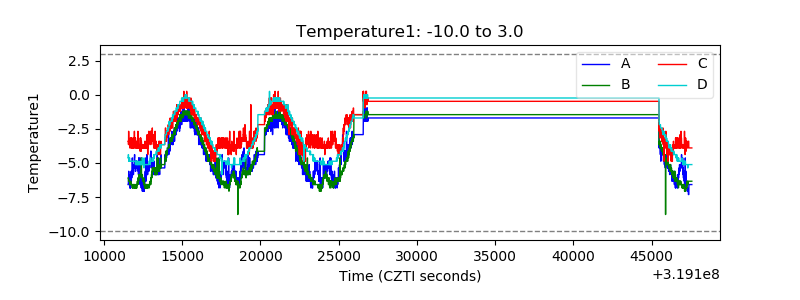 |
| Veto HV Monitor |  |
| Veto LLD | 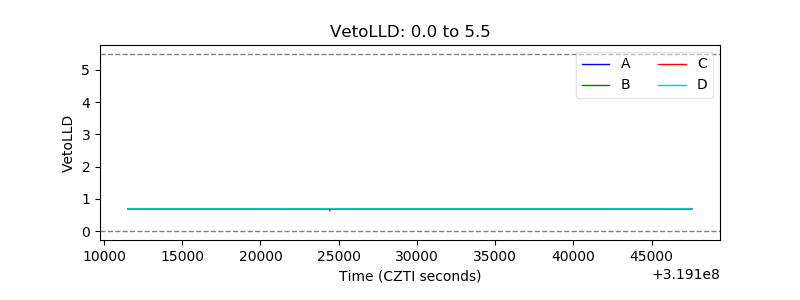 |
| Alpha Counter | 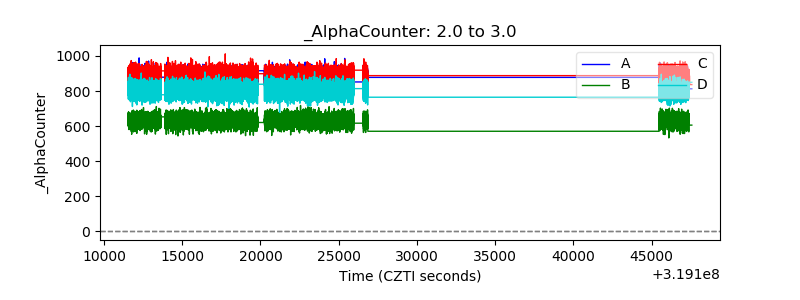 |
| _CPM_Rate | 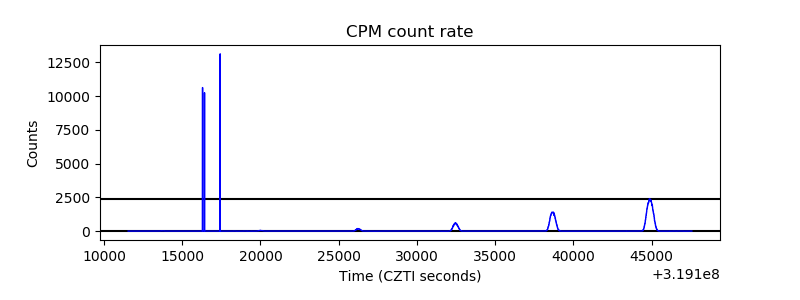 |
| CZT Counter | 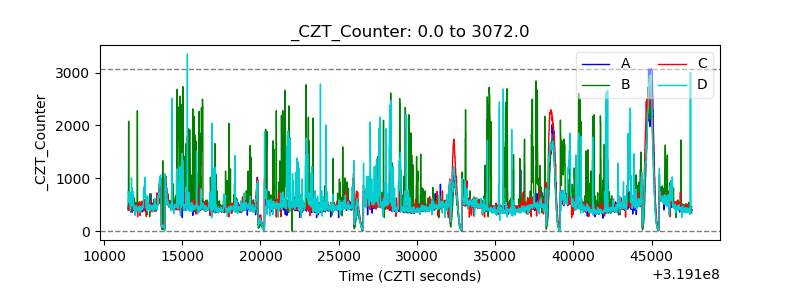 |
| +2.5 Volts monitor | 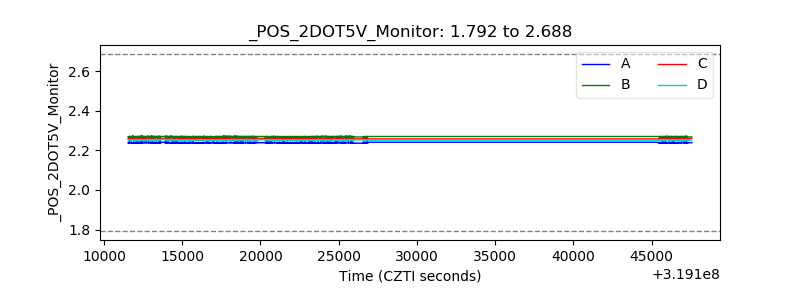 |
| +5 Volts monitor |  |
| _ROLL_ROT |  |
| _Roll_DEC | 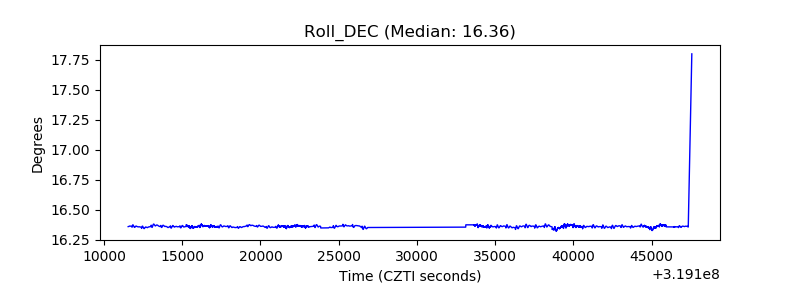 |
| _Roll_RA | 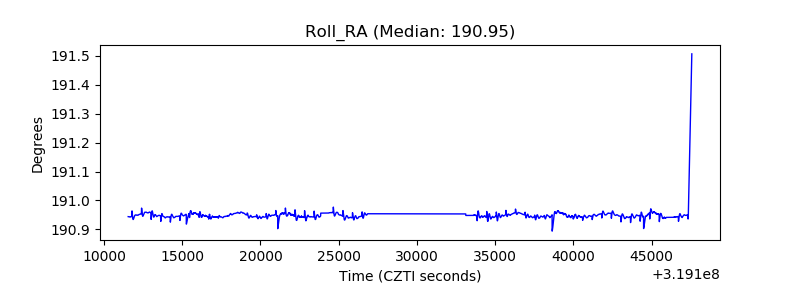 |
| Veto Counter |  |