| Param | Original file | Final file |
|---|---|---|
| Filename | modeM0/AS1A07_147T01_9000003490_23651cztM0_level2.evt | modeM0/AS1A07_147T01_9000003490_23651cztM0_level2_quad_clean.evt |
| Size (bytes) | 482,189,760 | 104,339,520 |
| Size | 459.9 MB | 99.5 MB |
| Events in quadrant A | 3,060,726 | 683,043 |
| Events in quadrant B | 4,309,475 | 685,874 |
| Events in quadrant C | 3,164,237 | 674,049 |
| Events in quadrant D | 3,619,542 | 655,848 |
| Mode M9 | |||
|---|---|---|---|
| Quadrant | BADHDUFLAG | Total packets | Discarded packets |
| A | 0 | 11 | 0 |
| B | 0 | 11 | 0 |
| C | 0 | 11 | 0 |
| D | 0 | 11 | 0 |
| Mode SS | |||
|---|---|---|---|
| Quadrant | BADHDUFLAG | Total packets | Discarded packets |
| A | 0 | 134 | 0 |
| B | 0 | 134 | 0 |
| C | 0 | 134 | 0 |
| D | 0 | 134 | 0 |
| Mode M0 | |||
|---|---|---|---|
| Quadrant | BADHDUFLAG | Total packets | Discarded packets |
| A | 0 | 13567 | 1 |
| B | 0 | 17250 | 1 |
| C | 0 | 13709 | 1 |
| D | 0 | 15452 | 1 |
| Quadrant | Total seconds | Saturated seconds | Saturation percentage |
|---|---|---|---|
| A | 6615 | 12 | 0.181406% |
| B | 6616 | 259 | 3.914752% |
| C | 6616 | 34 | 0.513906% |
| D | 6616 | 119 | 1.798670% |
Noise dominated data is calculated using 1-second bins in cleaned event files. If a bin has >2000 counts, and if more than 50% of those come from <1% of pixels, then it is considered to be noise-dominated and hence unusable.
| Quadrant | # 1 sec bins | Bins with >0 counts | Bins with >2000 counts | High rate bins dominated by noise | Noise dominated (total time) | Noise dominated (detector-on time) | Marked lightcurve |
|---|---|---|---|---|---|---|---|
| A | 7700 | 6616 | 0 | 0 | 0.00% | 0.00% | 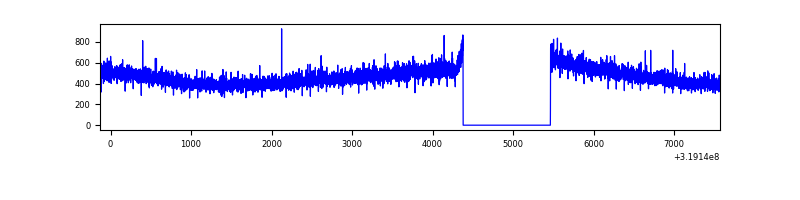 |
| B | 7701 | 6617 | 172 | 172 | 2.23% | 2.60% | 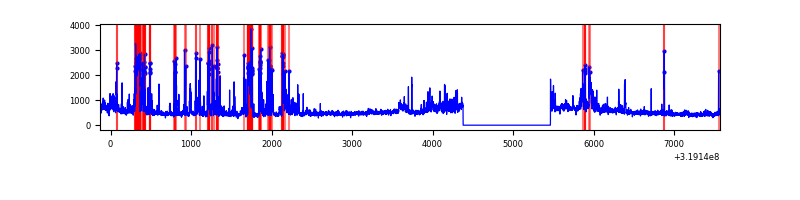 |
| C | 7701 | 6617 | 0 | 0 | 0.00% | 0.00% | 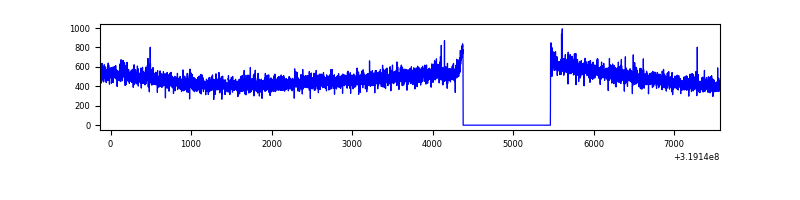 |
| D | 7701 | 6616 | 80 | 80 | 1.04% | 1.21% | 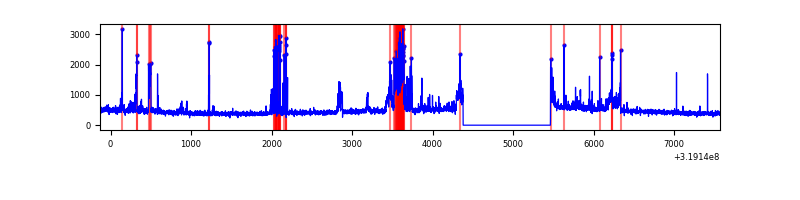 |
Top three noisy pixels from each quadrant. If the there are fewer than three noisy pixels in the level2.evt file, extra rows are filled as -1
| Pixel properties | Quadrant properties | ||||||
|---|---|---|---|---|---|---|---|
| Quadrant | DetID | PixID | Counts | Sigma | Mean | Median | Sigma |
| A | 13 | 254 | 10919 | 62.88 | 793 | 776 | 161.3 |
| A | 3 | 137 | 6991 | 38.53 | 793 | 776 | 161.3 |
| A | 0 | 226 | 6826 | 37.5 | 793 | 776 | 161.3 |
| B | 3 | 64 | 1014488 | 6765.52 | 786 | 768 | 149.8 |
| B | 0 | 189 | 139264 | 924.31 | 786 | 768 | 149.8 |
| B | 0 | 229 | 52935 | 348.16 | 786 | 768 | 149.8 |
| C | 14 | 238 | 121611 | 671.91 | 770 | 778 | 179.8 |
| C | 7 | 247 | 21759 | 116.67 | 770 | 778 | 179.8 |
| C | 8 | 128 | 8963 | 45.51 | 770 | 778 | 179.8 |
| D | 7 | 238 | 293093 | 1561.1 | 768 | 746 | 187.3 |
| D | 9 | 85 | 155682 | 827.34 | 768 | 746 | 187.3 |
| D | 13 | 189 | 138793 | 737.16 | 768 | 746 | 187.3 |
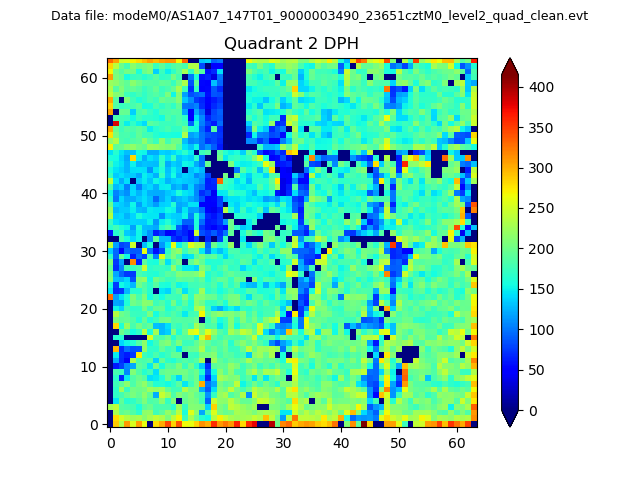
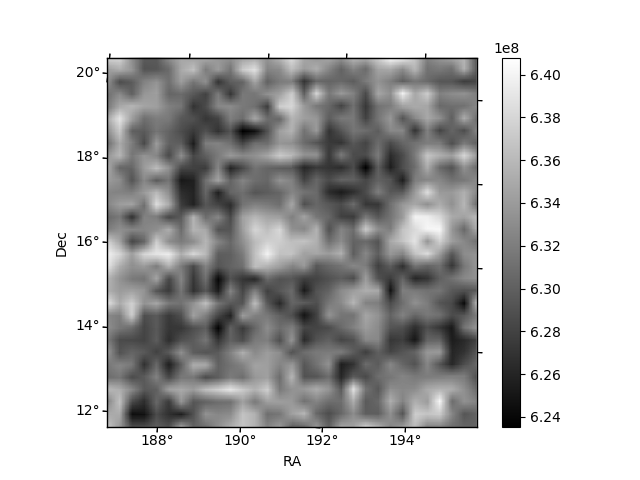
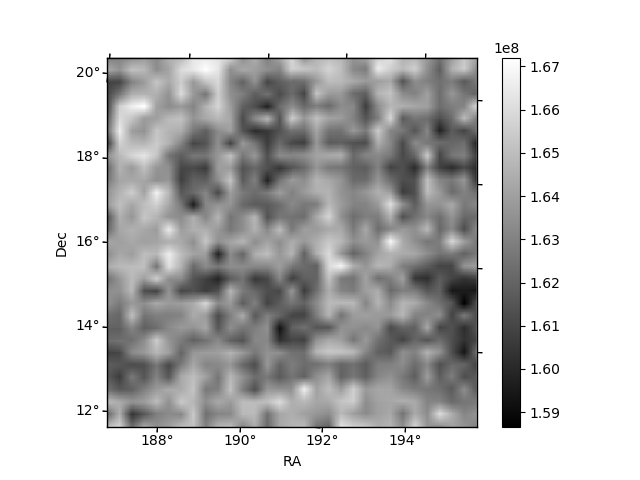
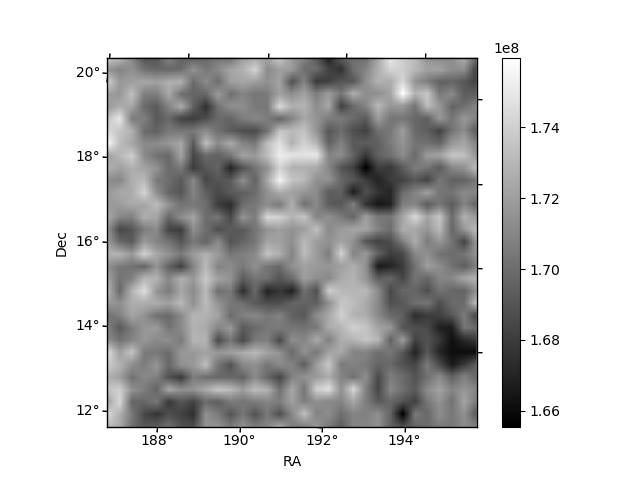
Histogram calculated using DETX and DETY for each event in the final _common_clean file
| Quadrant A | 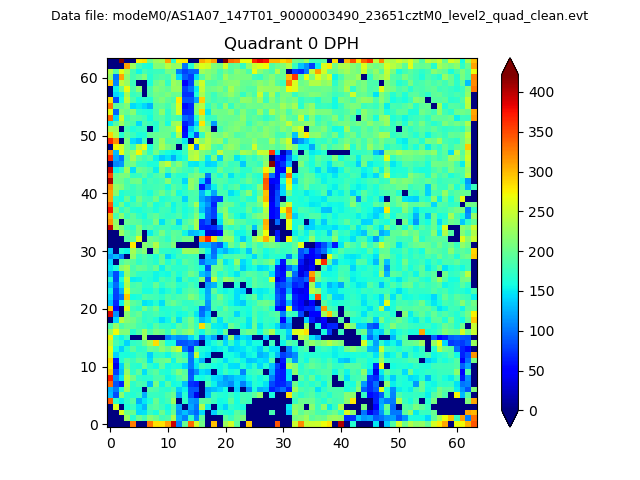 |
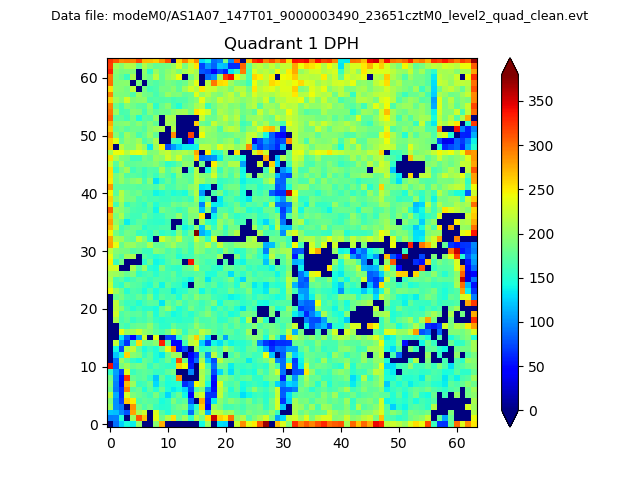 |
Quadrant B |
|---|---|---|---|
| Quadrant D | 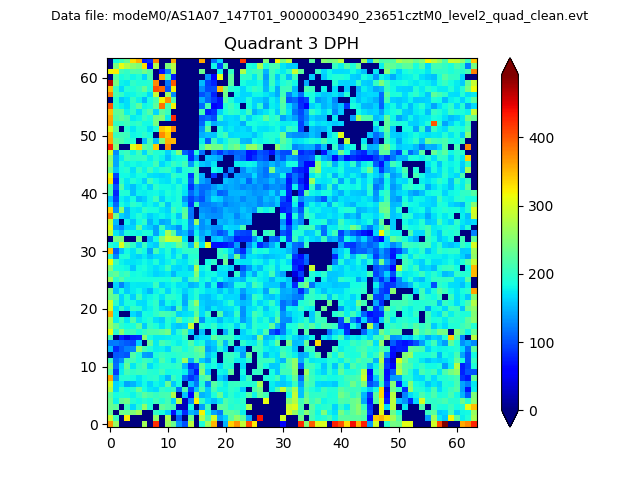 |
 |
Quadrant C |
| Plot type | Count rate plots | Images |
|---|---|---|
| Comparison with Poisson distribution Blue bars denote a histogram of data divided into 1 sec bins. Red curve is a Poisson curve with rate = median count rate of data. |
 |
 |
| Quadrant-wise count rates Data is divided into 100 sec bins |
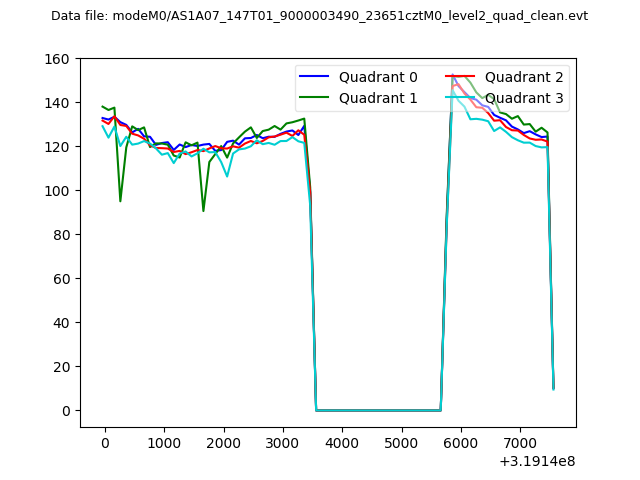 |
|
| Module-wise count rates for Quadrant A Data is divided into 100 sec bins |
 |
 |
| Module-wise count rates for Quadrant B Data is divided into 100 sec bins |
 |
 |
| Module-wise count rates for Quadrant C Data is divided into 100 sec bins |
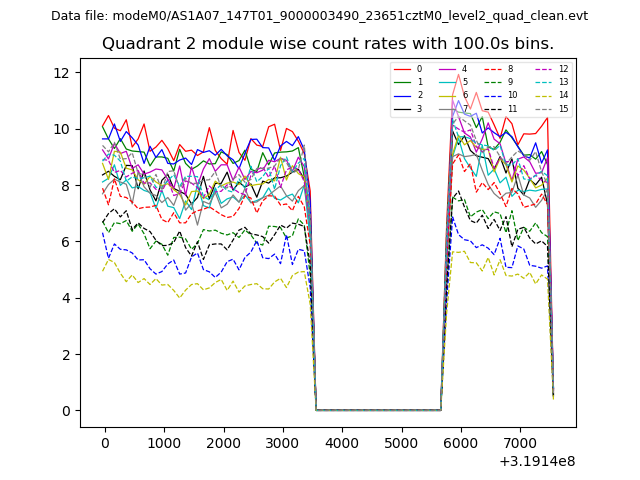 |
 |
| Module-wise count rates for Quadrant D Data is divided into 100 sec bins |
 |
 |
| Parameter | Plot |
|---|---|
| CZT HV Monitor | 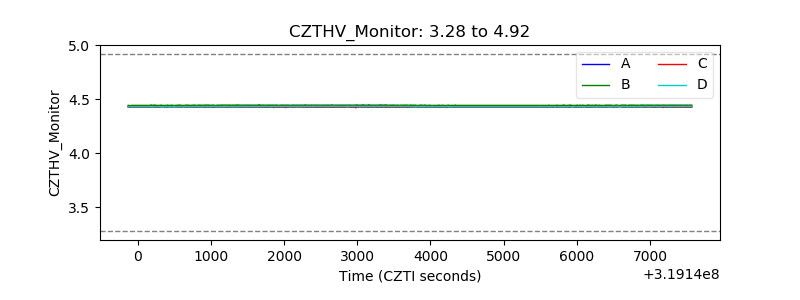 |
| D_VDD | 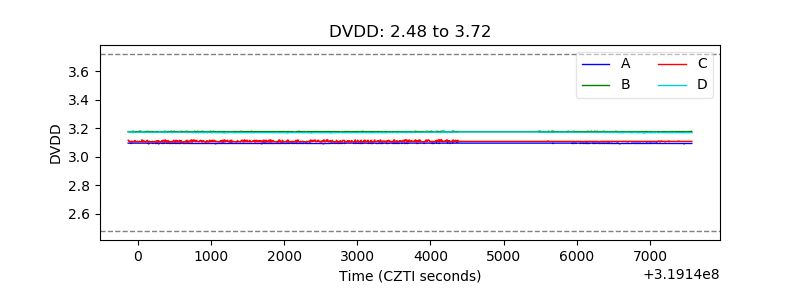 |
| Temperature 1 |  |
| Veto HV Monitor | 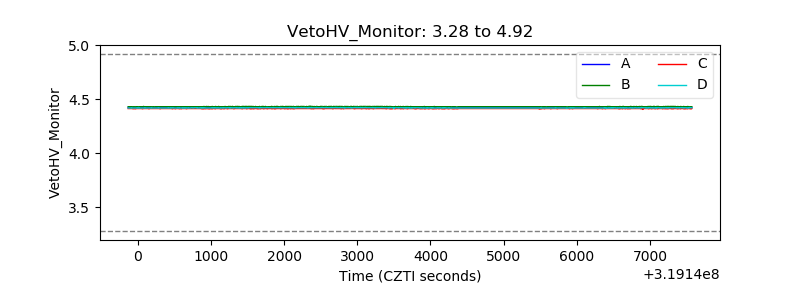 |
| Veto LLD |  |
| Alpha Counter | 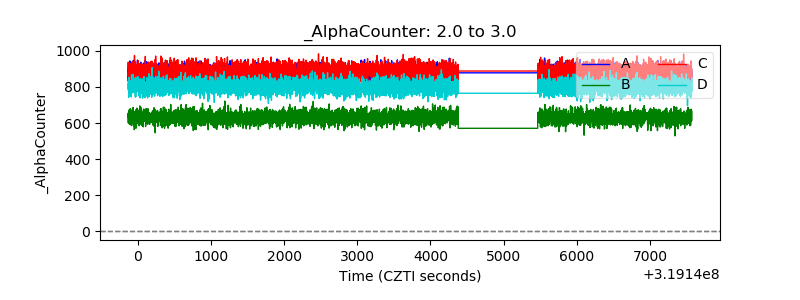 |
| _CPM_Rate | 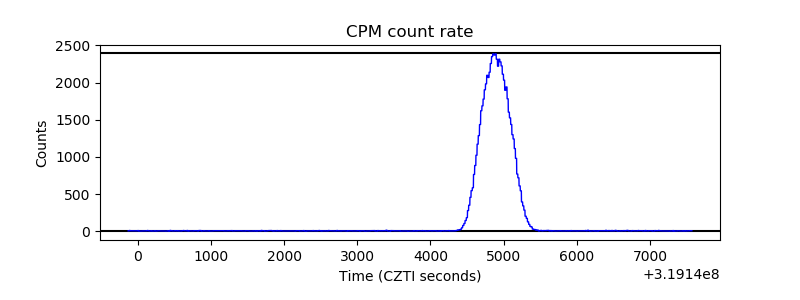 |
| CZT Counter | 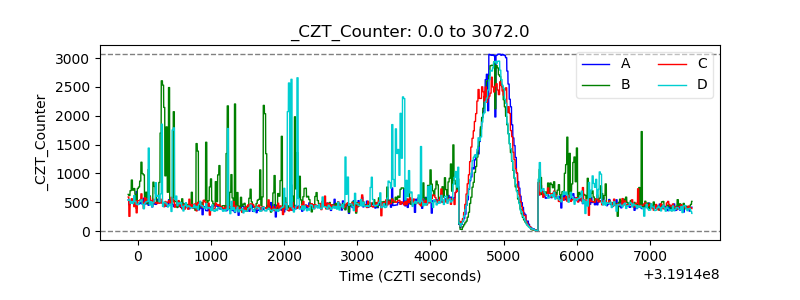 |
| +2.5 Volts monitor | 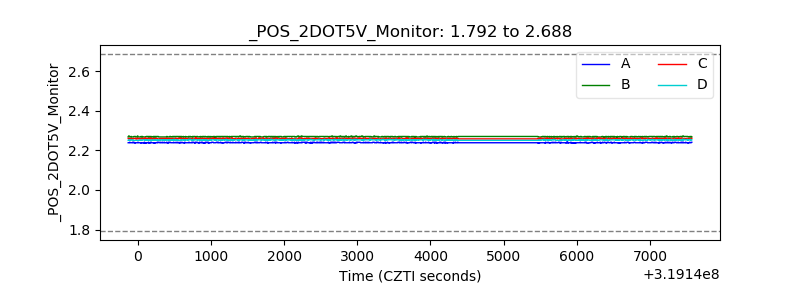 |
| +5 Volts monitor |  |
| _ROLL_ROT |  |
| _Roll_DEC |  |
| _Roll_RA | 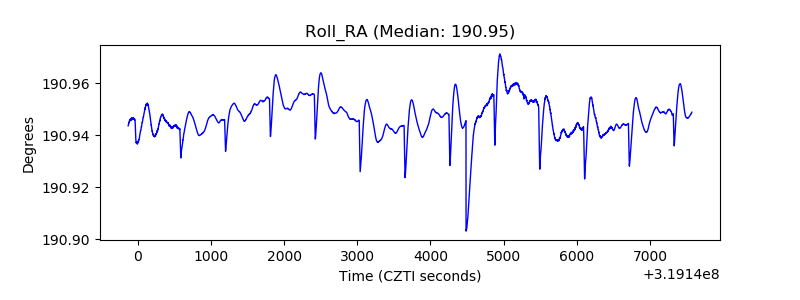 |
| Veto Counter |  |