| Param | Original file | Final file |
|---|---|---|
| Filename | modeM0/AS1A07_091T04_9000003492_23649cztM0_level2.evt | modeM0/AS1A07_091T04_9000003492_23649cztM0_level2_quad_clean.evt |
| Size (bytes) | 241,159,680 | 33,252,480 |
| Size | 230.0 MB | 31.7 MB |
| Events in quadrant A | 1,498,068 | 201,560 |
| Events in quadrant B | 2,156,115 | 208,592 |
| Events in quadrant C | 1,599,910 | 199,798 |
| Events in quadrant D | 1,849,630 | 188,454 |
| Mode M9 | |||
|---|---|---|---|
| Quadrant | BADHDUFLAG | Total packets | Discarded packets |
| A | 0 | 12 | 0 |
| B | 0 | 12 | 0 |
| C | 0 | 12 | 0 |
| D | 0 | 12 | 0 |
| Mode M0 | |||
|---|---|---|---|
| Quadrant | BADHDUFLAG | Total packets | Discarded packets |
| A | 0 | 7033 | 766 |
| B | 0 | 9400 | 1003 |
| C | 0 | 7373 | 716 |
| D | 0 | 8229 | 780 |
| Mode SS | |||
|---|---|---|---|
| Quadrant | BADHDUFLAG | Total packets | Discarded packets |
| A | 0 | 65 | 5 |
| B | 0 | 66 | 4 |
| C | 0 | 65 | 8 |
| D | 0 | 66 | 10 |
| Quadrant | Total seconds | Saturated seconds | Saturation percentage |
|---|---|---|---|
| A | 2920 | 31 | 1.061644% |
| B | 2908 | 207 | 7.118294% |
| C | 2940 | 86 | 2.925170% |
| D | 2911 | 192 | 6.595672% |
Noise dominated data is calculated using 1-second bins in cleaned event files. If a bin has >2000 counts, and if more than 50% of those come from <1% of pixels, then it is considered to be noise-dominated and hence unusable.
| Quadrant | # 1 sec bins | Bins with >0 counts | Bins with >2000 counts | High rate bins dominated by noise | Noise dominated (total time) | Noise dominated (detector-on time) | Marked lightcurve |
|---|---|---|---|---|---|---|---|
| A | 4394 | 2968 | 0 | 0 | 0.00% | 0.00% | 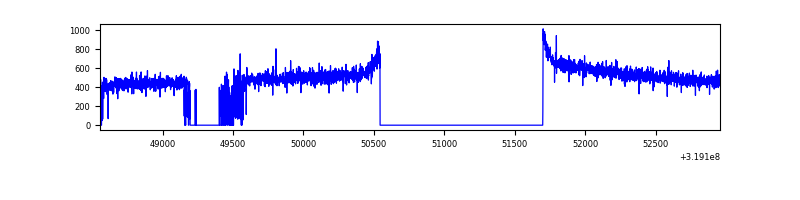 |
| B | 4390 | 2947 | 93 | 93 | 2.12% | 3.16% | 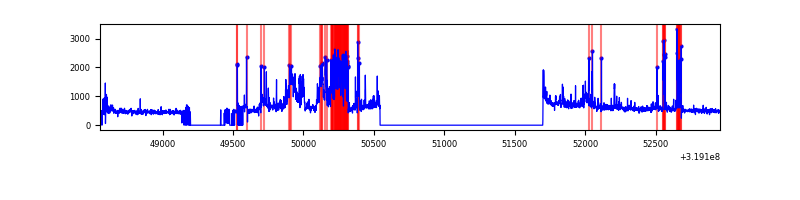 |
| C | 4400 | 2991 | 3 | 3 | 0.07% | 0.10% | 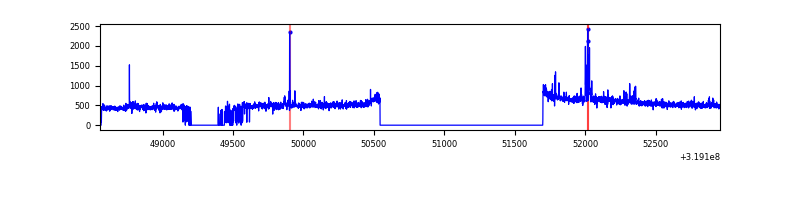 |
| D | 4392 | 2959 | 129 | 129 | 2.94% | 4.36% | 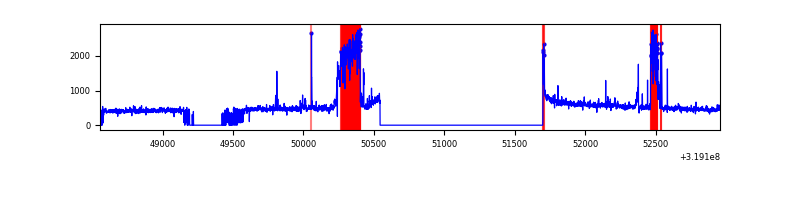 |
Top three noisy pixels from each quadrant. If the there are fewer than three noisy pixels in the level2.evt file, extra rows are filled as -1
| Pixel properties | Quadrant properties | ||||||
|---|---|---|---|---|---|---|---|
| Quadrant | DetID | PixID | Counts | Sigma | Mean | Median | Sigma |
| A | 13 | 254 | 5007 | 58.23 | 388 | 379 | 79.5 |
| A | 3 | 137 | 3339 | 37.24 | 388 | 379 | 79.5 |
| A | 0 | 226 | 3312 | 36.9 | 388 | 379 | 79.5 |
| B | 0 | 229 | 413177 | 5585.74 | 382 | 371 | 73.9 |
| B | 3 | 64 | 167227 | 2257.75 | 382 | 371 | 73.9 |
| B | 0 | 189 | 58413 | 785.37 | 382 | 371 | 73.9 |
| C | 14 | 238 | 59248 | 660.63 | 377 | 380 | 89.1 |
| C | 3 | 233 | 44766 | 498.11 | 377 | 380 | 89.1 |
| C | 7 | 247 | 15641 | 171.26 | 377 | 380 | 89.1 |
| D | 9 | 85 | 305777 | 3393.38 | 369 | 358 | 90.0 |
| D | 12 | 233 | 85198 | 942.62 | 369 | 358 | 90.0 |
| D | 1 | 52 | 30988 | 340.32 | 369 | 358 | 90.0 |
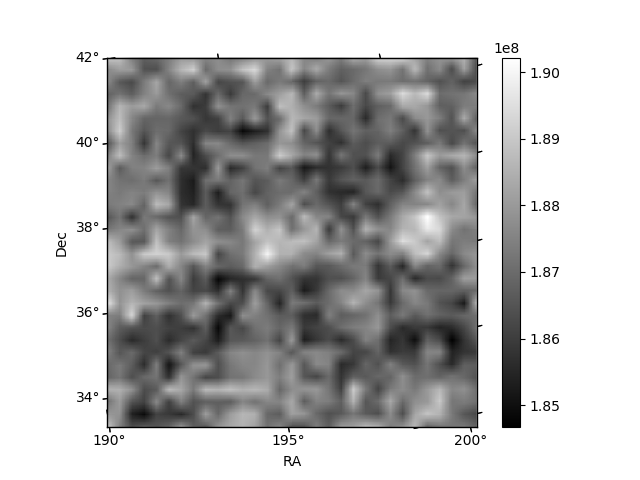
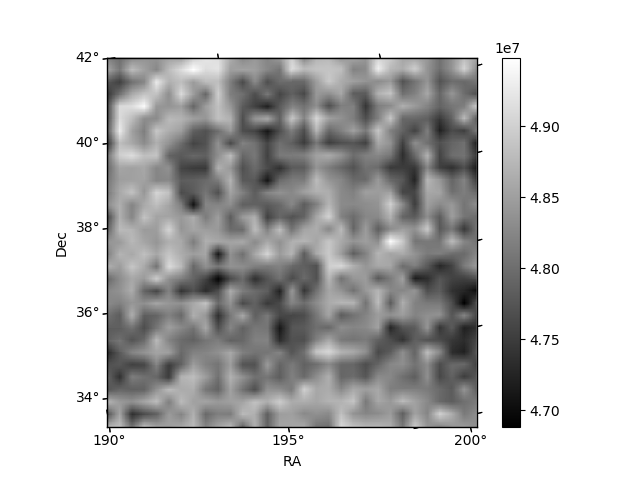
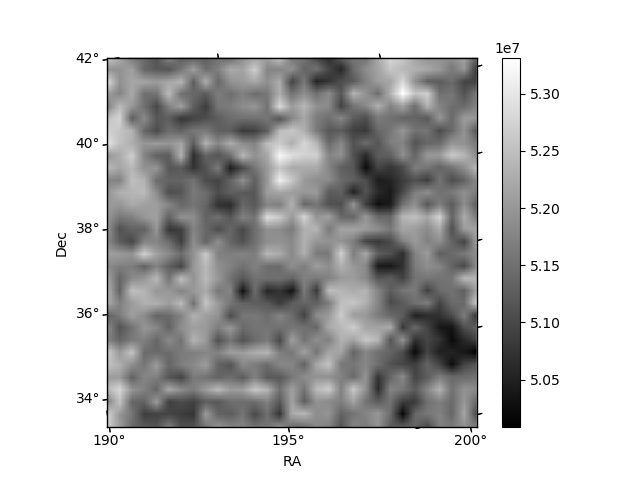
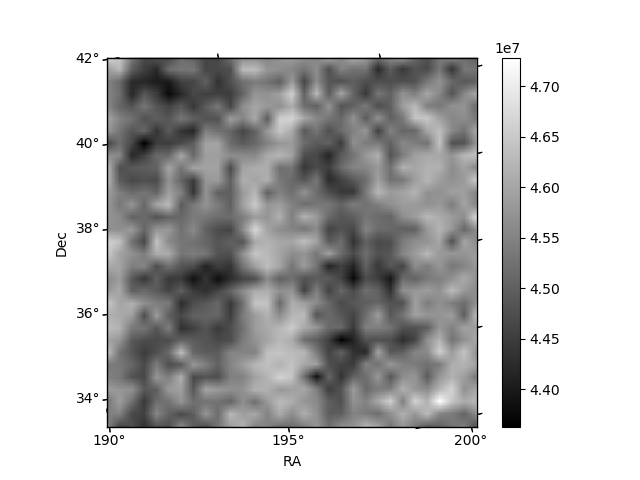
Histogram calculated using DETX and DETY for each event in the final _common_clean file
| Quadrant A | 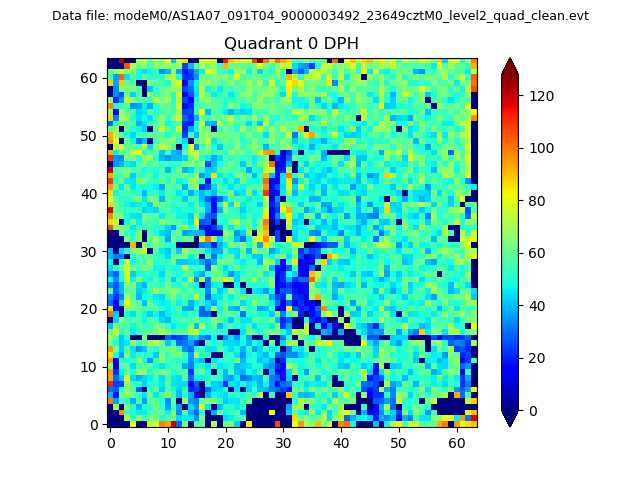 |
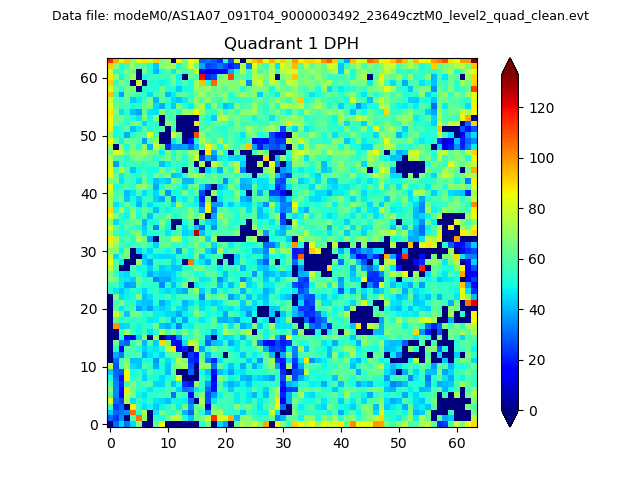 |
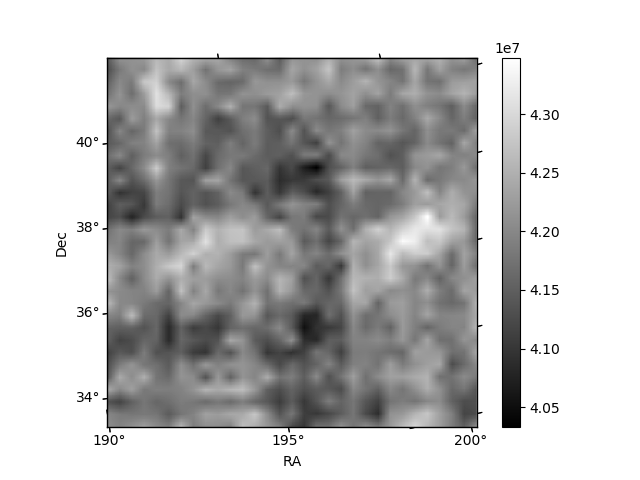
Quadrant B |
|---|---|---|---|
| Quadrant D |  |
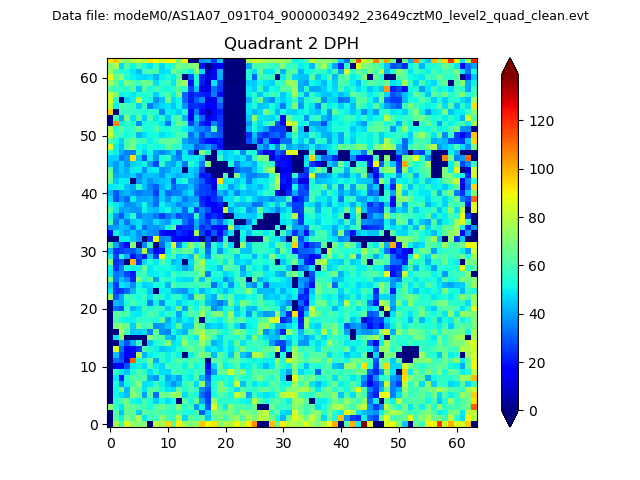 |
Quadrant C |
| Plot type | Count rate plots | Images |
|---|---|---|
| Comparison with Poisson distribution Blue bars denote a histogram of data divided into 1 sec bins. Red curve is a Poisson curve with rate = median count rate of data. |
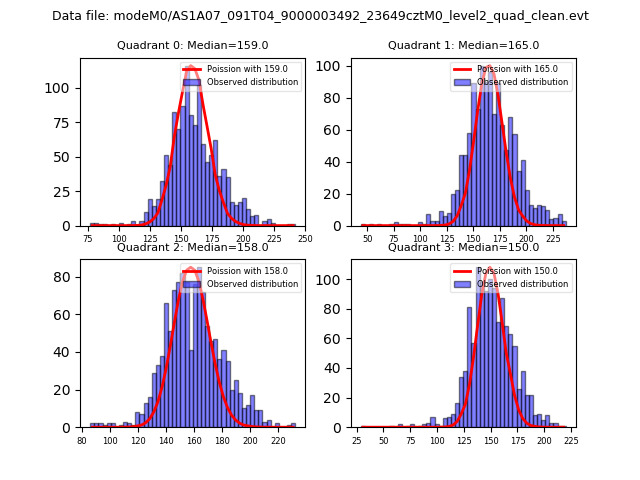 |
 |
| Quadrant-wise count rates Data is divided into 100 sec bins |
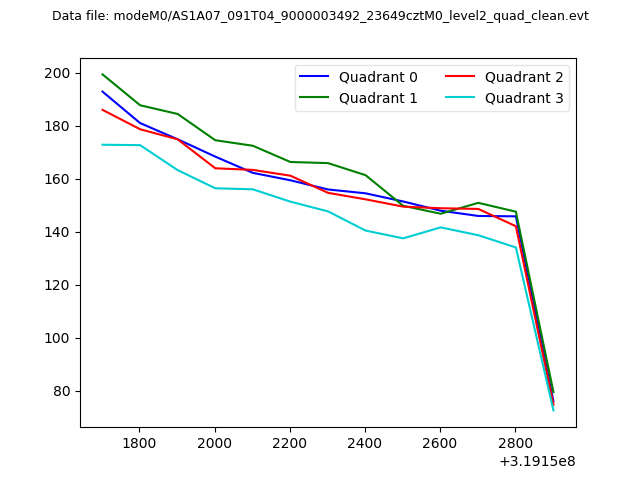 |
|
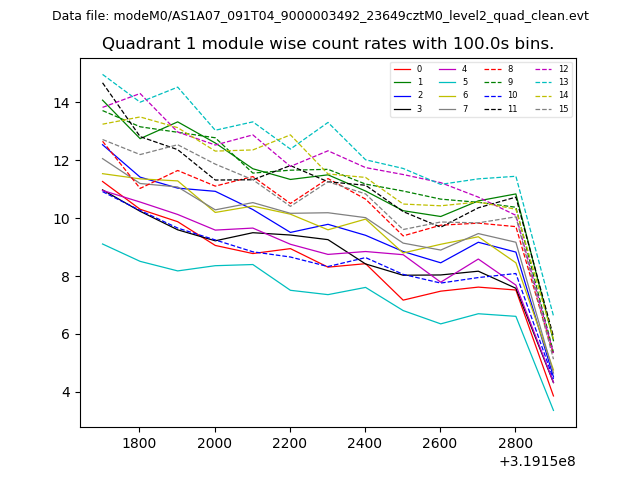
| Module-wise count rates for Quadrant A Data is divided into 100 sec bins |
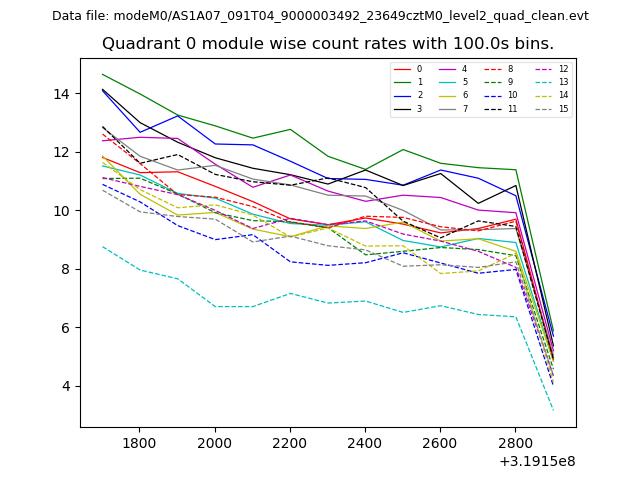 |
 |
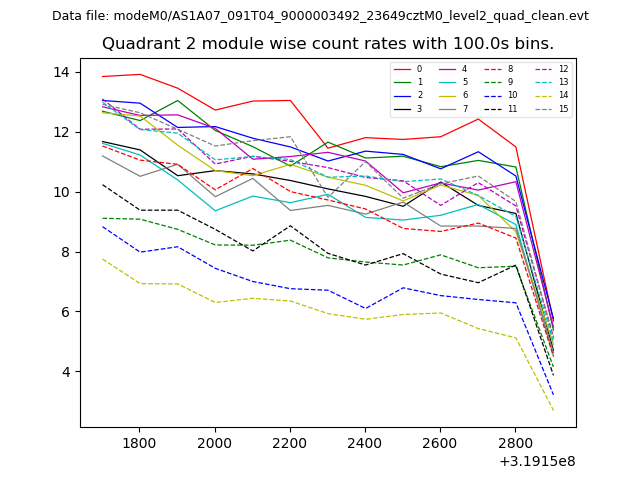
| Module-wise count rates for Quadrant B Data is divided into 100 sec bins |
 |
 |
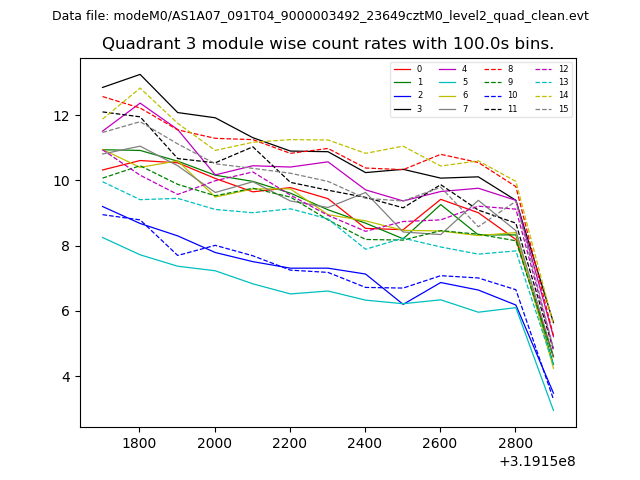
| Module-wise count rates for Quadrant C Data is divided into 100 sec bins |
 |
 |
| Module-wise count rates for Quadrant D Data is divided into 100 sec bins |
 |
 |
| Parameter | Plot |
|---|---|
| CZT HV Monitor |  |
| D_VDD | 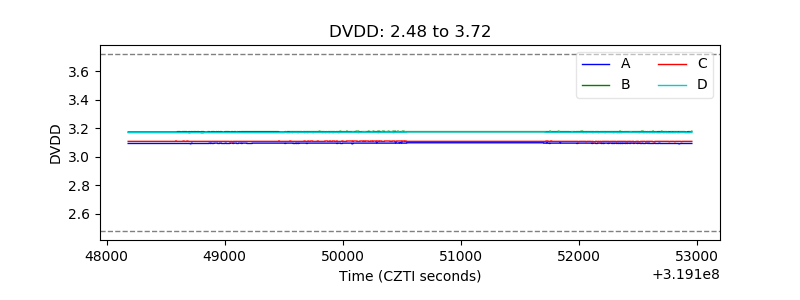 |
| Temperature 1 | 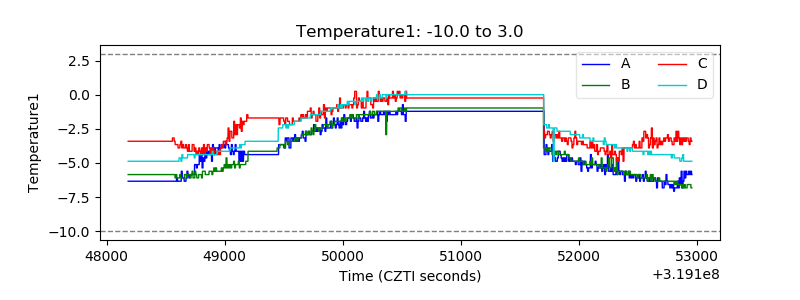 |
| Veto HV Monitor | 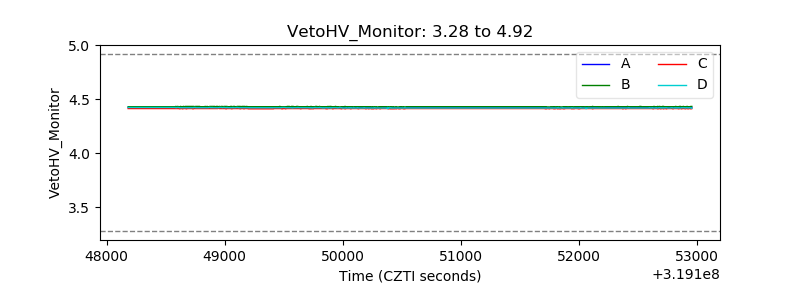 |
| Veto LLD | 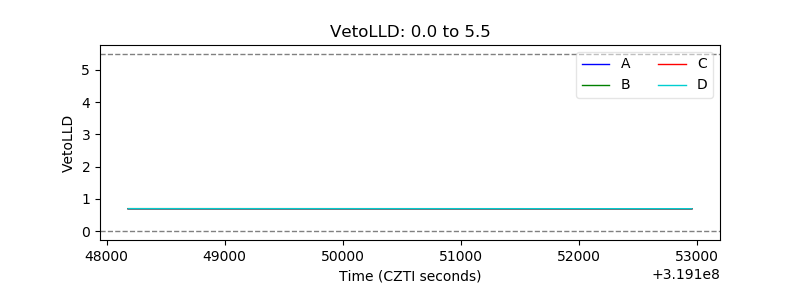 |
| Alpha Counter | 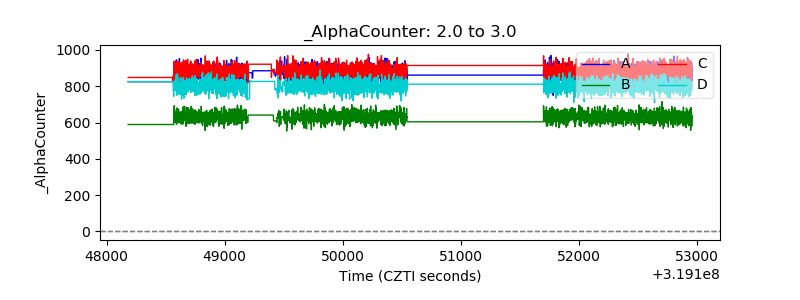 |
| _CPM_Rate | 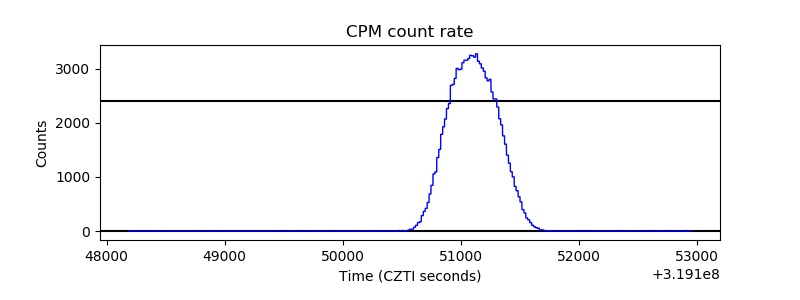 |
| CZT Counter | 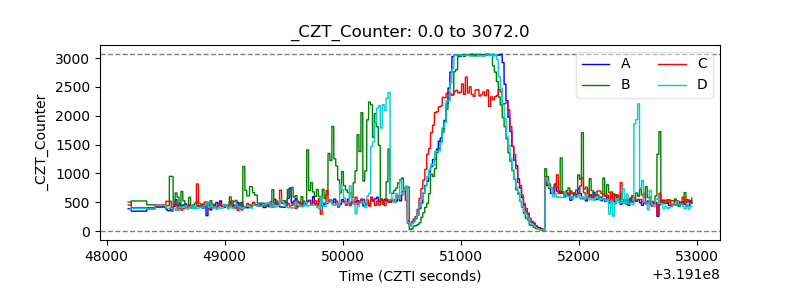 |
| +2.5 Volts monitor |  |
| +5 Volts monitor | 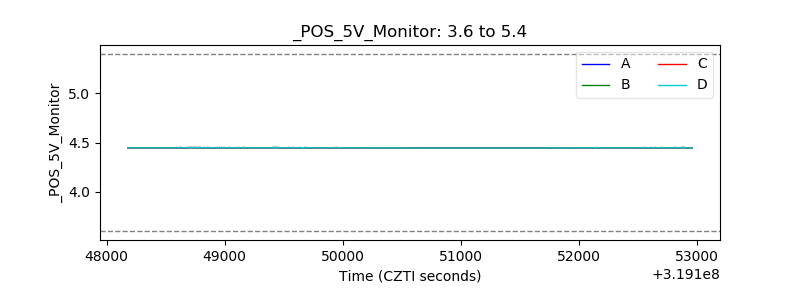 |
| _ROLL_ROT | 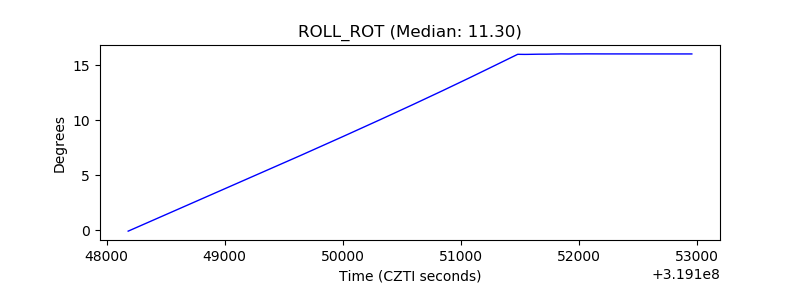 |
| _Roll_DEC | 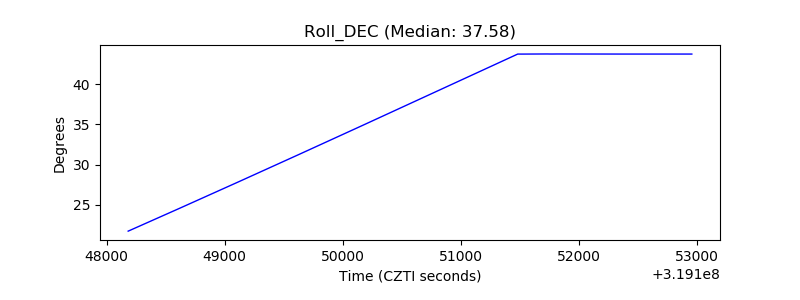 |
| _Roll_RA | 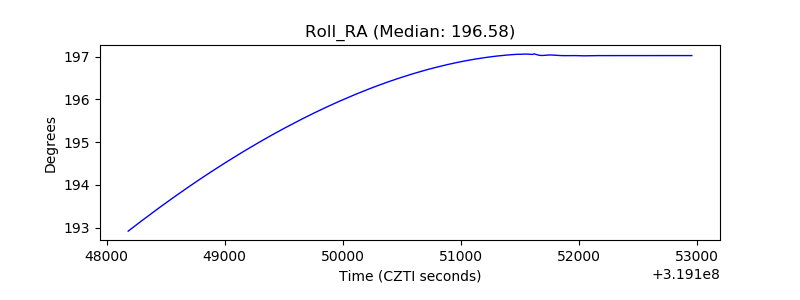 |
| Veto Counter | 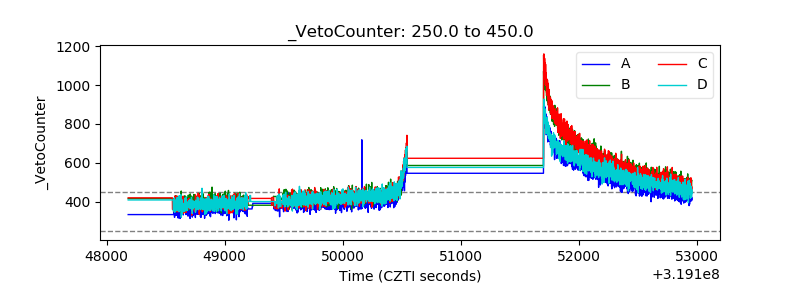 |