| Param | Original file | Final file |
|---|---|---|
| Filename | modeM0/AS1A07_091T04_9000003492_23652cztM0_level2.evt | modeM0/AS1A07_091T04_9000003492_23652cztM0_level2_quad_clean.evt |
| Size (bytes) | 331,128,000 | 62,683,200 |
| Size | 315.8 MB | 59.8 MB |
| Events in quadrant A | 2,302,235 | 393,751 |
| Events in quadrant B | 2,613,963 | 416,227 |
| Events in quadrant C | 2,350,004 | 394,945 |
| Events in quadrant D | 2,448,696 | 369,914 |
| Mode M9 | |||
|---|---|---|---|
| Quadrant | BADHDUFLAG | Total packets | Discarded packets |
| A | 0 | 9 | 0 |
| B | 0 | 9 | 0 |
| C | 0 | 9 | 0 |
| D | 0 | 9 | 0 |
| Mode M0 | |||
|---|---|---|---|
| Quadrant | BADHDUFLAG | Total packets | Discarded packets |
| A | 0 | 11230 | 1620 |
| B | 0 | 12239 | 1596 |
| C | 0 | 11318 | 1524 |
| D | 0 | 12360 | 2076 |
| Mode SS | |||
|---|---|---|---|
| Quadrant | BADHDUFLAG | Total packets | Discarded packets |
| A | 0 | 107 | 15 |
| B | 0 | 109 | 17 |
| C | 0 | 107 | 15 |
| D | 0 | 108 | 12 |
| Quadrant | Total seconds | Saturated seconds | Saturation percentage |
|---|---|---|---|
| A | 4572 | 14 | 0.306212% |
| B | 4613 | 51 | 1.105571% |
| C | 4615 | 50 | 1.083424% |
| D | 4556 | 38 | 0.834065% |
Noise dominated data is calculated using 1-second bins in cleaned event files. If a bin has >2000 counts, and if more than 50% of those come from <1% of pixels, then it is considered to be noise-dominated and hence unusable.
| Quadrant | # 1 sec bins | Bins with >0 counts | Bins with >2000 counts | High rate bins dominated by noise | Noise dominated (total time) | Noise dominated (detector-on time) | Marked lightcurve |
|---|---|---|---|---|---|---|---|
| A | 7514 | 4757 | 1 | 1 | 0.01% | 0.02% |  |
| B | 7522 | 4794 | 11 | 11 | 0.15% | 0.23% |  |
| C | 7498 | 4801 | 0 | 0 | 0.00% | 0.00% | 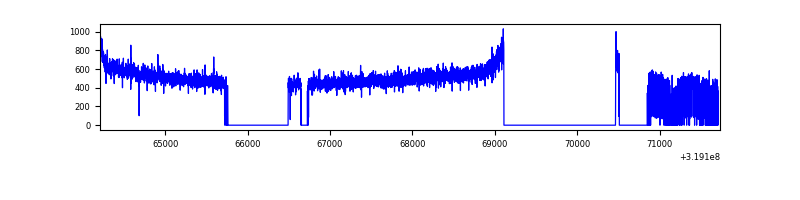 |
| D | 7506 | 4734 | 26 | 26 | 0.35% | 0.55% | 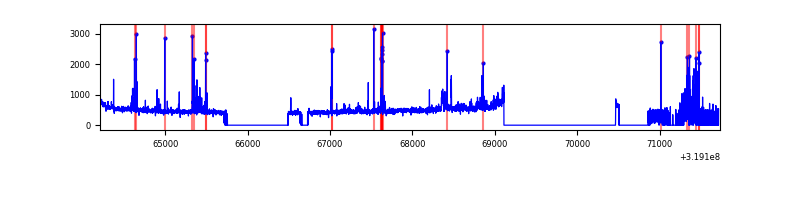 |
Top three noisy pixels from each quadrant. If the there are fewer than three noisy pixels in the level2.evt file, extra rows are filled as -1
| Pixel properties | Quadrant properties | ||||||
|---|---|---|---|---|---|---|---|
| Quadrant | DetID | PixID | Counts | Sigma | Mean | Median | Sigma |
| A | 15 | 223 | 11739 | 93.85 | 594 | 583 | 118.9 |
| A | 13 | 254 | 7082 | 54.67 | 594 | 583 | 118.9 |
| A | 0 | 226 | 5041 | 37.5 | 594 | 583 | 118.9 |
| B | 3 | 64 | 84050 | 738.35 | 601 | 587 | 113.0 |
| B | 0 | 189 | 66506 | 583.15 | 601 | 587 | 113.0 |
| B | 0 | 229 | 45167 | 394.37 | 601 | 587 | 113.0 |
| C | 14 | 238 | 93707 | 698.42 | 576 | 581 | 133.3 |
| C | 7 | 247 | 5539 | 37.18 | 576 | 581 | 133.3 |
| C | 13 | 61 | 4041 | 25.95 | 576 | 581 | 133.3 |
| D | 1 | 52 | 124803 | 892.82 | 572 | 556 | 139.2 |
| D | 13 | 189 | 105471 | 753.91 | 572 | 556 | 139.2 |
| D | 9 | 85 | 19838 | 138.56 | 572 | 556 | 139.2 |
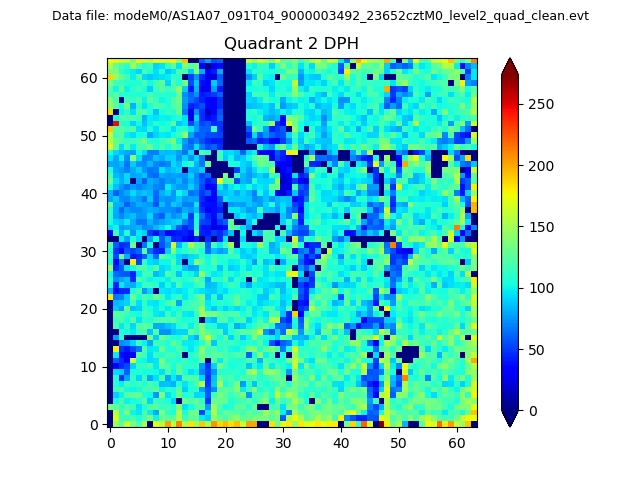
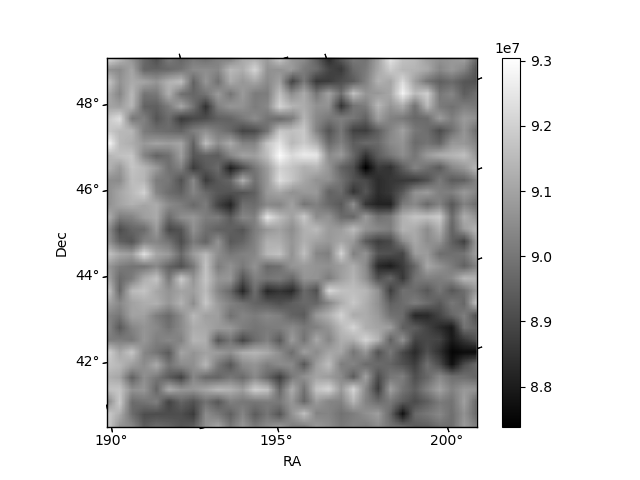
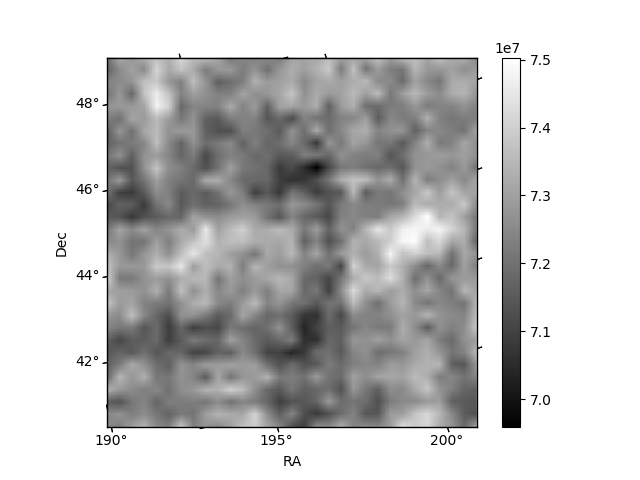
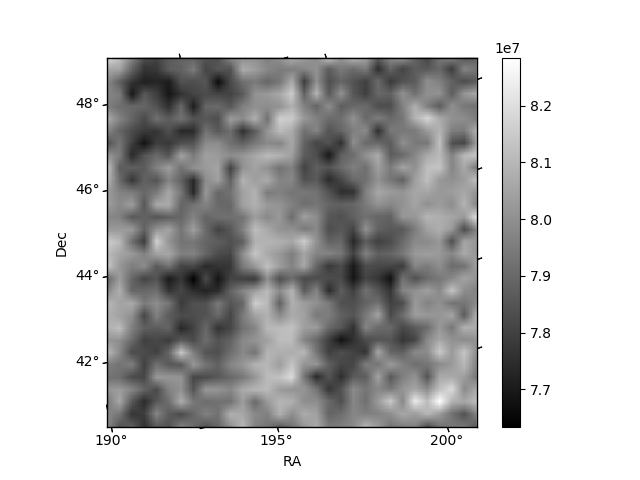
Histogram calculated using DETX and DETY for each event in the final _common_clean file
| Quadrant A | 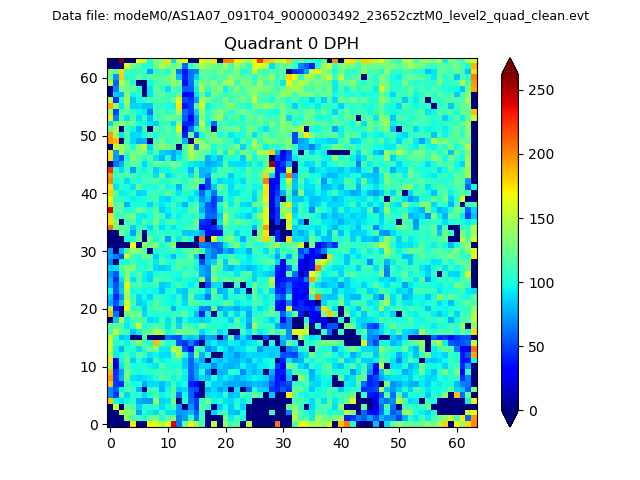 |
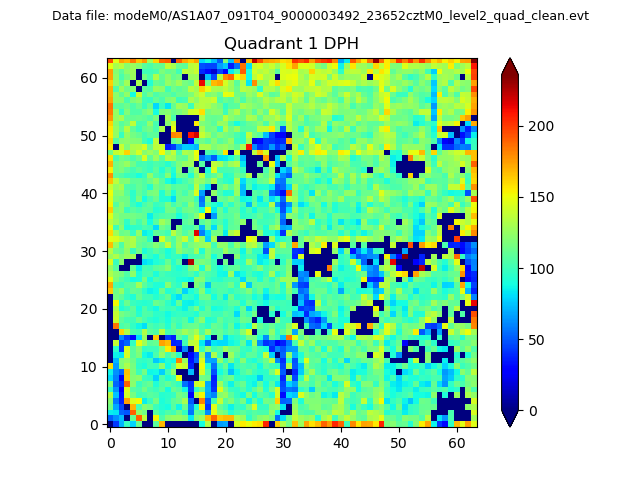 |
Quadrant B |
|---|---|---|---|
| Quadrant D | 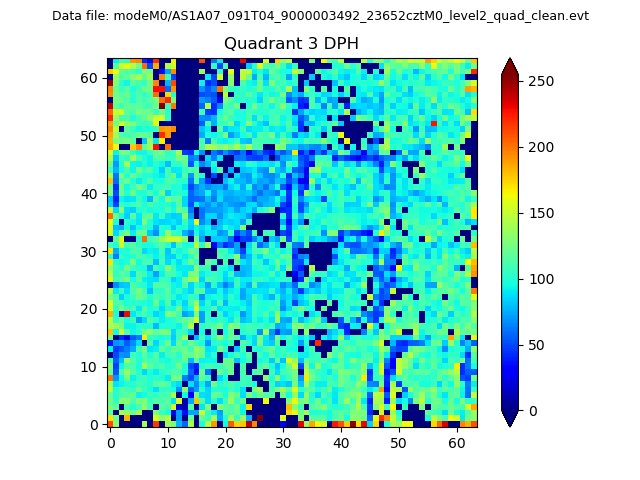 |
 |
Quadrant C |
| Plot type | Count rate plots | Images |
|---|---|---|
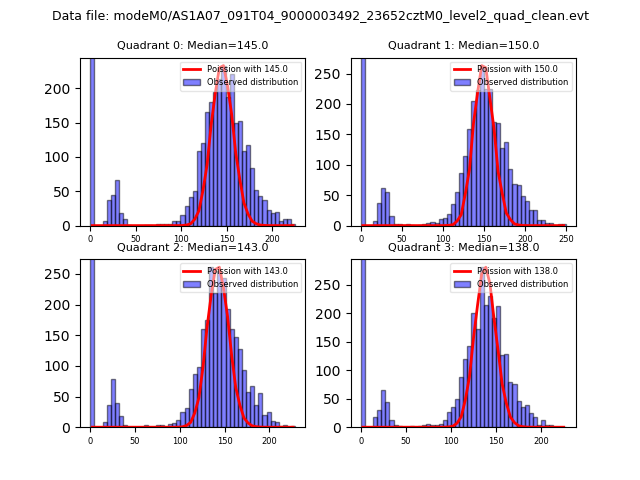
| Comparison with Poisson distribution Blue bars denote a histogram of data divided into 1 sec bins. Red curve is a Poisson curve with rate = median count rate of data. |
 |
 |
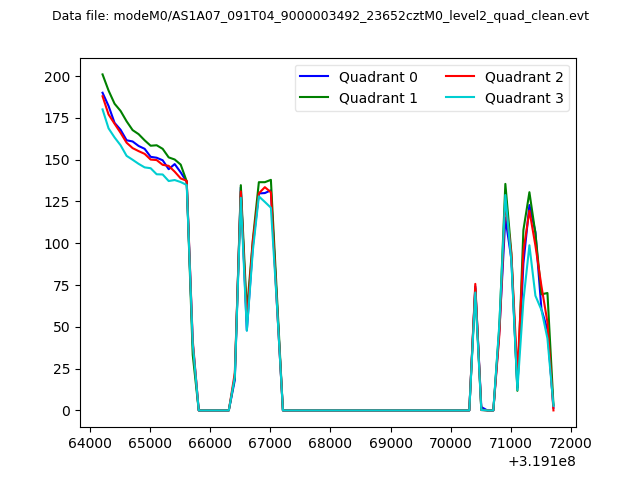
| Quadrant-wise count rates Data is divided into 100 sec bins |
 |
|
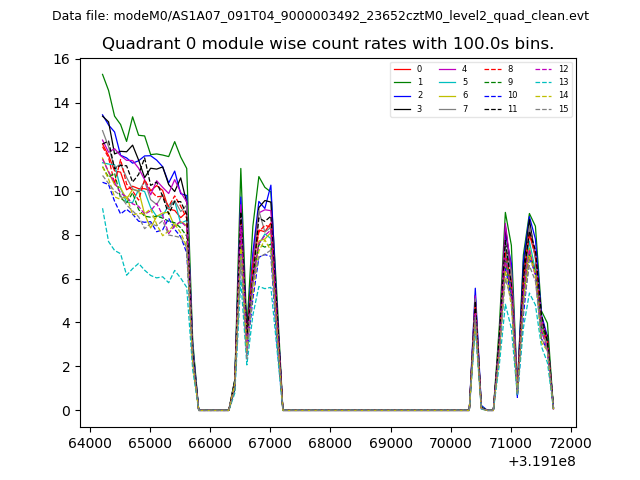
| Module-wise count rates for Quadrant A Data is divided into 100 sec bins |
 |
 |
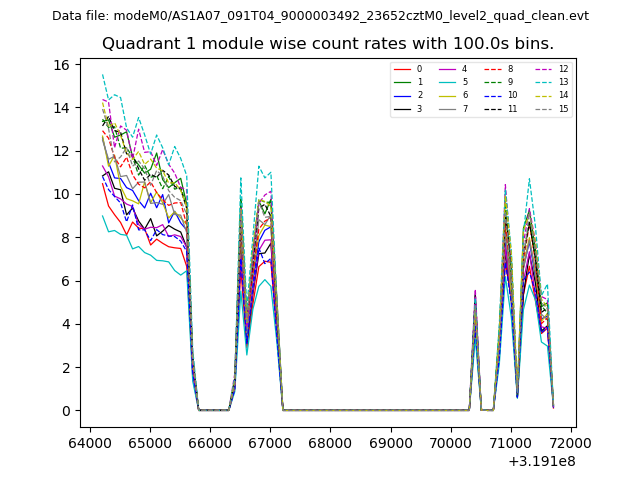
| Module-wise count rates for Quadrant B Data is divided into 100 sec bins |
 |
 |
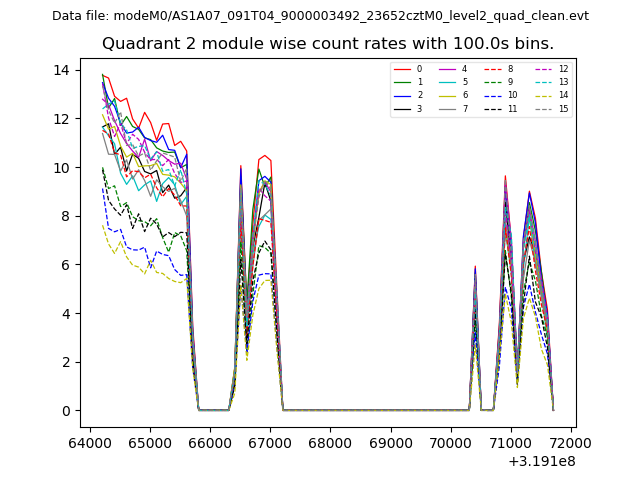
| Module-wise count rates for Quadrant C Data is divided into 100 sec bins |
 |
 |
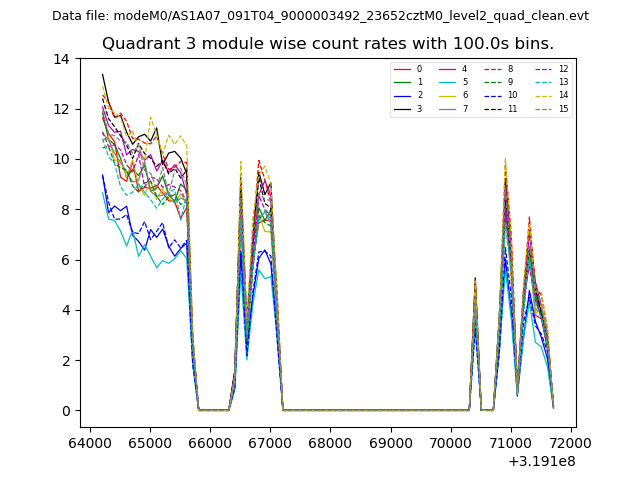
| Module-wise count rates for Quadrant D Data is divided into 100 sec bins |
 |
 |
| Parameter | Plot |
|---|---|
| CZT HV Monitor | 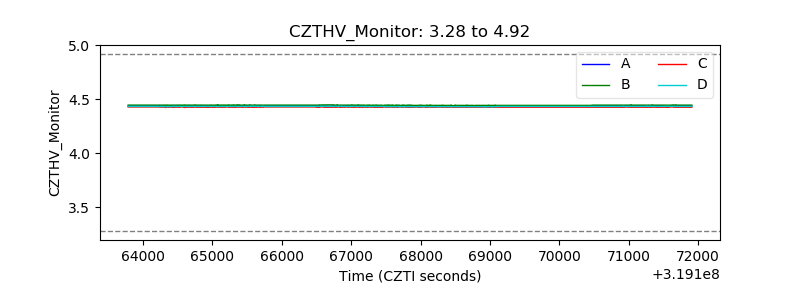 |
| D_VDD |  |
| Temperature 1 | 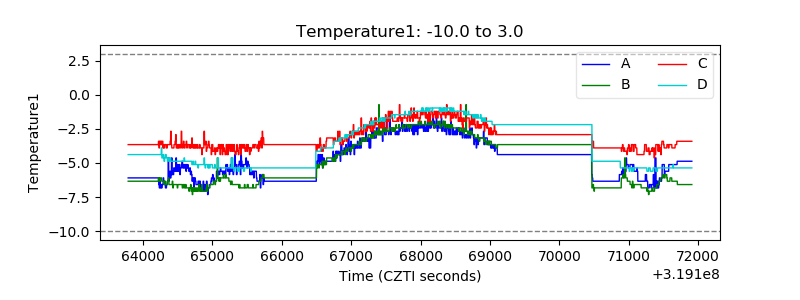 |
| Veto HV Monitor |  |
| Veto LLD | 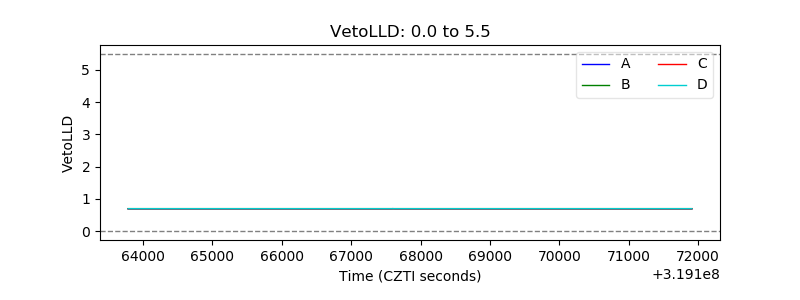 |
| Alpha Counter | 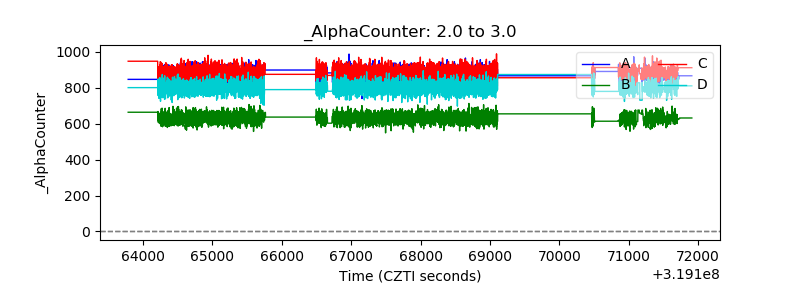 |
| _CPM_Rate | 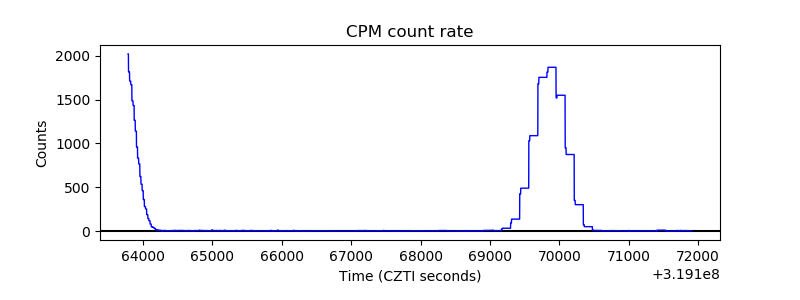 |
| CZT Counter | 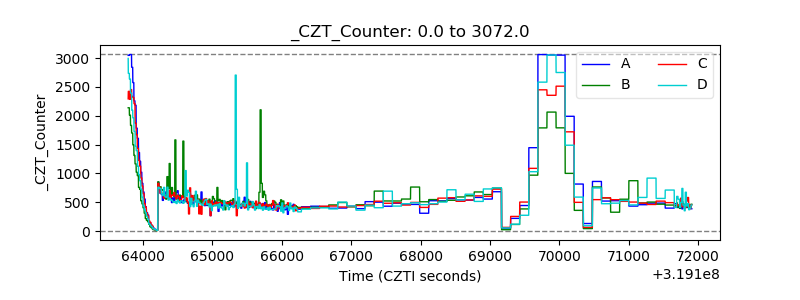 |
| +2.5 Volts monitor |  |
| +5 Volts monitor |  |
| _ROLL_ROT | 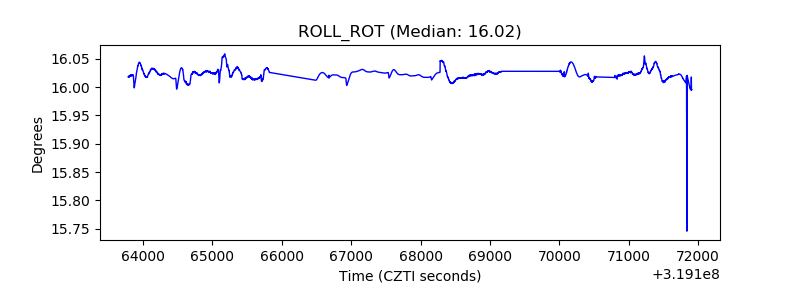 |
| _Roll_DEC | 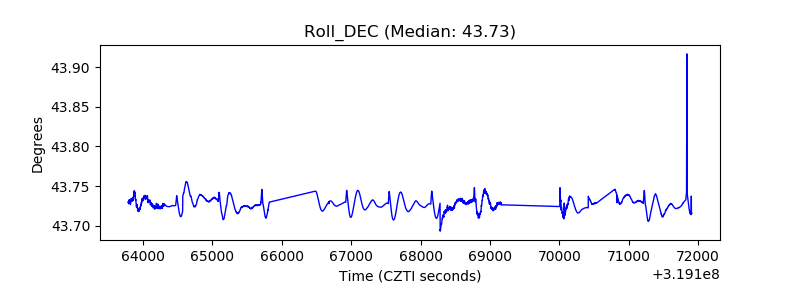 |
| _Roll_RA | 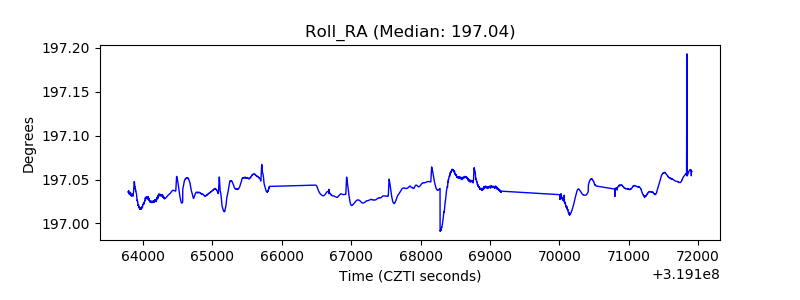 |
| Veto Counter | 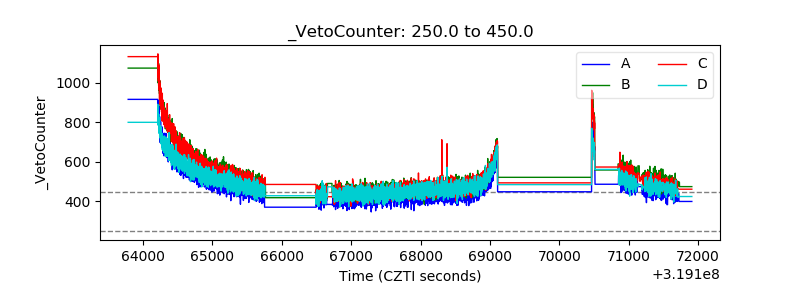 |