| Param | Original file | Final file |
|---|---|---|
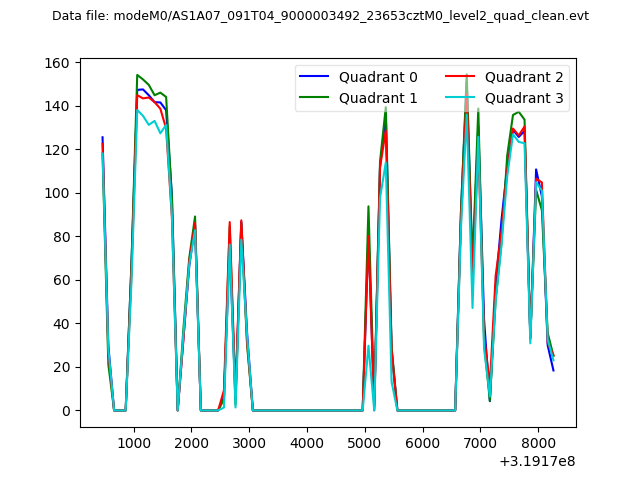
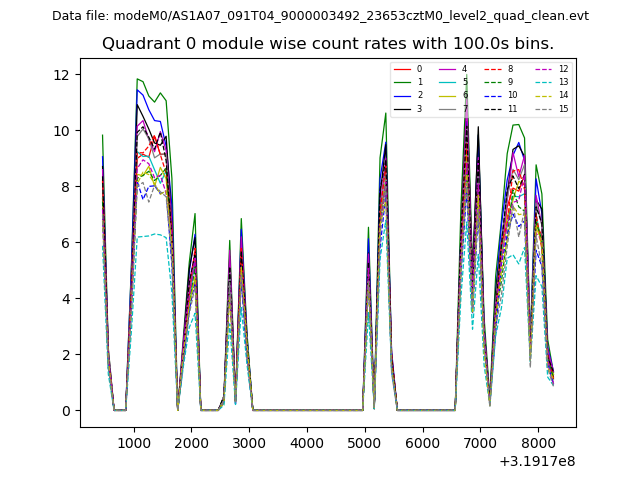
| Filename | modeM0/AS1A07_091T04_9000003492_23653cztM0_level2.evt | modeM0/AS1A07_091T04_9000003492_23653cztM0_level2_quad_clean.evt |
| Size (bytes) | 283,432,320 | 51,975,360 |
| Size | 270.3 MB | 49.6 MB |
| Events in quadrant A | 1,798,601 | 334,946 |
| Events in quadrant B | 2,086,864 | 340,729 |
| Events in quadrant C | 1,819,849 | 330,404 |
| Events in quadrant D | 2,624,608 | 305,010 |
| Mode M9 | |||
|---|---|---|---|
| Quadrant | BADHDUFLAG | Total packets | Discarded packets |
| A | 0 | 20 | 5 |
| B | 0 | 22 | 7 |
| C | 0 | 21 | 6 |
| D | 0 | 20 | 5 |
| Mode M0 | |||
|---|---|---|---|
| Quadrant | BADHDUFLAG | Total packets | Discarded packets |
| A | 0 | 10598 | 2858 |
| B | 0 | 11586 | 3087 |
| C | 0 | 10659 | 2856 |
| D | 0 | 14617 | 4264 |
| Mode SS | |||
|---|---|---|---|
| Quadrant | BADHDUFLAG | Total packets | Discarded packets |
| A | 0 | 105 | 31 |
| B | 0 | 103 | 30 |
| C | 0 | 107 | 37 |
| D | 0 | 101 | 22 |
| Quadrant | Total seconds | Saturated seconds | Saturation percentage |
|---|---|---|---|
| A | 3723 | 22 | 0.590921% |
| B | 3723 | 108 | 2.900886% |
| C | 3747 | 39 | 1.040833% |
| D | 3648 | 175 | 4.797149% |
Noise dominated data is calculated using 1-second bins in cleaned event files. If a bin has >2000 counts, and if more than 50% of those come from <1% of pixels, then it is considered to be noise-dominated and hence unusable.
| Quadrant | # 1 sec bins | Bins with >0 counts | Bins with >2000 counts | High rate bins dominated by noise | Noise dominated (total time) | Noise dominated (detector-on time) | Marked lightcurve |
|---|---|---|---|---|---|---|---|
| A | 11070 | 4012 | 0 | 0 | 0.00% | 0.00% |  |
| B | 11072 | 4002 | 62 | 62 | 0.56% | 1.55% | 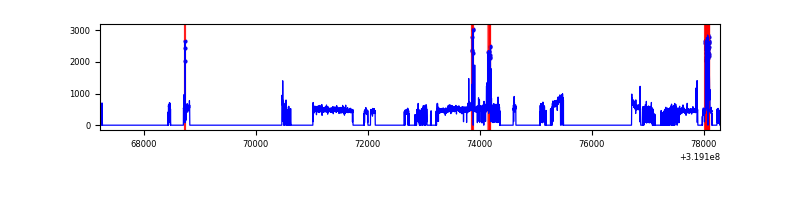 |
| C | 11071 | 4016 | 0 | 0 | 0.00% | 0.00% | 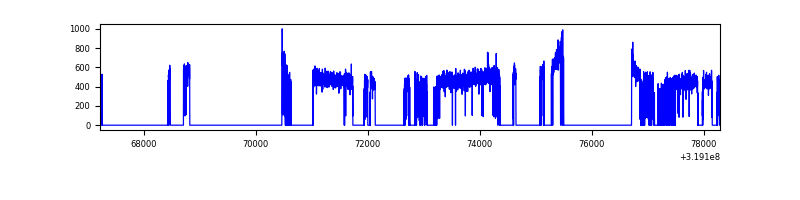 |
| D | 11070 | 3937 | 109 | 109 | 0.98% | 2.77% | 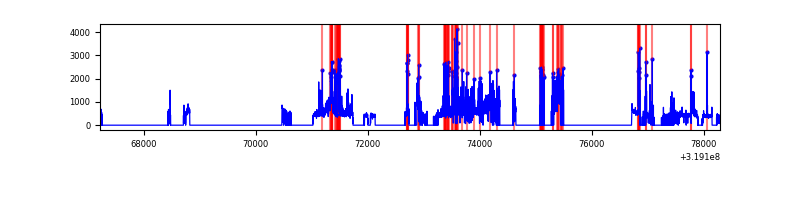 |
Top three noisy pixels from each quadrant. If the there are fewer than three noisy pixels in the level2.evt file, extra rows are filled as -1
| Pixel properties | Quadrant properties | ||||||
|---|---|---|---|---|---|---|---|
| Quadrant | DetID | PixID | Counts | Sigma | Mean | Median | Sigma |
| A | 13 | 254 | 5618 | 55.27 | 467 | 457 | 93.4 |
| A | 3 | 137 | 4150 | 39.55 | 467 | 457 | 93.4 |
| A | 0 | 226 | 4060 | 38.59 | 467 | 457 | 93.4 |
| B | 3 | 64 | 136833 | 1548.14 | 462 | 452 | 88.1 |
| B | 0 | 229 | 61571 | 693.8 | 462 | 452 | 88.1 |
| B | 0 | 189 | 50623 | 569.52 | 462 | 452 | 88.1 |
| C | 14 | 238 | 72809 | 698.05 | 446 | 448 | 103.7 |
| C | 7 | 247 | 4939 | 43.32 | 446 | 448 | 103.7 |
| C | 13 | 61 | 3160 | 26.16 | 446 | 448 | 103.7 |
| D | 1 | 52 | 595269 | 5688.38 | 429 | 416 | 104.6 |
| D | 9 | 85 | 289523 | 2764.63 | 429 | 416 | 104.6 |
| D | 13 | 189 | 90271 | 859.25 | 429 | 416 | 104.6 |
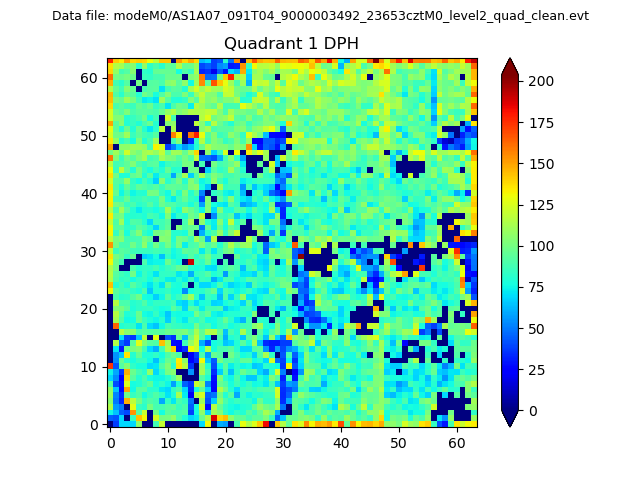
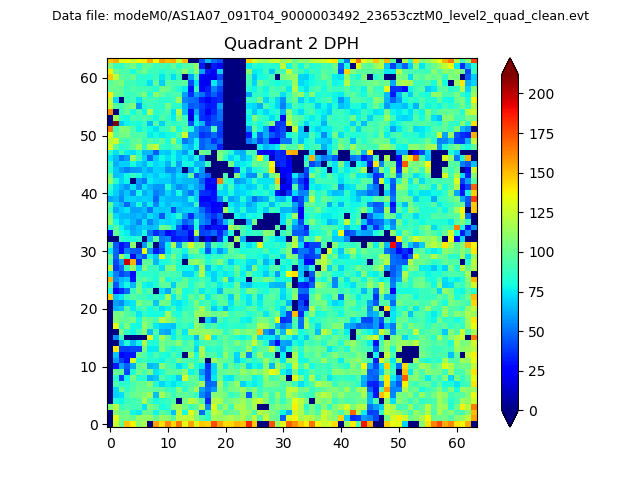
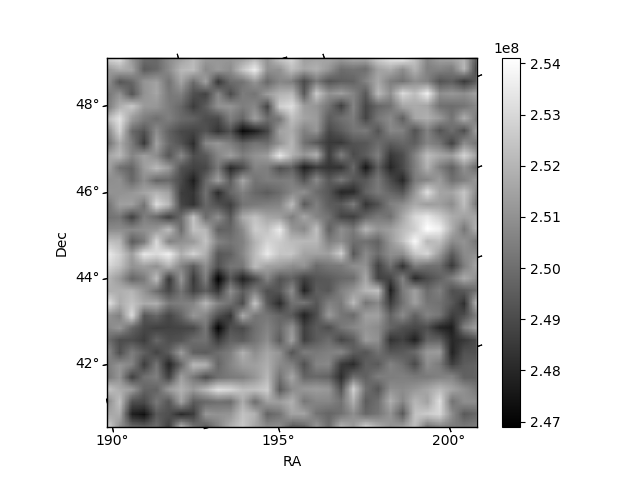
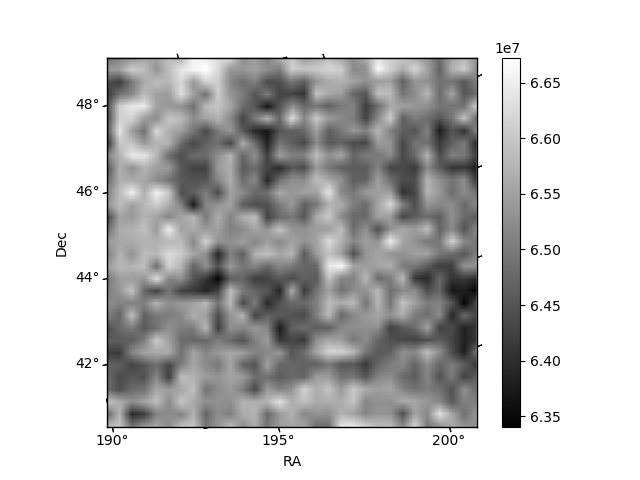
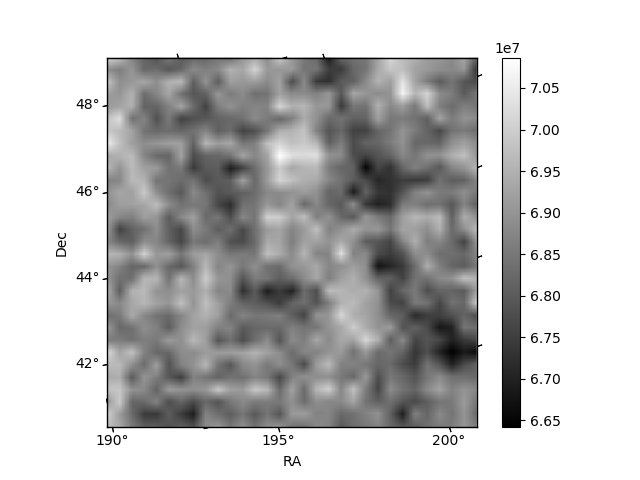
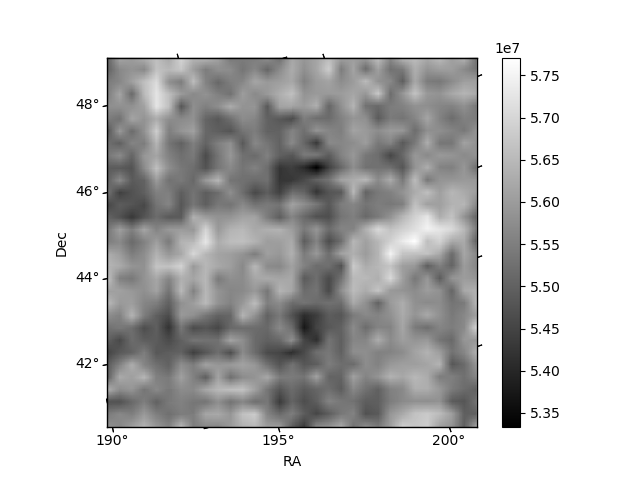
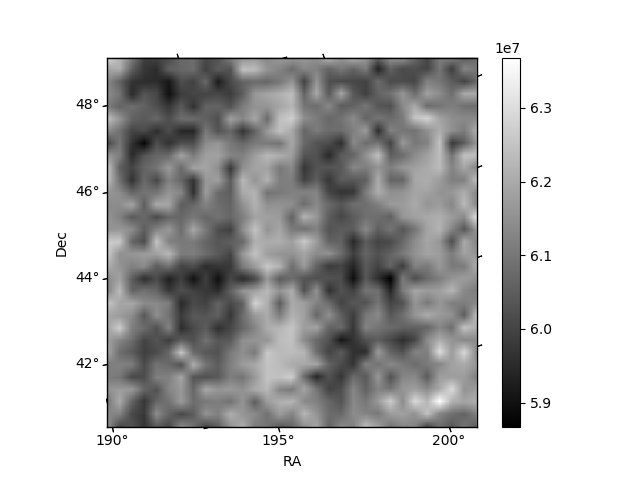
Histogram calculated using DETX and DETY for each event in the final _common_clean file
| Quadrant A | 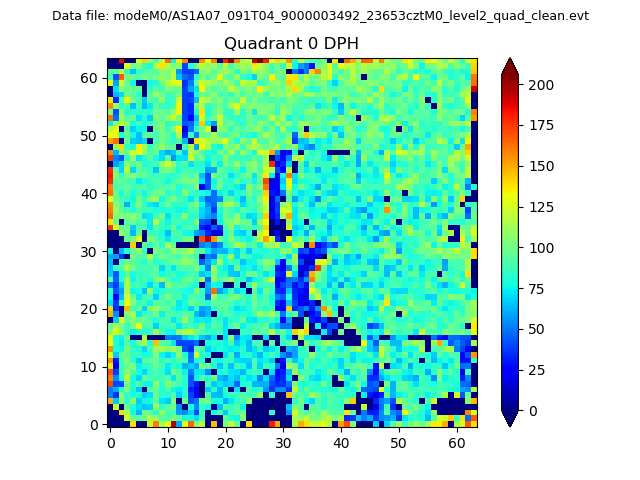 |
 |
Quadrant B |
|---|---|---|---|
| Quadrant D | 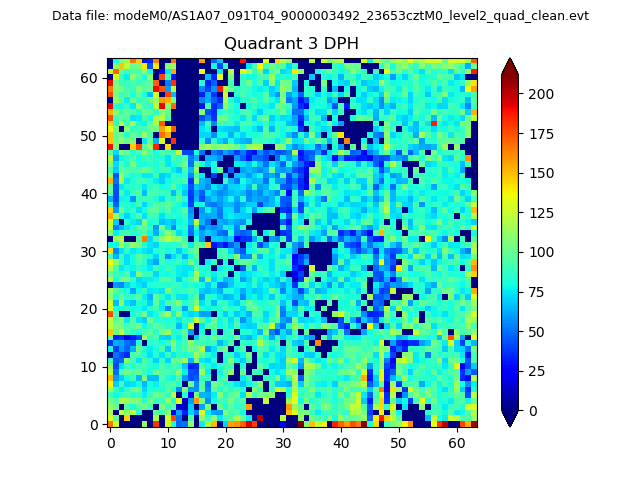 |
 |
Quadrant C |
| Plot type | Count rate plots | Images |
|---|---|---|
| Comparison with Poisson distribution Blue bars denote a histogram of data divided into 1 sec bins. Red curve is a Poisson curve with rate = median count rate of data. |
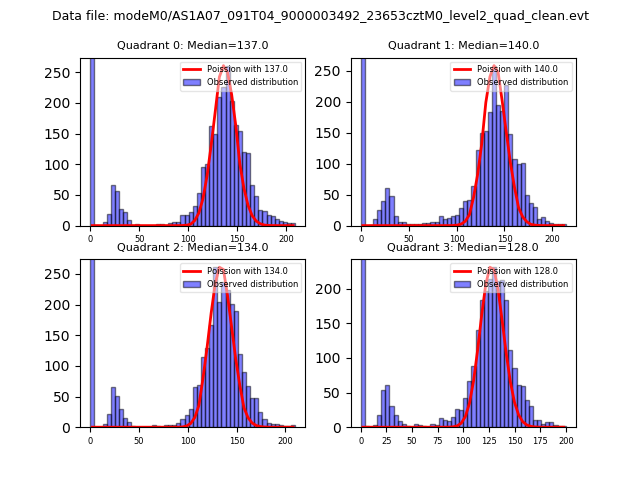 |
 |
| Quadrant-wise count rates Data is divided into 100 sec bins |
 |
|
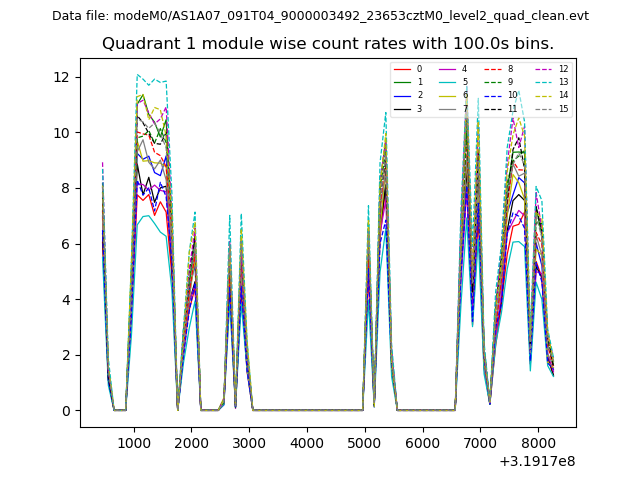
| Module-wise count rates for Quadrant A Data is divided into 100 sec bins |
 |
 |
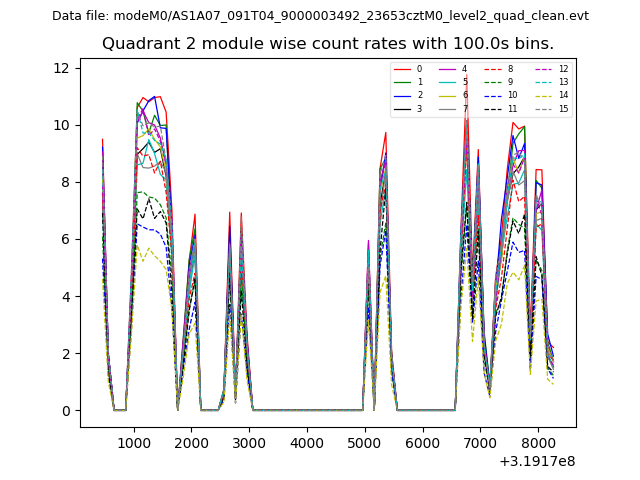
| Module-wise count rates for Quadrant B Data is divided into 100 sec bins |
 |
 |
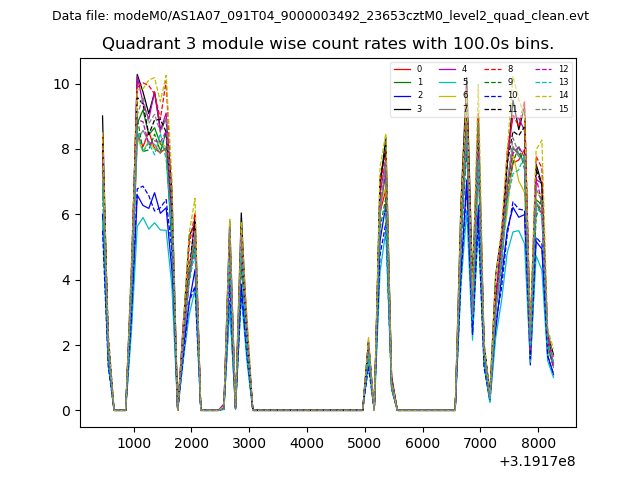
| Module-wise count rates for Quadrant C Data is divided into 100 sec bins |
 |
 |
| Module-wise count rates for Quadrant D Data is divided into 100 sec bins |
 |
 |
| Parameter | Plot |
|---|---|
| CZT HV Monitor | 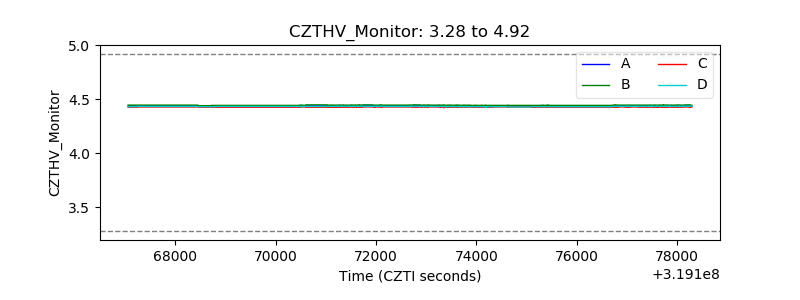 |
| D_VDD | 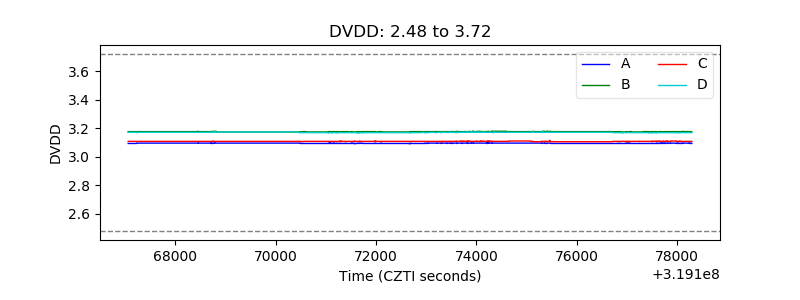 |
| Temperature 1 | 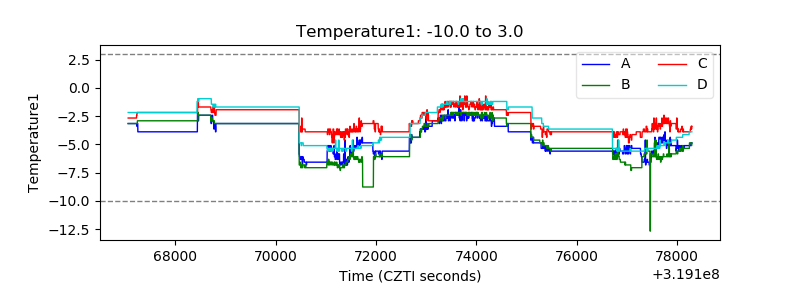 |
| Veto HV Monitor | 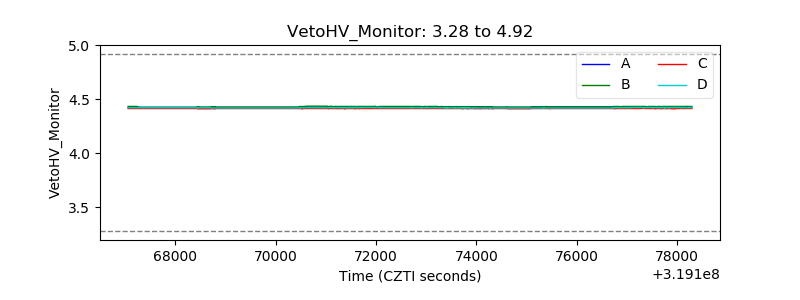 |
| Veto LLD | 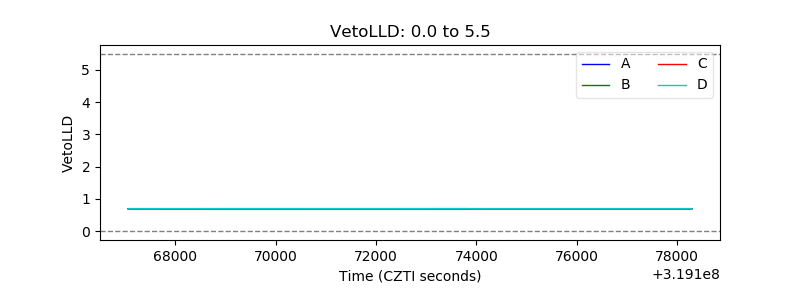 |
| Alpha Counter | 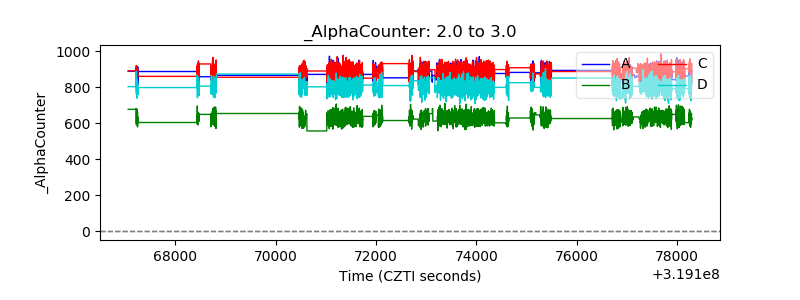 |
| _CPM_Rate | 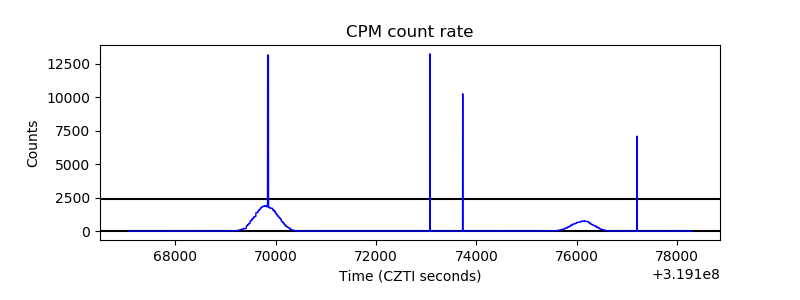 |
| CZT Counter | 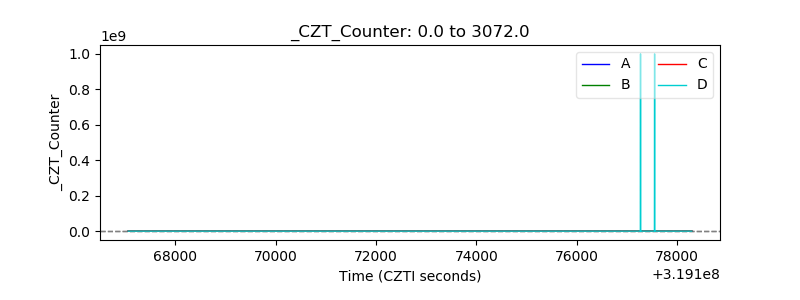 |
| +2.5 Volts monitor |  |
| +5 Volts monitor |  |
| _ROLL_ROT | 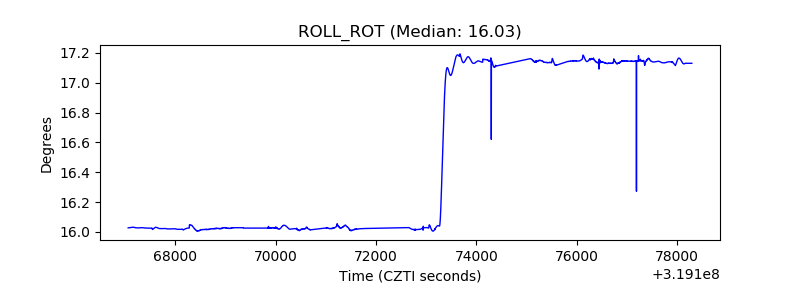 |
| _Roll_DEC | 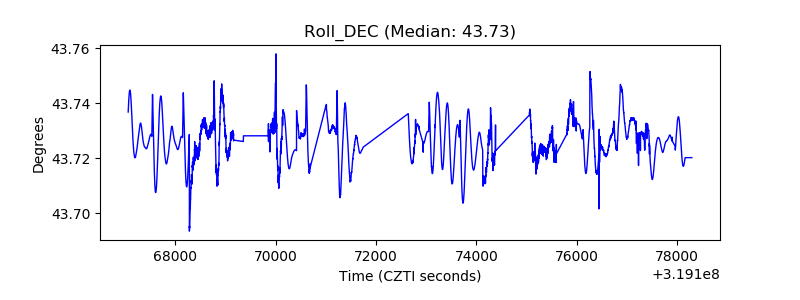 |
| _Roll_RA | 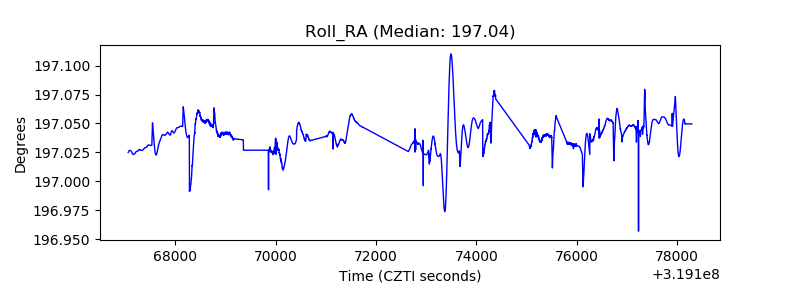 |
| Veto Counter | 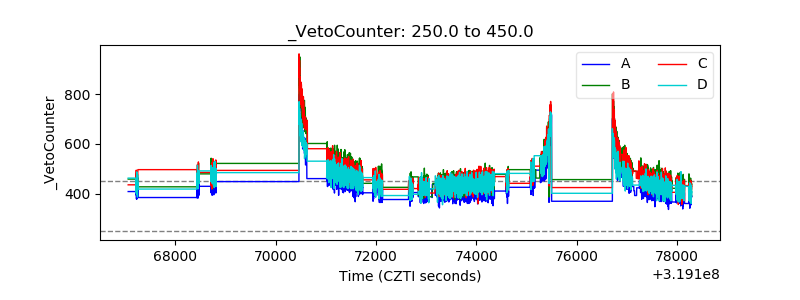 |