| Param | Original file | Final file |
|---|---|---|
| Filename | modeM0/AS1A07_091T04_9000003492_23655cztM0_level2.evt | modeM0/AS1A07_091T04_9000003492_23655cztM0_level2_quad_clean.evt |
| Size (bytes) | 447,664,320 | 91,224,000 |
| Size | 426.9 MB | 87.0 MB |
| Events in quadrant A | 3,112,463 | 576,087 |
| Events in quadrant B | 3,486,314 | 590,111 |
| Events in quadrant C | 3,138,379 | 571,295 |
| Events in quadrant D | 3,362,193 | 555,572 |
| Mode M9 | |||
|---|---|---|---|
| Quadrant | BADHDUFLAG | Total packets | Discarded packets |
| A | 0 | 5 | 0 |
| B | 0 | 5 | 0 |
| C | 0 | 5 | 0 |
| D | 0 | 5 | 0 |
| Mode M0 | |||
|---|---|---|---|
| Quadrant | BADHDUFLAG | Total packets | Discarded packets |
| A | 0 | 13728 | 1 |
| B | 0 | 14636 | 1 |
| C | 0 | 13733 | 1 |
| D | 0 | 14723 | 1 |
| Mode SS | |||
|---|---|---|---|
| Quadrant | BADHDUFLAG | Total packets | Discarded packets |
| A | 0 | 136 | 0 |
| B | 0 | 136 | 0 |
| C | 0 | 136 | 0 |
| D | 0 | 136 | 0 |
| Quadrant | Total seconds | Saturated seconds | Saturation percentage |
|---|---|---|---|
| A | 6739 | 101 | 1.498739% |
| B | 6739 | 130 | 1.929070% |
| C | 6740 | 109 | 1.617211% |
| D | 6739 | 121 | 1.795519% |
Noise dominated data is calculated using 1-second bins in cleaned event files. If a bin has >2000 counts, and if more than 50% of those come from <1% of pixels, then it is considered to be noise-dominated and hence unusable.
| Quadrant | # 1 sec bins | Bins with >0 counts | Bins with >2000 counts | High rate bins dominated by noise | Noise dominated (total time) | Noise dominated (detector-on time) | Marked lightcurve |
|---|---|---|---|---|---|---|---|
| A | 7239 | 6739 | 0 | 0 | 0.00% | 0.00% | 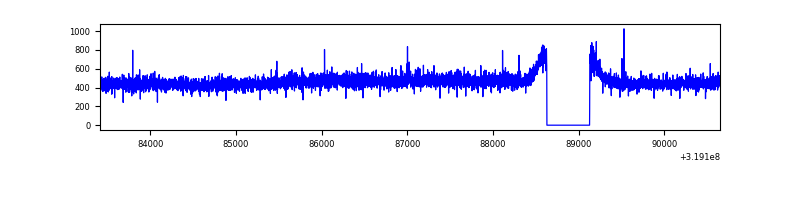 |
| B | 7239 | 6739 | 14 | 14 | 0.19% | 0.21% | 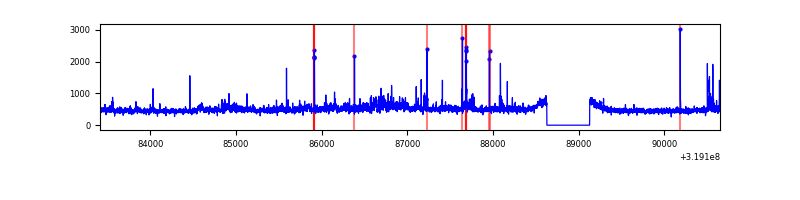 |
| C | 7240 | 6740 | 0 | 0 | 0.00% | 0.00% | 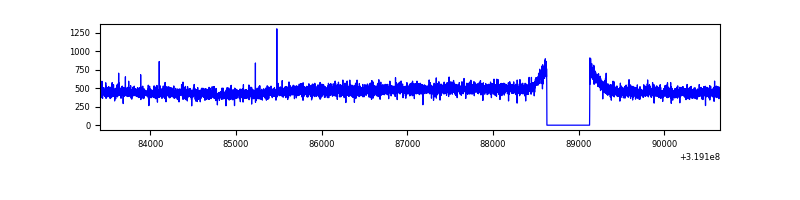 |
| D | 7239 | 6739 | 46 | 46 | 0.64% | 0.68% | 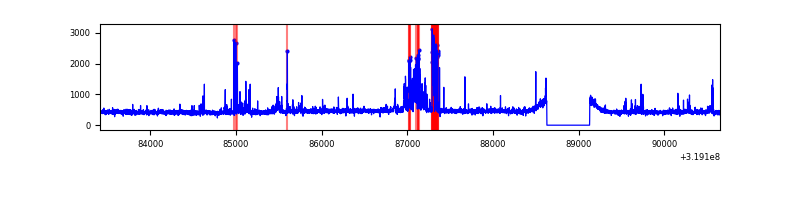 |
Top three noisy pixels from each quadrant. If the there are fewer than three noisy pixels in the level2.evt file, extra rows are filled as -1
| Pixel properties | Quadrant properties | ||||||
|---|---|---|---|---|---|---|---|
| Quadrant | DetID | PixID | Counts | Sigma | Mean | Median | Sigma |
| A | 13 | 254 | 10671 | 60.35 | 806 | 786 | 163.8 |
| A | 3 | 137 | 7330 | 39.95 | 806 | 786 | 163.8 |
| A | 0 | 226 | 6979 | 37.81 | 806 | 786 | 163.8 |
| B | 0 | 189 | 208230 | 1341.29 | 802 | 779 | 154.7 |
| B | 0 | 229 | 68283 | 436.45 | 802 | 779 | 154.7 |
| B | 3 | 64 | 30067 | 189.36 | 802 | 779 | 154.7 |
| C | 14 | 238 | 122402 | 674.39 | 769 | 772 | 180.4 |
| C | 7 | 247 | 16383 | 86.55 | 769 | 772 | 180.4 |
| C | 13 | 61 | 5355 | 25.41 | 769 | 772 | 180.4 |
| D | 9 | 85 | 251311 | 1311.63 | 780 | 757 | 191.0 |
| D | 1 | 52 | 56205 | 290.27 | 780 | 757 | 191.0 |
| D | 13 | 189 | 48526 | 250.07 | 780 | 757 | 191.0 |
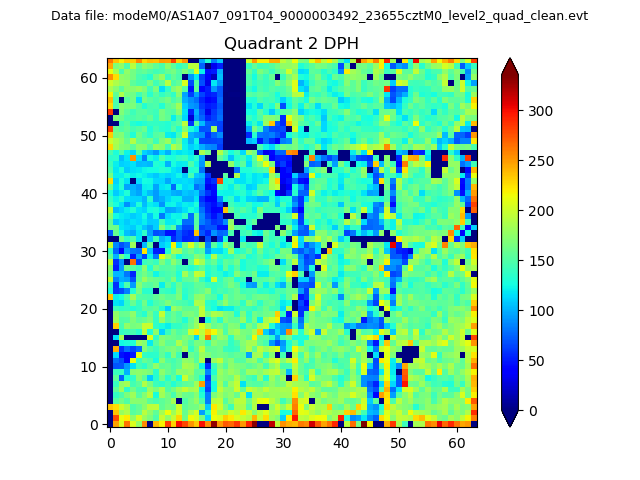
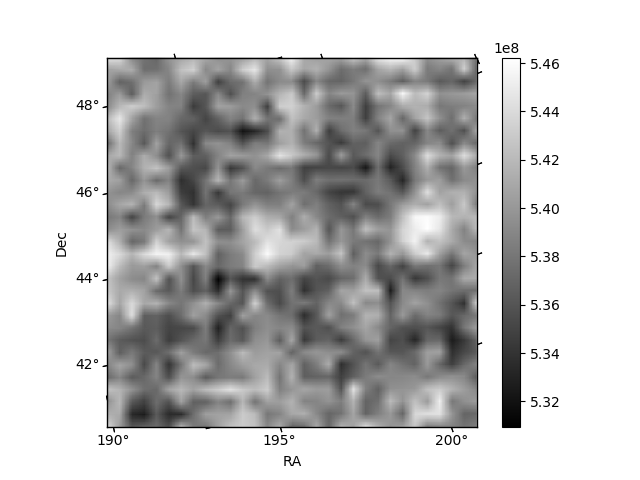
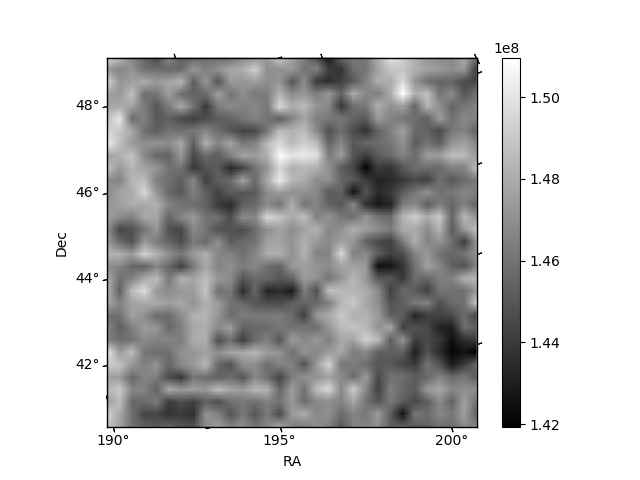
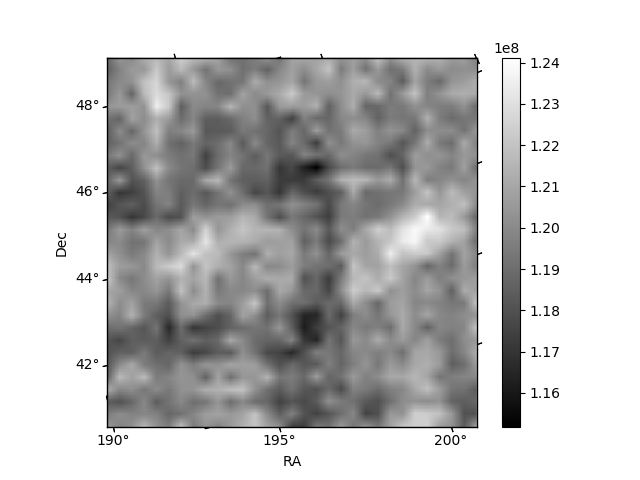
Histogram calculated using DETX and DETY for each event in the final _common_clean file
| Quadrant A | 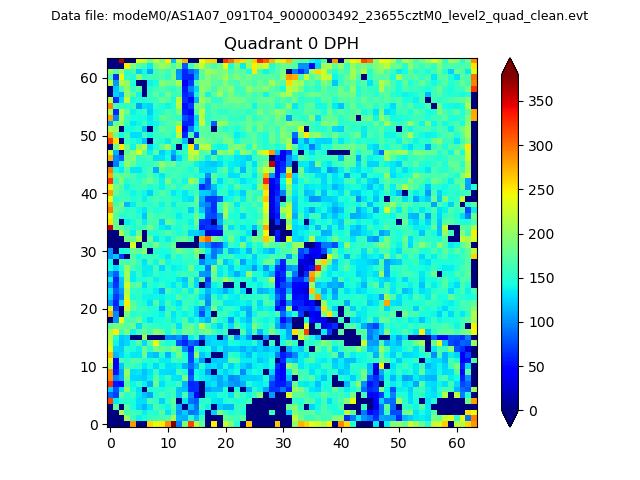 |
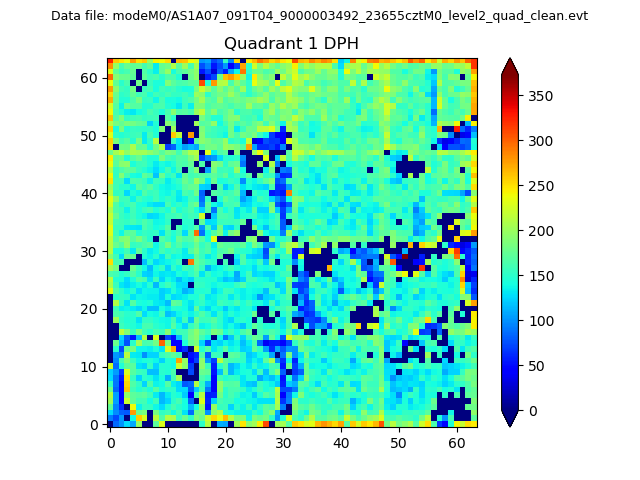 |
Quadrant B |
|---|---|---|---|
| Quadrant D | 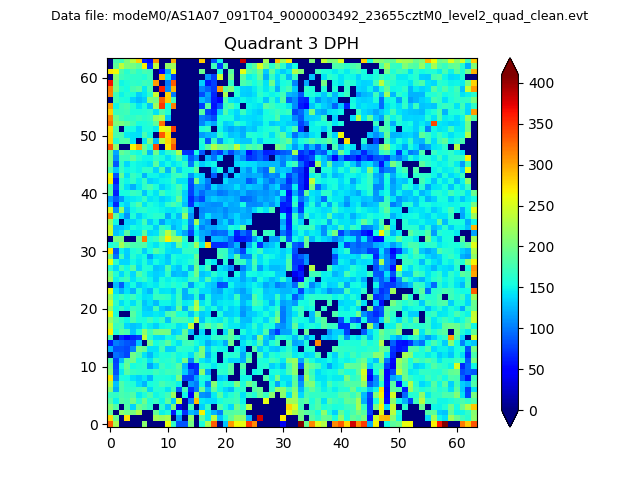 |
 |
Quadrant C |
| Plot type | Count rate plots | Images |
|---|---|---|
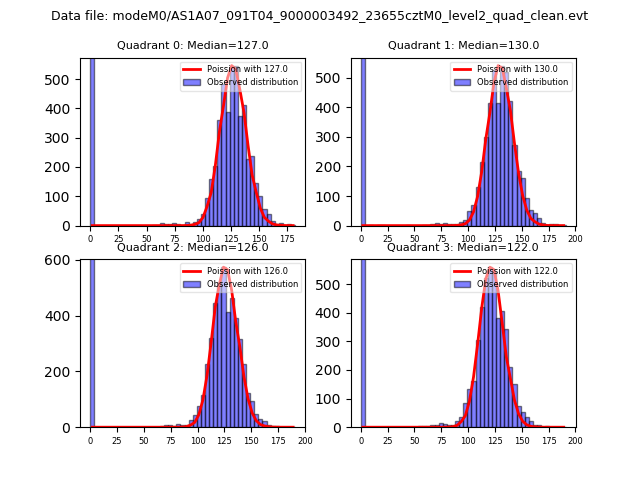
| Comparison with Poisson distribution Blue bars denote a histogram of data divided into 1 sec bins. Red curve is a Poisson curve with rate = median count rate of data. |
 |
 |
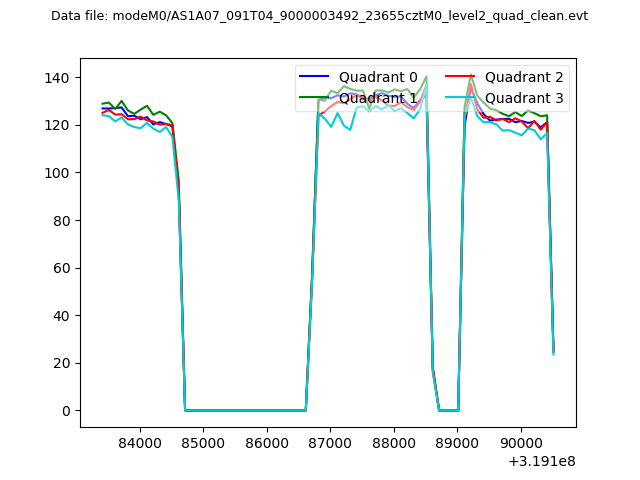
| Quadrant-wise count rates Data is divided into 100 sec bins |
 |
|
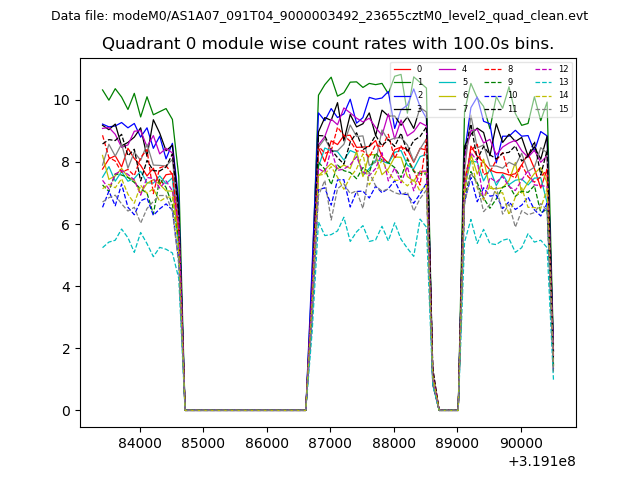
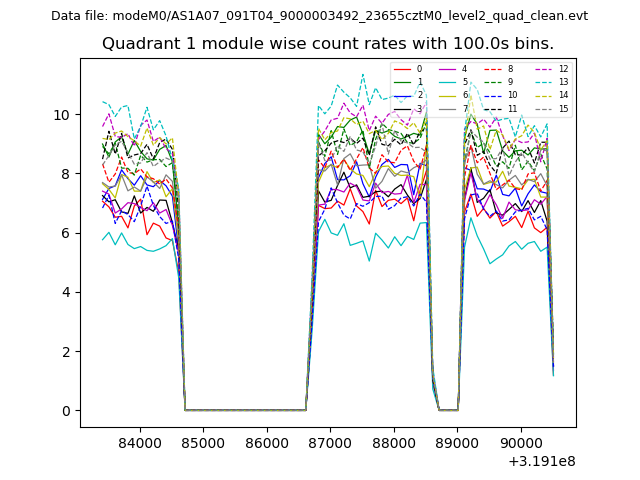
| Module-wise count rates for Quadrant A Data is divided into 100 sec bins |
 |
 |
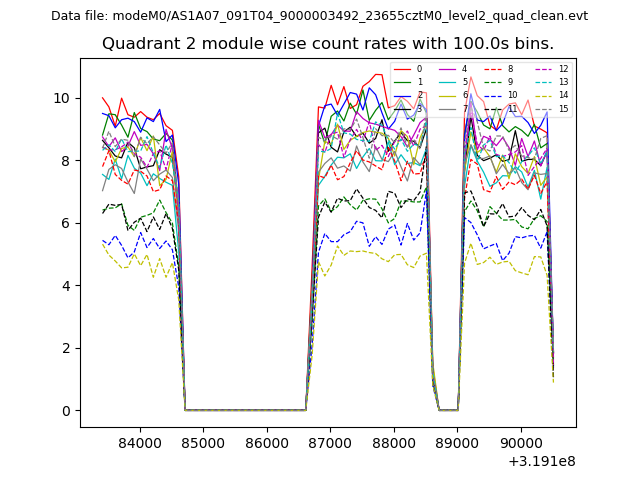
| Module-wise count rates for Quadrant B Data is divided into 100 sec bins |
 |
 |
| Module-wise count rates for Quadrant C Data is divided into 100 sec bins |
 |
 |
| Module-wise count rates for Quadrant D Data is divided into 100 sec bins |
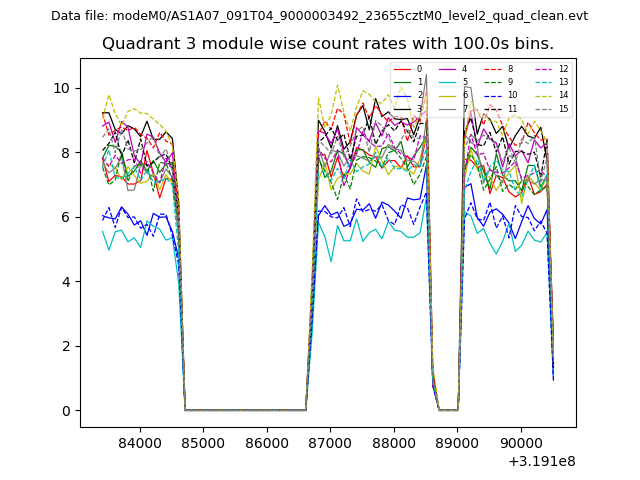 |
 |
| Parameter | Plot |
|---|---|
| CZT HV Monitor | 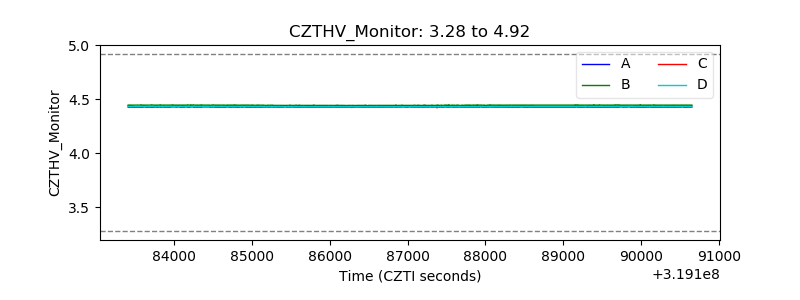 |
| D_VDD | 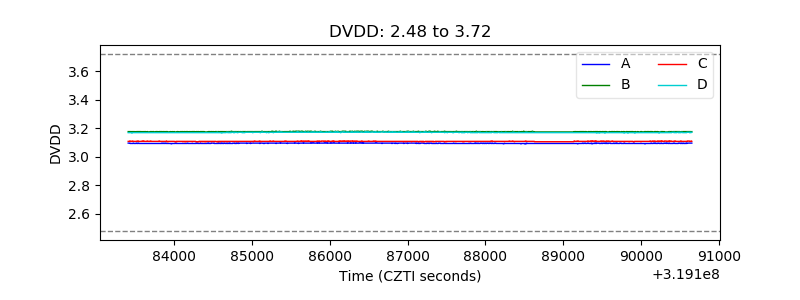 |
| Temperature 1 |  |
| Veto HV Monitor | 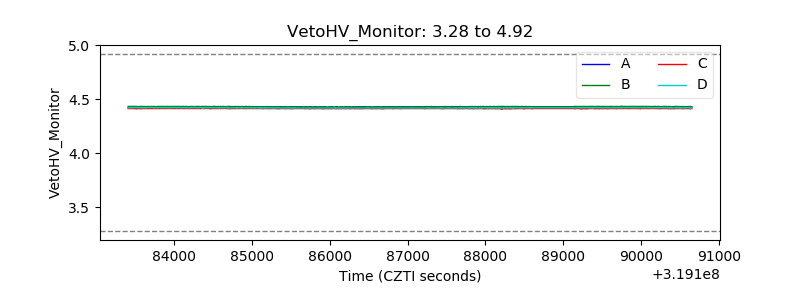 |
| Veto LLD | 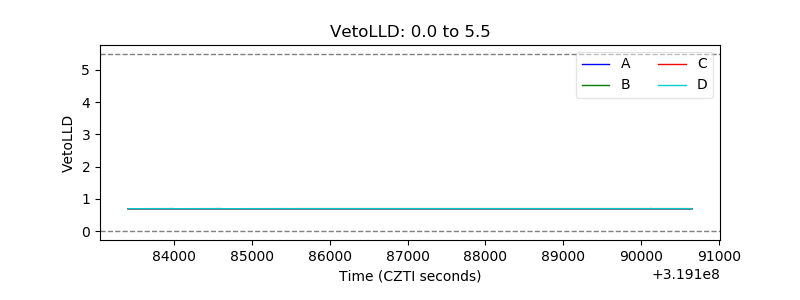 |
| Alpha Counter | 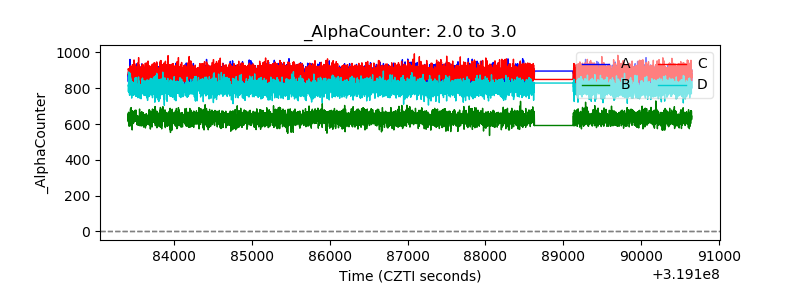 |
| _CPM_Rate | 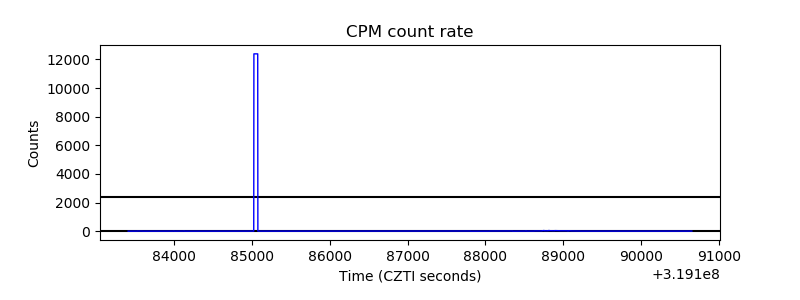 |
| CZT Counter | 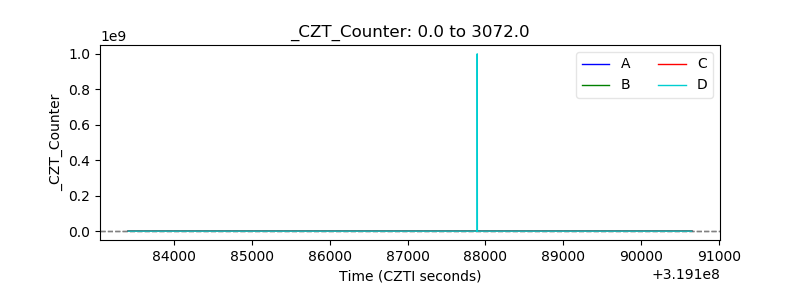 |
| +2.5 Volts monitor |  |
| +5 Volts monitor |  |
| _ROLL_ROT | 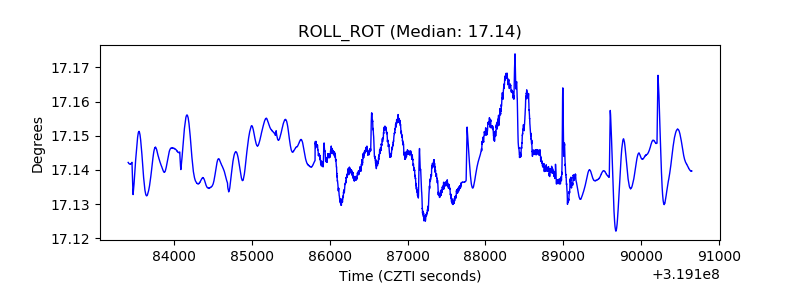 |
| _Roll_DEC | 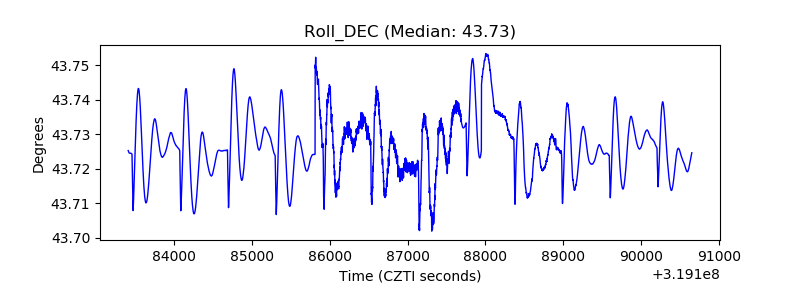 |
| _Roll_RA | 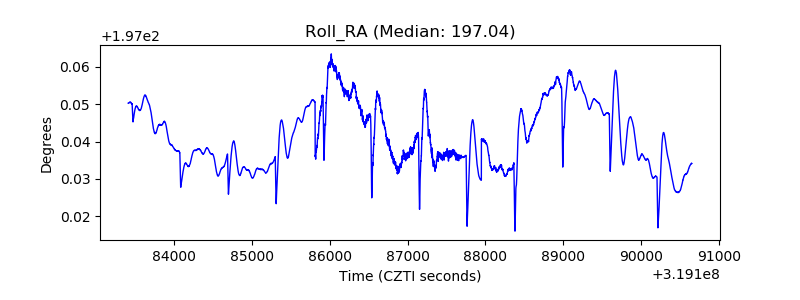 |
| Veto Counter | 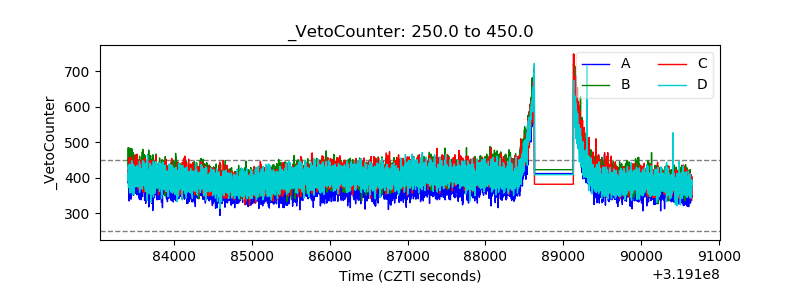 |