| Param | Original file | Final file |
|---|---|---|
| Filename | modeM0/AS1A07_091T04_9000003492_23656cztM0_level2.evt | modeM0/AS1A07_091T04_9000003492_23656cztM0_level2_quad_clean.evt |
| Size (bytes) | 1,511,510,400 | 291,790,080 |
| Size | 1.4 GB | 278.3 MB |
| Events in quadrant A | 10,111,122 | 1,861,595 |
| Events in quadrant B | 11,477,132 | 1,921,524 |
| Events in quadrant C | 10,258,547 | 1,839,819 |
| Events in quadrant D | 12,496,379 | 1,754,385 |
| Mode M9 | |||
|---|---|---|---|
| Quadrant | BADHDUFLAG | Total packets | Discarded packets |
| A | 0 | 40 | 0 |
| B | 0 | 41 | 0 |
| C | 0 | 41 | 0 |
| D | 0 | 41 | 0 |
| Mode M0 | |||
|---|---|---|---|
| Quadrant | BADHDUFLAG | Total packets | Discarded packets |
| A | 0 | 43738 | 5 |
| B | 0 | 47535 | 5 |
| C | 0 | 44098 | 5 |
| D | 0 | 51857 | 5 |
| Mode SS | |||
|---|---|---|---|
| Quadrant | BADHDUFLAG | Total packets | Discarded packets |
| A | 0 | 434 | 0 |
| B | 0 | 434 | 0 |
| C | 0 | 434 | 0 |
| D | 0 | 434 | 0 |
| Quadrant | Total seconds | Saturated seconds | Saturation percentage |
|---|---|---|---|
| A | 21202 | 84 | 0.396189% |
| B | 21202 | 325 | 1.532874% |
| C | 21203 | 212 | 0.999859% |
| D | 21203 | 603 | 2.843937% |
Noise dominated data is calculated using 1-second bins in cleaned event files. If a bin has >2000 counts, and if more than 50% of those come from <1% of pixels, then it is considered to be noise-dominated and hence unusable.
| Quadrant | # 1 sec bins | Bins with >0 counts | Bins with >2000 counts | High rate bins dominated by noise | Noise dominated (total time) | Noise dominated (detector-on time) | Marked lightcurve |
|---|---|---|---|---|---|---|---|
| A | 35631 | 21207 | 1 | 1 | 0.00% | 0.00% | 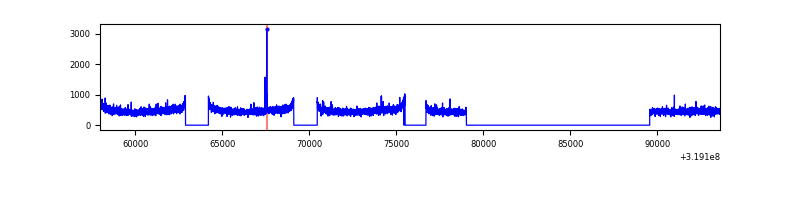 |
| B | 35631 | 21206 | 112 | 112 | 0.31% | 0.53% | 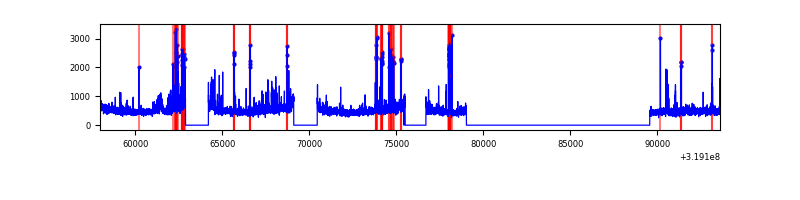 |
| C | 35631 | 21208 | 4 | 4 | 0.01% | 0.02% | 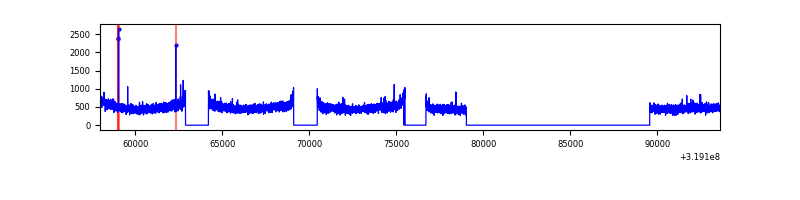 |
| D | 35631 | 21208 | 369 | 369 | 1.04% | 1.74% | 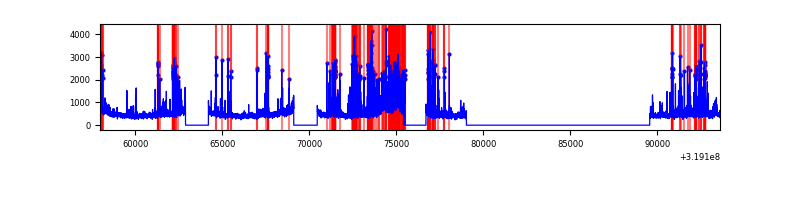 |
Top three noisy pixels from each quadrant. If the there are fewer than three noisy pixels in the level2.evt file, extra rows are filled as -1
| Pixel properties | Quadrant properties | ||||||
|---|---|---|---|---|---|---|---|
| Quadrant | DetID | PixID | Counts | Sigma | Mean | Median | Sigma |
| A | 13 | 254 | 33080 | 59.04 | 2620 | 2569 | 516.8 |
| A | 0 | 226 | 22361 | 38.3 | 2620 | 2569 | 516.8 |
| A | 3 | 137 | 22277 | 38.13 | 2620 | 2569 | 516.8 |
| B | 0 | 229 | 500135 | 1026.49 | 2613 | 2553 | 484.7 |
| B | 3 | 64 | 300627 | 614.92 | 2613 | 2553 | 484.7 |
| B | 0 | 189 | 277083 | 566.35 | 2613 | 2553 | 484.7 |
| C | 14 | 238 | 406575 | 697.85 | 2513 | 2530 | 579.0 |
| C | 7 | 247 | 50668 | 83.14 | 2513 | 2530 | 579.0 |
| C | 13 | 61 | 17721 | 26.24 | 2513 | 2530 | 579.0 |
| D | 1 | 52 | 1193445 | 1956.3 | 2510 | 2437 | 608.8 |
| D | 9 | 85 | 1013141 | 1660.14 | 2510 | 2437 | 608.8 |
| D | 13 | 189 | 347737 | 567.18 | 2510 | 2437 | 608.8 |
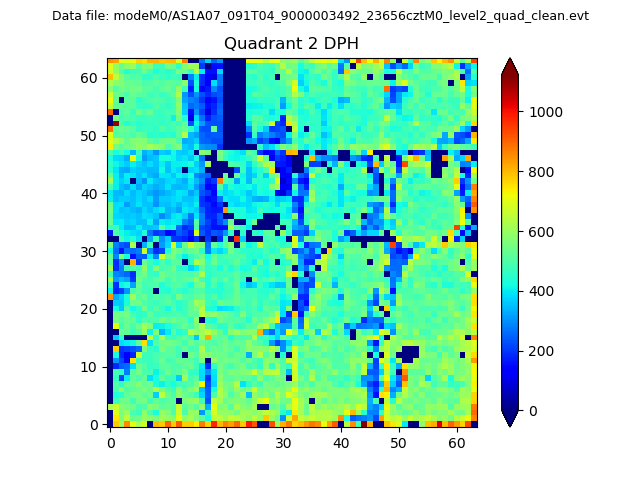
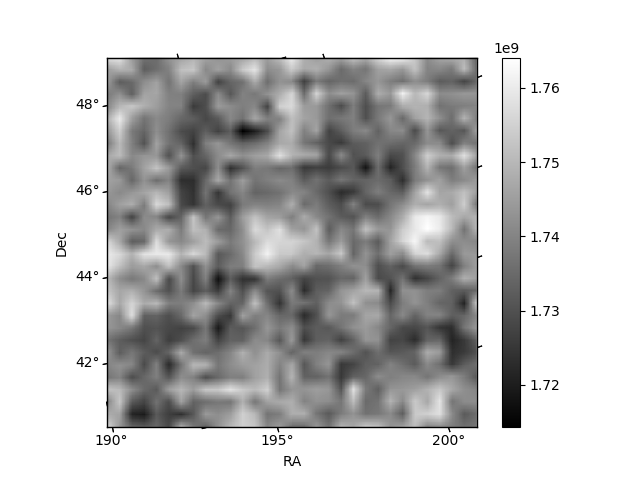
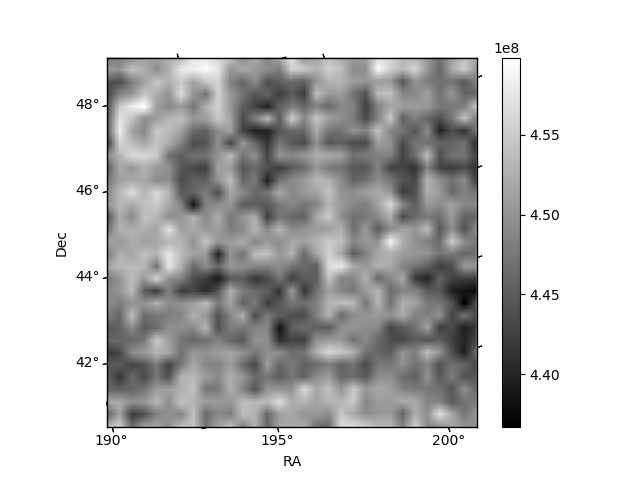
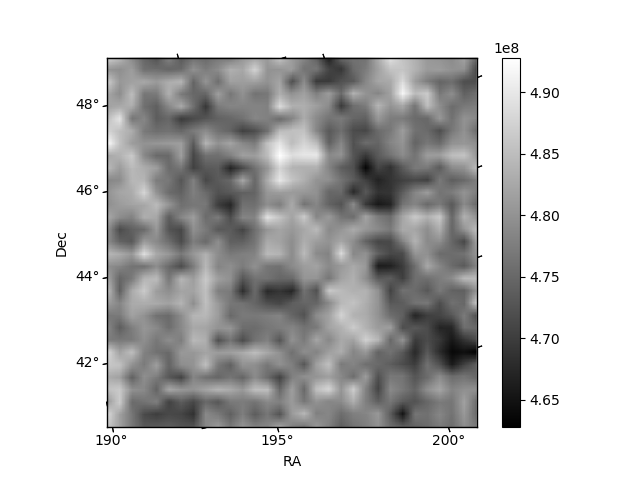
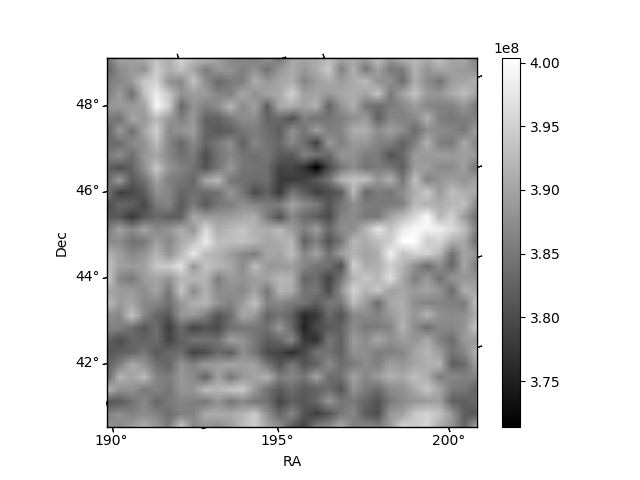
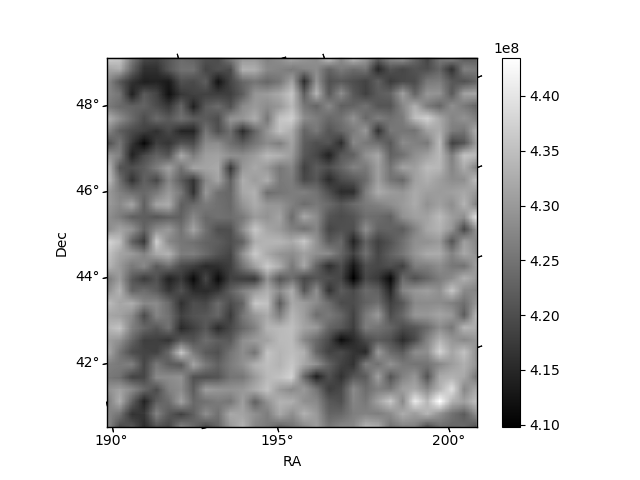
Histogram calculated using DETX and DETY for each event in the final _common_clean file
| Quadrant A | 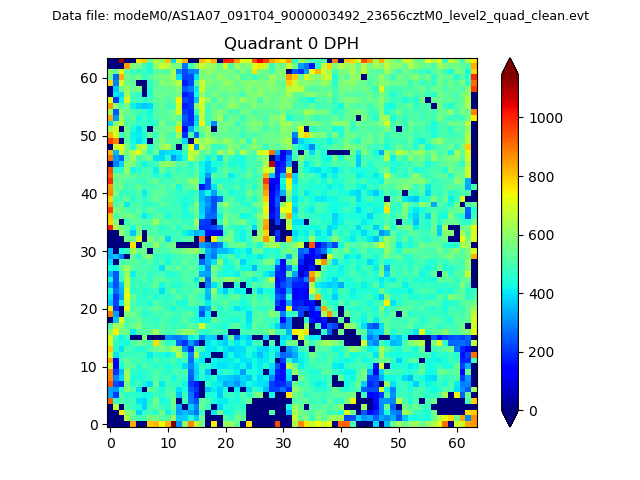 |
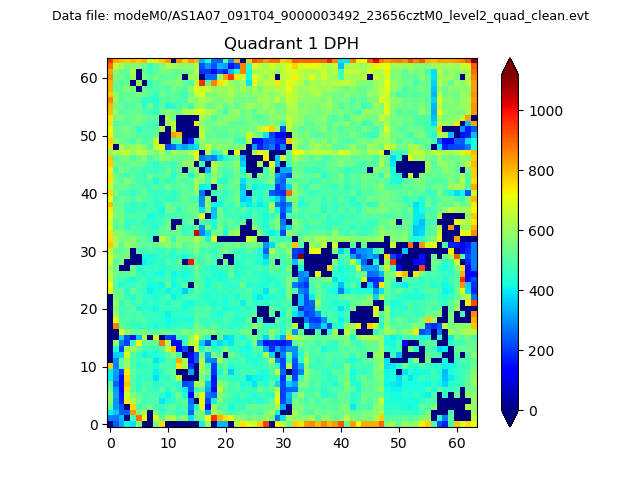 |
Quadrant B |
|---|---|---|---|
| Quadrant D | 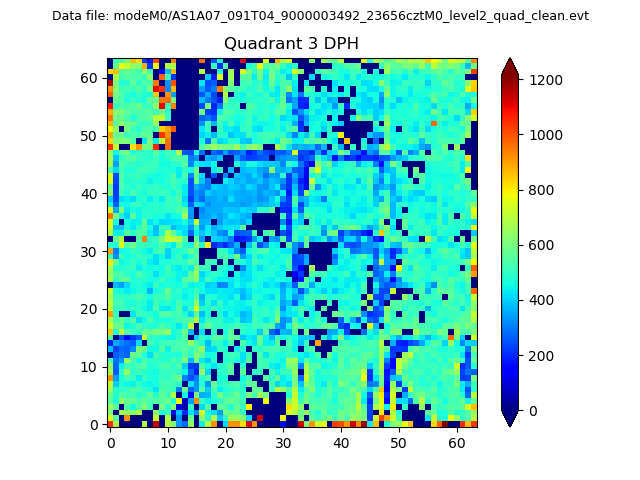 |
 |
Quadrant C |
| Plot type | Count rate plots | Images |
|---|---|---|
| Comparison with Poisson distribution Blue bars denote a histogram of data divided into 1 sec bins. Red curve is a Poisson curve with rate = median count rate of data. |
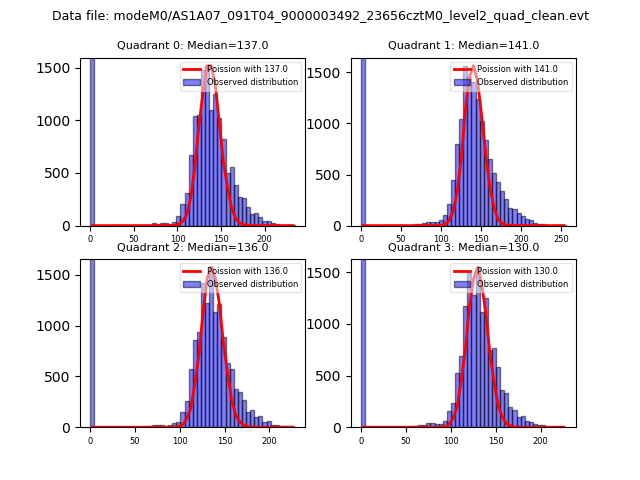 |
 |
| Quadrant-wise count rates Data is divided into 100 sec bins |
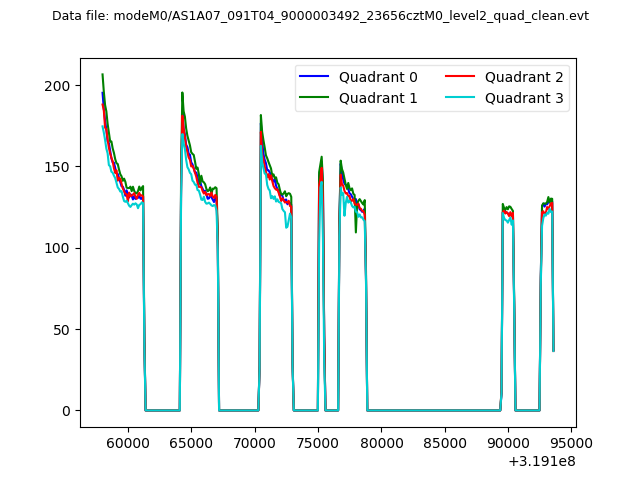 |
|
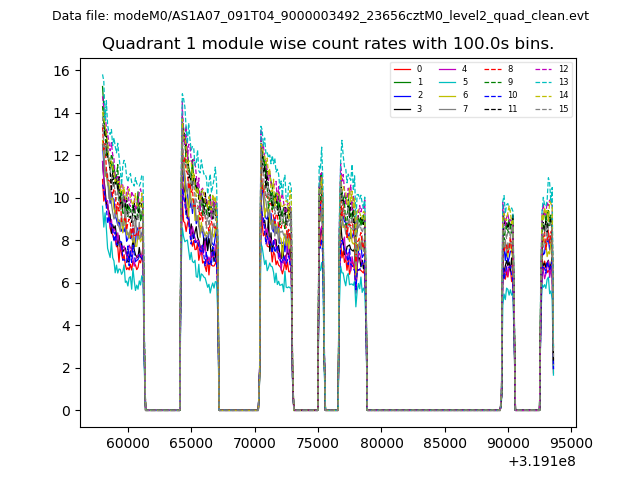
| Module-wise count rates for Quadrant A Data is divided into 100 sec bins |
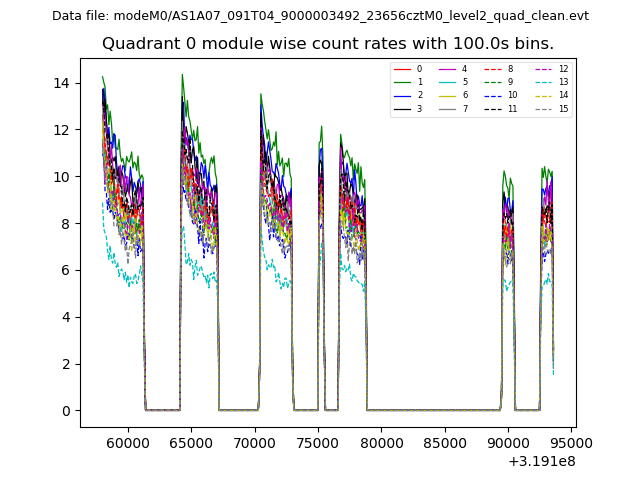 |
 |
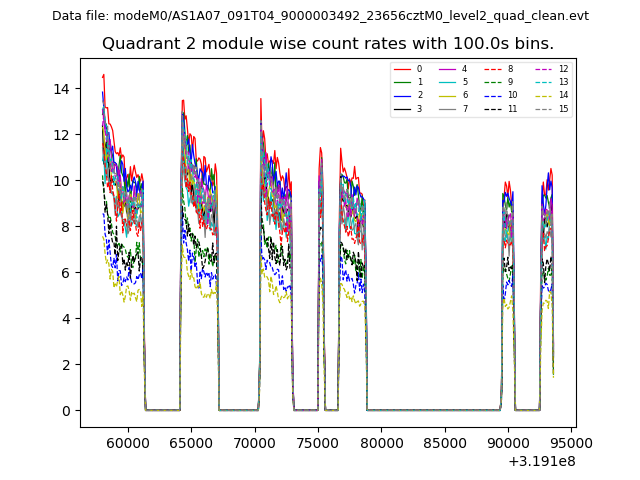
| Module-wise count rates for Quadrant B Data is divided into 100 sec bins |
 |
 |
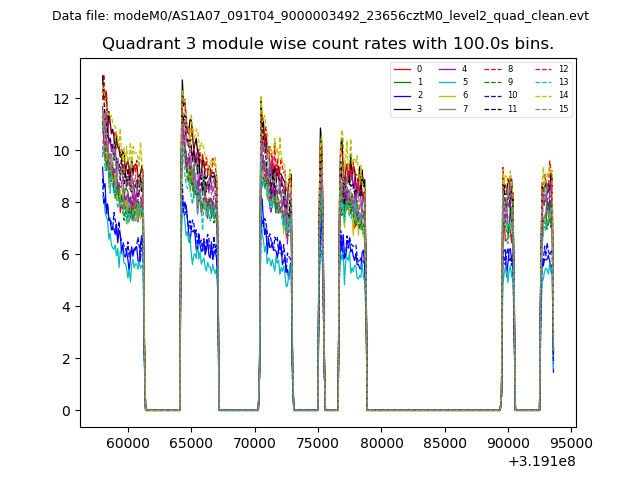
| Module-wise count rates for Quadrant C Data is divided into 100 sec bins |
 |
 |
| Module-wise count rates for Quadrant D Data is divided into 100 sec bins |
 |
 |
| Parameter | Plot |
|---|---|
| CZT HV Monitor | 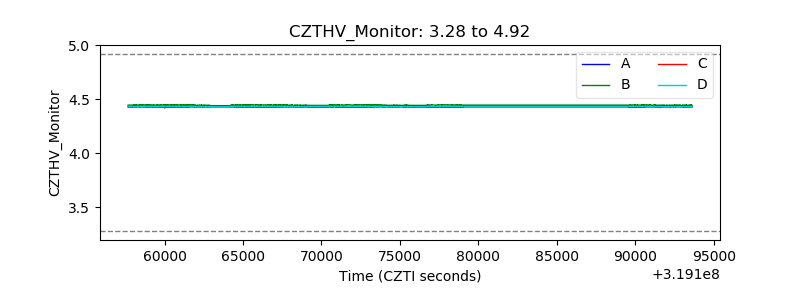 |
| D_VDD | 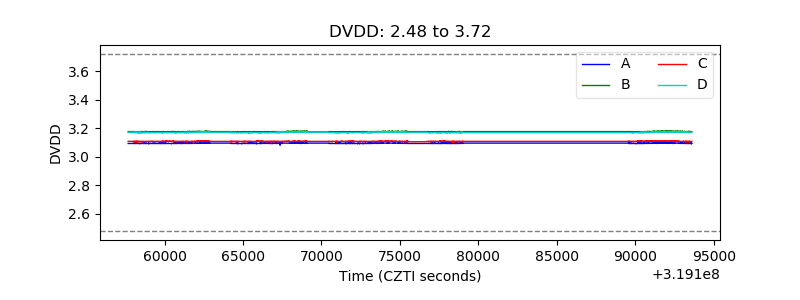 |
| Temperature 1 | 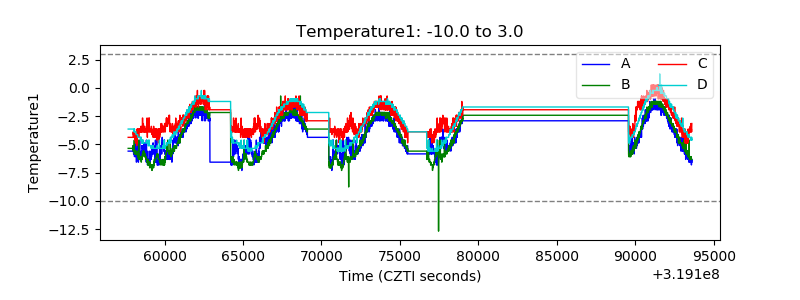 |
| Veto HV Monitor | 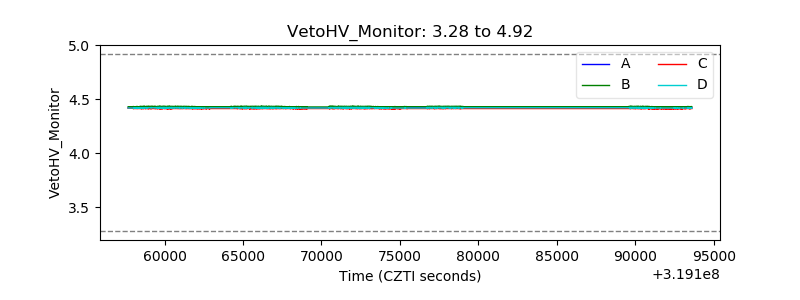 |
| Veto LLD | 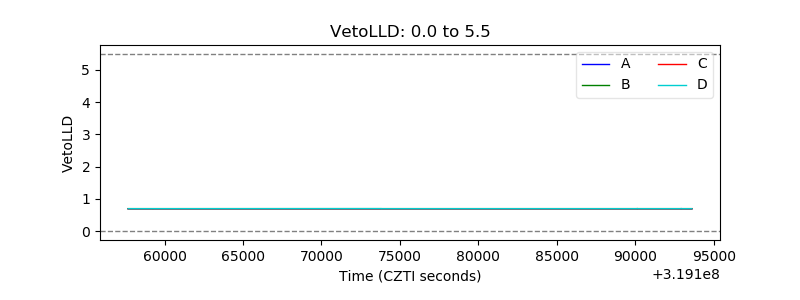 |
| Alpha Counter | 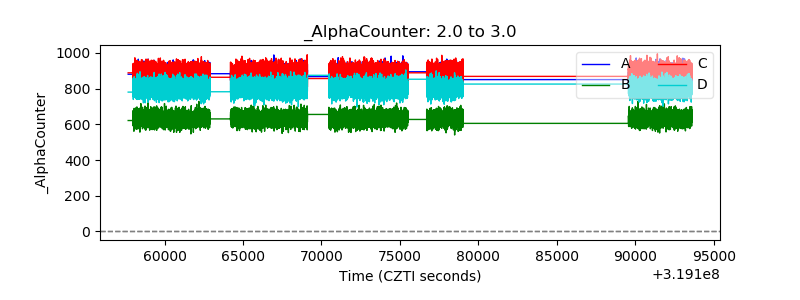 |
| _CPM_Rate | 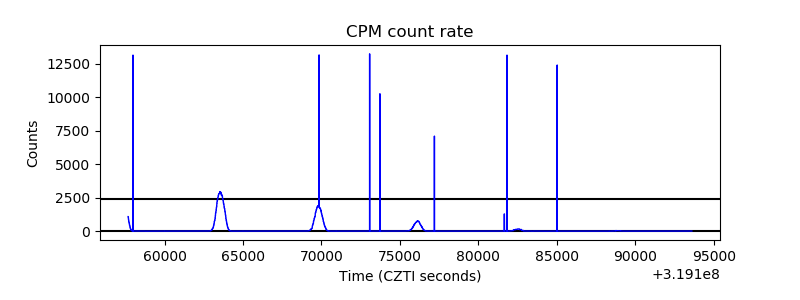 |
| CZT Counter | 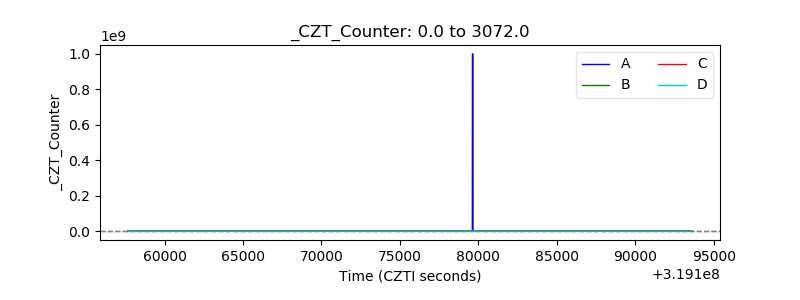 |
| +2.5 Volts monitor |  |
| +5 Volts monitor |  |
| _ROLL_ROT |  |
| _Roll_DEC | 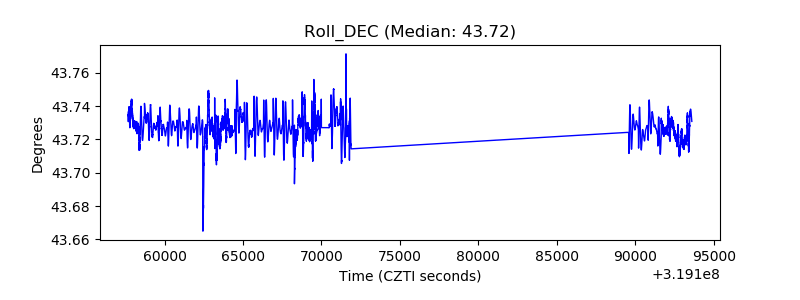 |
| _Roll_RA | 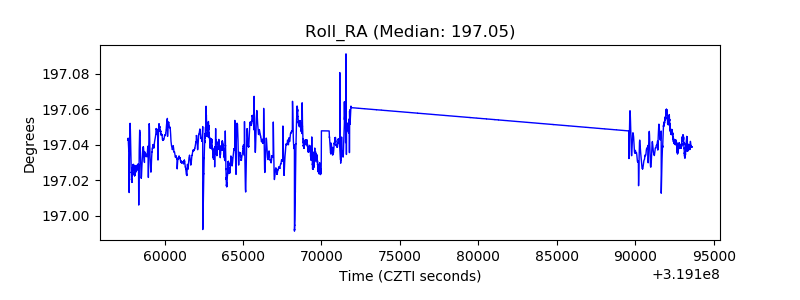 |
| Veto Counter | 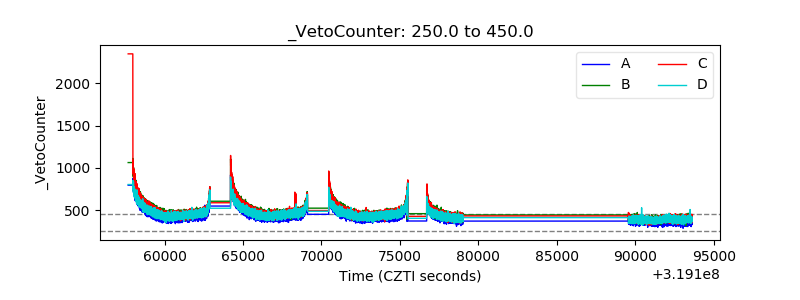 |