| Param | Original file | Final file |
|---|---|---|
| Filename | modeM0/AS1A07_091T04_9000003492_23657cztM0_level2.evt | modeM0/AS1A07_091T04_9000003492_23657cztM0_level2_quad_clean.evt |
| Size (bytes) | 1,418,808,960 | 241,312,320 |
| Size | 1.3 GB | 230.1 MB |
| Events in quadrant A | 9,267,150 | 1,504,739 |
| Events in quadrant B | 10,403,322 | 1,535,519 |
| Events in quadrant C | 9,399,685 | 1,481,766 |
| Events in quadrant D | 12,562,891 | 1,424,878 |
| Mode M9 | |||
|---|---|---|---|
| Quadrant | BADHDUFLAG | Total packets | Discarded packets |
| A | 0 | 26 | 0 |
| B | 0 | 26 | 0 |
| C | 0 | 26 | 0 |
| D | 0 | 26 | 0 |
| Mode M0 | |||
|---|---|---|---|
| Quadrant | BADHDUFLAG | Total packets | Discarded packets |
| A | 0 | 40436 | 4 |
| B | 0 | 43369 | 4 |
| C | 0 | 40683 | 4 |
| D | 0 | 51133 | 4 |
| Mode SS | |||
|---|---|---|---|
| Quadrant | BADHDUFLAG | Total packets | Discarded packets |
| A | 0 | 402 | 0 |
| B | 0 | 402 | 0 |
| C | 0 | 402 | 0 |
| D | 0 | 402 | 0 |
| Quadrant | Total seconds | Saturated seconds | Saturation percentage |
|---|---|---|---|
| A | 19763 | 248 | 1.254870% |
| B | 19763 | 410 | 2.074584% |
| C | 19764 | 317 | 1.603926% |
| D | 19764 | 753 | 3.809957% |
Noise dominated data is calculated using 1-second bins in cleaned event files. If a bin has >2000 counts, and if more than 50% of those come from <1% of pixels, then it is considered to be noise-dominated and hence unusable.
| Quadrant | # 1 sec bins | Bins with >0 counts | Bins with >2000 counts | High rate bins dominated by noise | Noise dominated (total time) | Noise dominated (detector-on time) | Marked lightcurve |
|---|---|---|---|---|---|---|---|
| A | 22338 | 19765 | 0 | 0 | 0.00% | 0.00% | 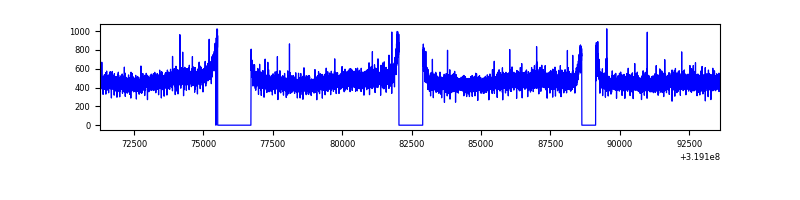 |
| B | 22338 | 19764 | 99 | 99 | 0.44% | 0.50% | 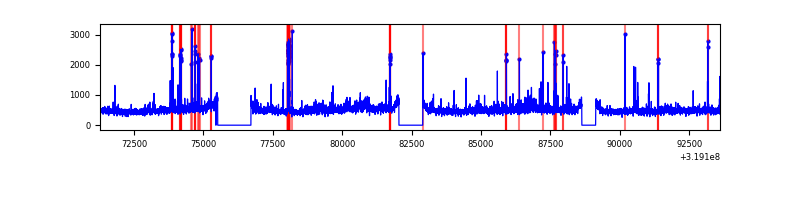 |
| C | 22339 | 19766 | 0 | 0 | 0.00% | 0.00% | 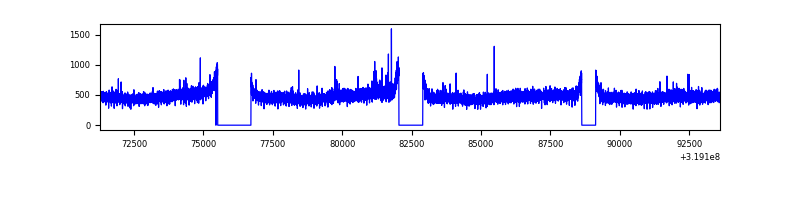 |
| D | 22339 | 19766 | 399 | 399 | 1.79% | 2.02% | 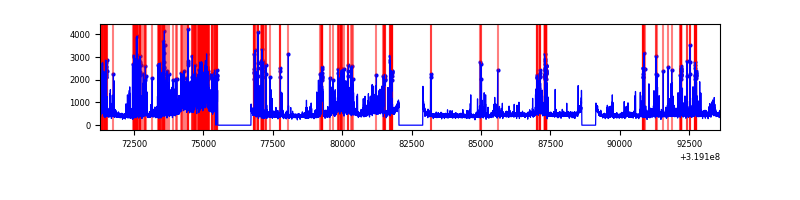 |
Top three noisy pixels from each quadrant. If the there are fewer than three noisy pixels in the level2.evt file, extra rows are filled as -1
| Pixel properties | Quadrant properties | ||||||
|---|---|---|---|---|---|---|---|
| Quadrant | DetID | PixID | Counts | Sigma | Mean | Median | Sigma |
| A | 13 | 254 | 31378 | 60.43 | 2403 | 2346 | 480.4 |
| A | 3 | 137 | 21249 | 39.34 | 2403 | 2346 | 480.4 |
| A | 0 | 226 | 20748 | 38.3 | 2403 | 2346 | 480.4 |
| B | 0 | 189 | 532219 | 1180.94 | 2384 | 2321 | 448.7 |
| B | 0 | 229 | 199449 | 439.32 | 2384 | 2321 | 448.7 |
| B | 3 | 64 | 196591 | 432.95 | 2384 | 2321 | 448.7 |
| C | 14 | 238 | 367955 | 690.23 | 2293 | 2304 | 529.8 |
| C | 7 | 247 | 90291 | 166.09 | 2293 | 2304 | 529.8 |
| C | 13 | 61 | 16067 | 25.98 | 2293 | 2304 | 529.8 |
| D | 9 | 85 | 1748746 | 3135.14 | 2304 | 2234 | 557.1 |
| D | 1 | 52 | 1325101 | 2374.66 | 2304 | 2234 | 557.1 |
| D | 12 | 233 | 281892 | 502.01 | 2304 | 2234 | 557.1 |
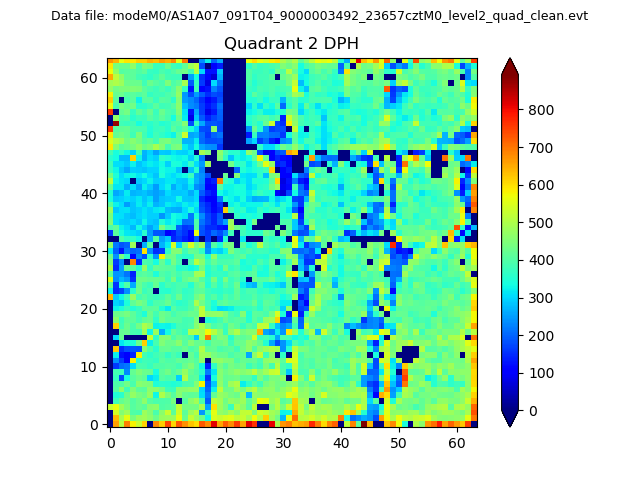
Histogram calculated using DETX and DETY for each event in the final _common_clean file
| Quadrant A | 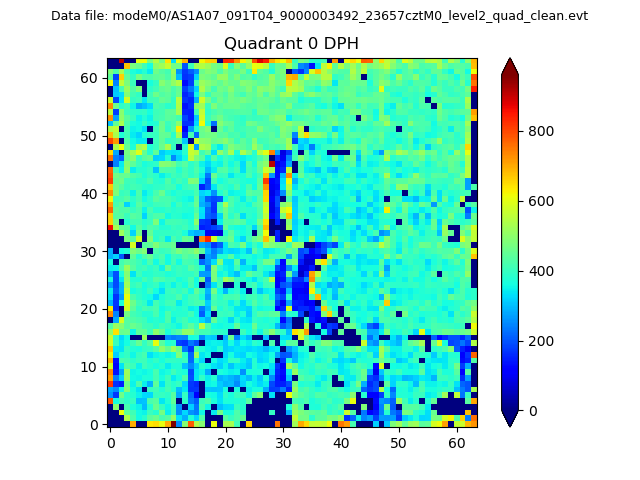 |
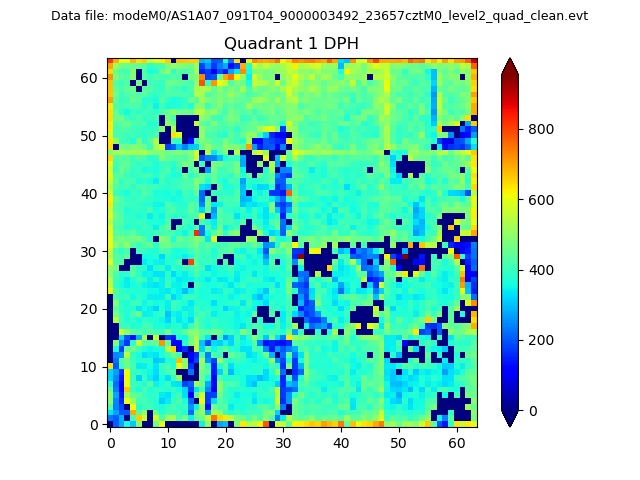 |
Quadrant B |
|---|---|---|---|
| Quadrant D | 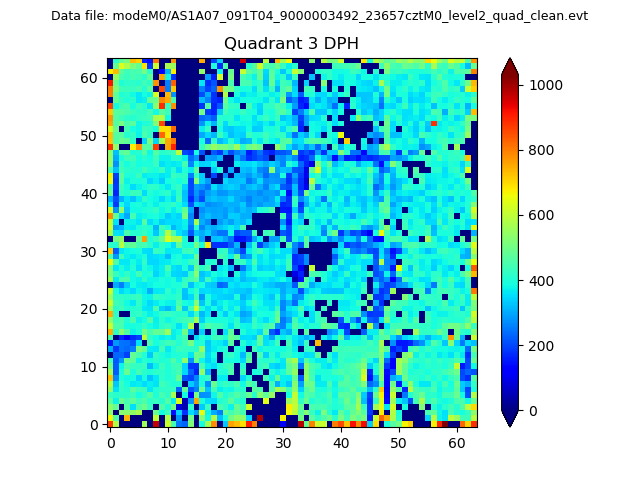 |
 |
Quadrant C |
| Plot type | Count rate plots | Images |
|---|---|---|
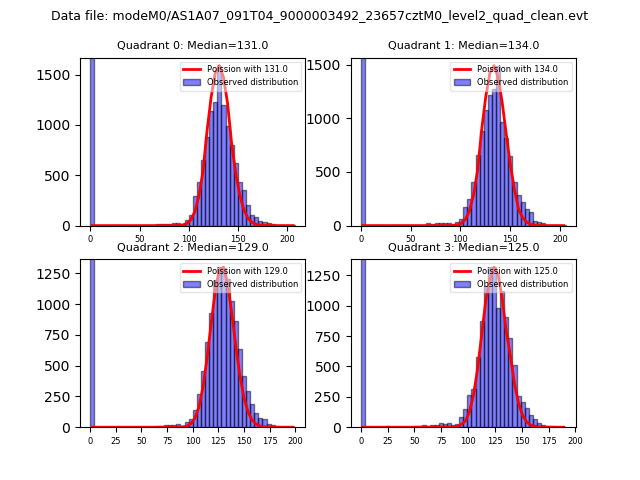
| Comparison with Poisson distribution Blue bars denote a histogram of data divided into 1 sec bins. Red curve is a Poisson curve with rate = median count rate of data. |
 |
 |
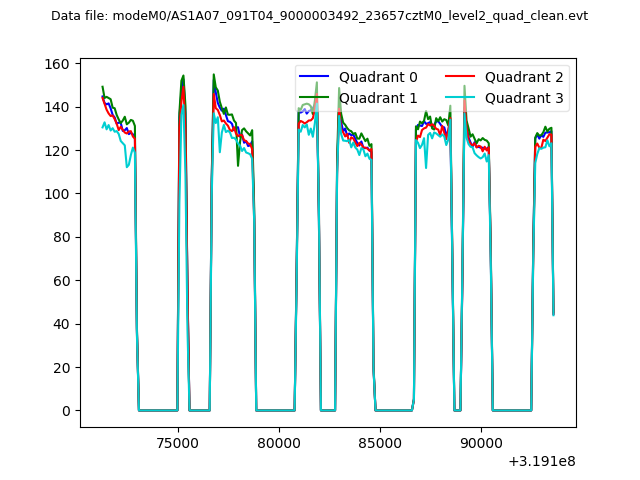
| Quadrant-wise count rates Data is divided into 100 sec bins |
 |
|
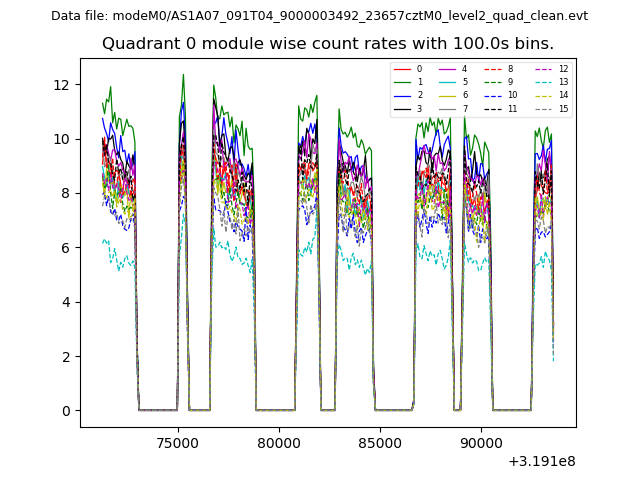
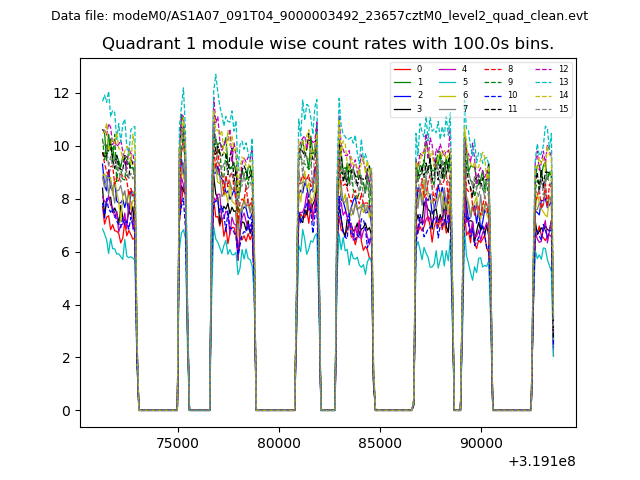
| Module-wise count rates for Quadrant A Data is divided into 100 sec bins |
 |
 |
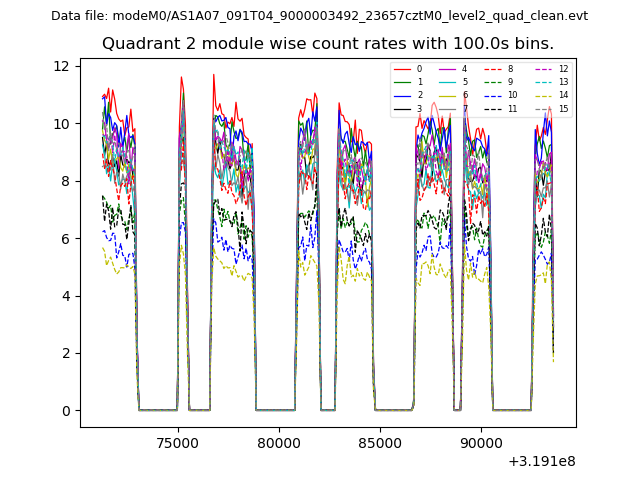
| Module-wise count rates for Quadrant B Data is divided into 100 sec bins |
 |
 |
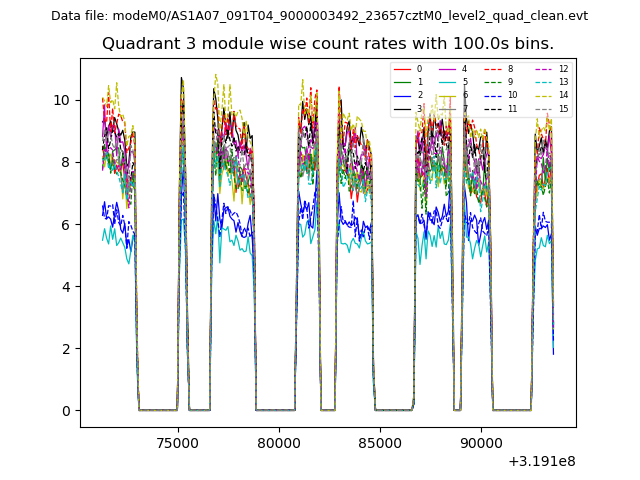
| Module-wise count rates for Quadrant C Data is divided into 100 sec bins |
 |
 |
| Module-wise count rates for Quadrant D Data is divided into 100 sec bins |
 |
 |
| Parameter | Plot |
|---|---|
| CZT HV Monitor | 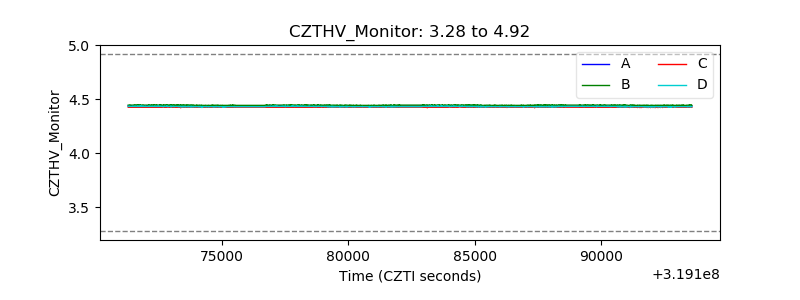 |
| D_VDD | 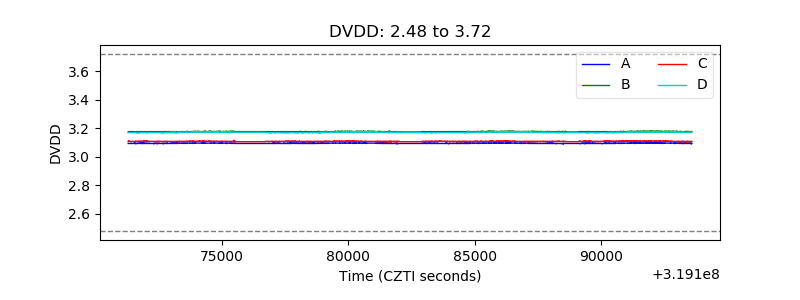 |
| Temperature 1 | 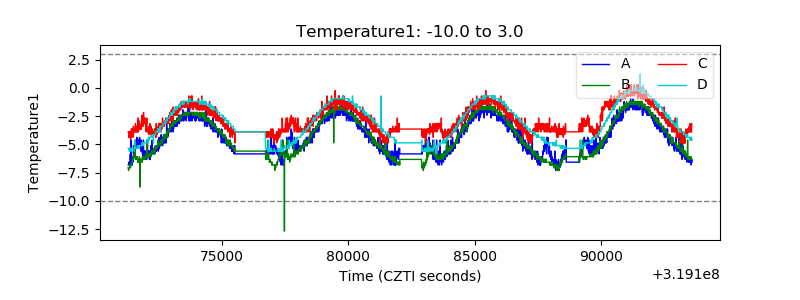 |
| Veto HV Monitor | 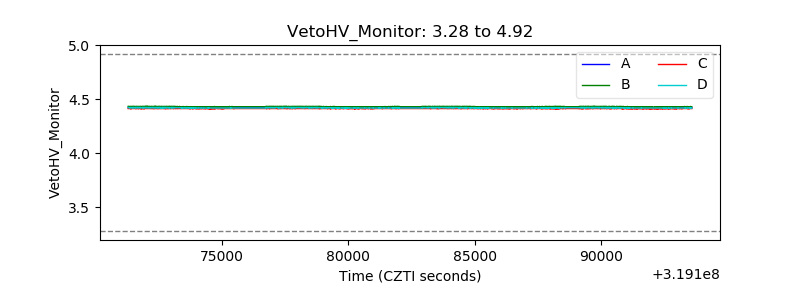 |
| Veto LLD | 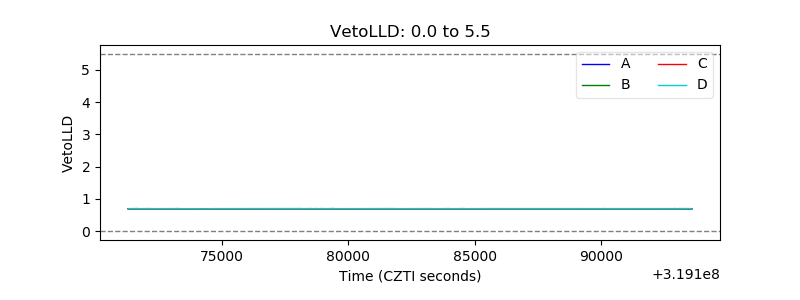 |
| Alpha Counter | 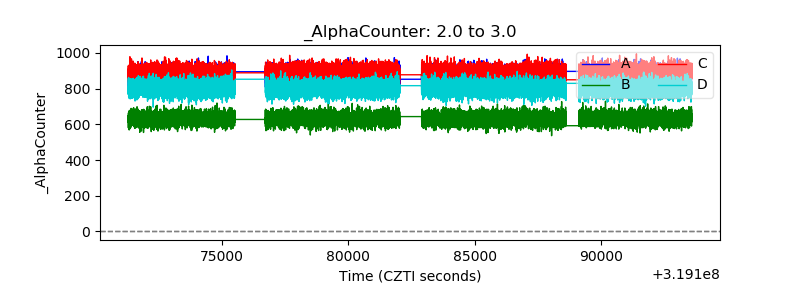 |
| _CPM_Rate | 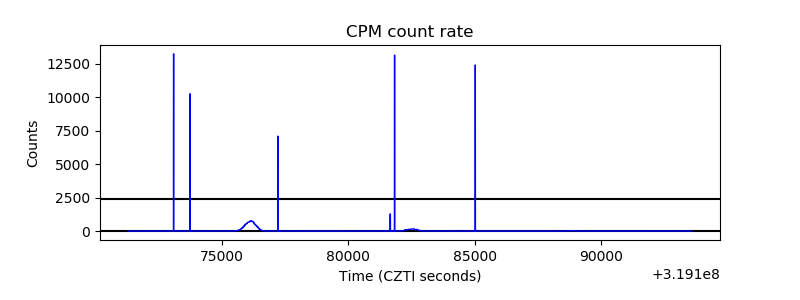 |
| CZT Counter | 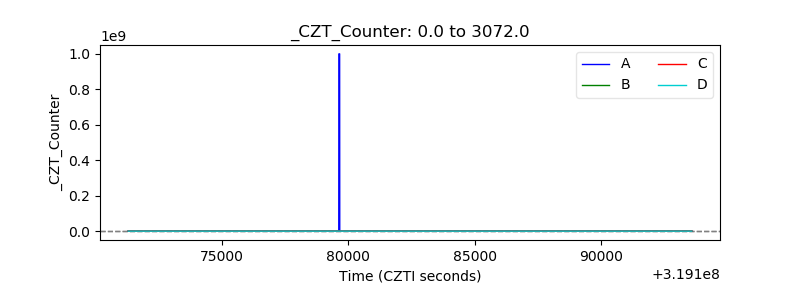 |
| +2.5 Volts monitor |  |
| +5 Volts monitor |  |
| _ROLL_ROT | 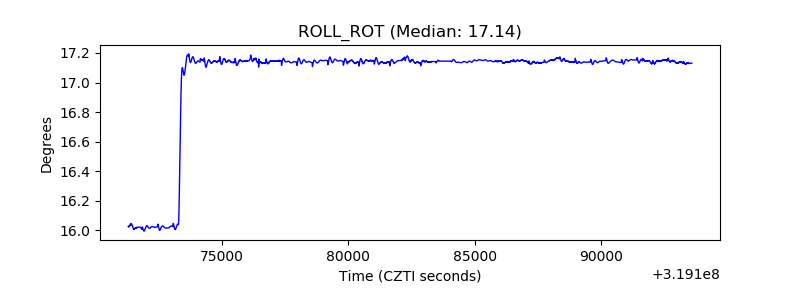 |
| _Roll_DEC | 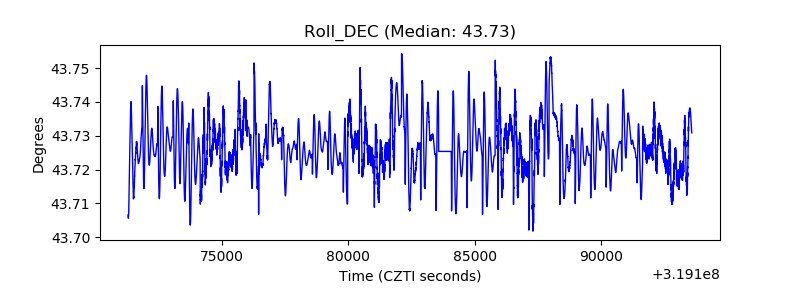 |
| _Roll_RA | 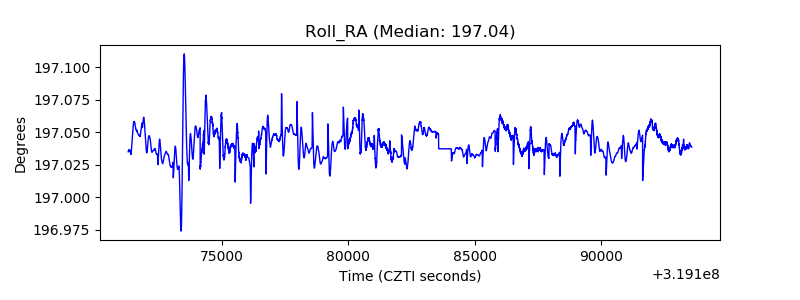 |
| Veto Counter | 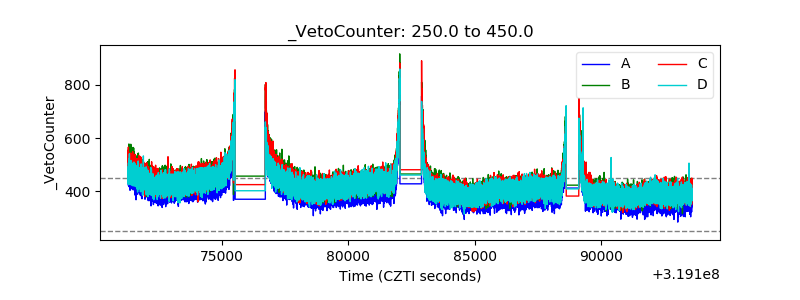 |