| Param | Original file | Final file |
|---|---|---|
| Filename | modeM0/AS1A07_160T07_9000003494cztM0_level2.fits | modeM0/AS1A07_160T07_9000003494cztM0_level2_quad_clean.evt |
| Size (bytes) | 286,980,480 | 285,183,360 |
| Size | 273.7 MB | 272.0 MB |
| Events in quadrant A | 1,743,840 | 1,706,677 |
| Events in quadrant B | 1,662,536 | 1,696,015 |
| Events in quadrant C | 1,714,738 | 1,637,843 |
| Events in quadrant D | 1,477,840 | 1,504,660 |
| Mode SS | |||
|---|---|---|---|
| Quadrant | BADHDUFLAG | Total packets | Discarded packets |
| A | 0 | 624 | 0 |
| B | 0 | 624 | 0 |
| C | 0 | 624 | 0 |
| D | 0 | 624 | 0 |
| Mode M0 | |||
|---|---|---|---|
| Quadrant | BADHDUFLAG | Total packets | Discarded packets |
| A | 0 | 62629 | 0 |
| B | 0 | 68089 | 0 |
| C | 0 | 62908 | 0 |
| D | 0 | 74456 | 0 |
| Mode M9 | |||
|---|---|---|---|
| Quadrant | BADHDUFLAG | Total packets | Discarded packets |
| A | 0 | 34 | 0 |
| B | 0 | 34 | 0 |
| C | 0 | 34 | 0 |
| D | 0 | 34 | 0 |
| Quadrant | Total seconds | Saturated seconds | Saturation percentage |
|---|---|---|---|
| A | 30417 | 474 | 1.558339% |
| B | 30417 | 835 | 2.745175% |
| C | 30417 | 651 | 2.140251% |
| D | 30417 | 1384 | 4.550087% |
Noise dominated data is calculated using 1-second bins in cleaned event files. If a bin has >2000 counts, and if more than 50% of those come from <1% of pixels, then it is considered to be noise-dominated and hence unusable.
| Quadrant | # 1 sec bins | Bins with >0 counts | Bins with >2000 counts | High rate bins dominated by noise | Noise dominated (total time) | Noise dominated (detector-on time) | Marked lightcurve |
|---|---|---|---|---|---|---|---|
| A | 33952 | 30411 | 0 | 0 | 0.00% | 0.00% |  |
| B | 33952 | 30399 | 0 | 0 | 0.00% | 0.00% |  |
| C | 33952 | 30411 | 0 | 0 | 0.00% | 0.00% |  |
| D | 33952 | 30404 | 0 | 0 | 0.00% | 0.00% |  |
Top three noisy pixels from each quadrant. If the there are fewer than three noisy pixels in the level2.evt file, extra rows are filled as -1
| Pixel properties | Quadrant properties | ||||||
|---|---|---|---|---|---|---|---|
| Quadrant | DetID | PixID | Counts | Sigma | Mean | Median | Sigma |
| A | 0 | 29 | 1785 | 11.88 | 453 | 423 | 114.6 |
| A | 0 | 30 | 1422 | 8.72 | 453 | 423 | 114.6 |
| A | 7 | 110 | 1408 | 8.59 | 453 | 423 | 114.6 |
| B | 2 | 9 | 1392 | 10.87 | 439 | 417 | 89.7 |
| B | 2 | 8 | 1197 | 8.69 | 439 | 417 | 89.7 |
| B | 5 | 225 | 1107 | 7.69 | 439 | 417 | 89.7 |
| C | 3 | 234 | 1232 | 6.94 | 452 | 420 | 117.0 |
| C | 3 | 126 | 1213 | 6.78 | 452 | 420 | 117.0 |
| C | 12 | 241 | 1161 | 6.33 | 452 | 420 | 117.0 |
| D | 3 | 14 | 1159 | 6.82 | 421 | 382 | 114.0 |
| D | 7 | 3 | 1085 | 6.17 | 421 | 382 | 114.0 |
| D | 3 | 31 | 1072 | 6.05 | 421 | 382 | 114.0 |
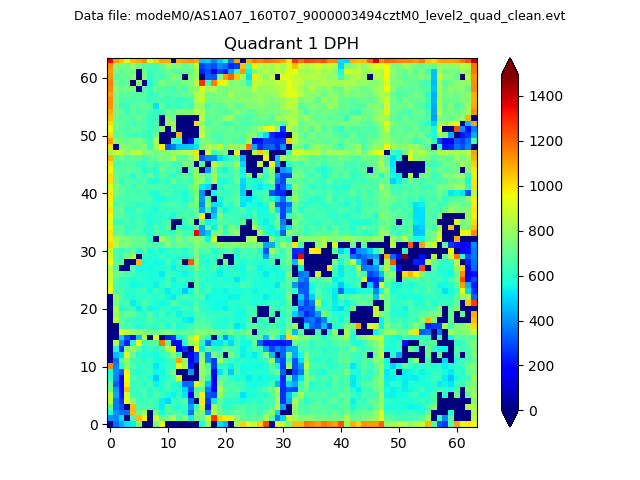
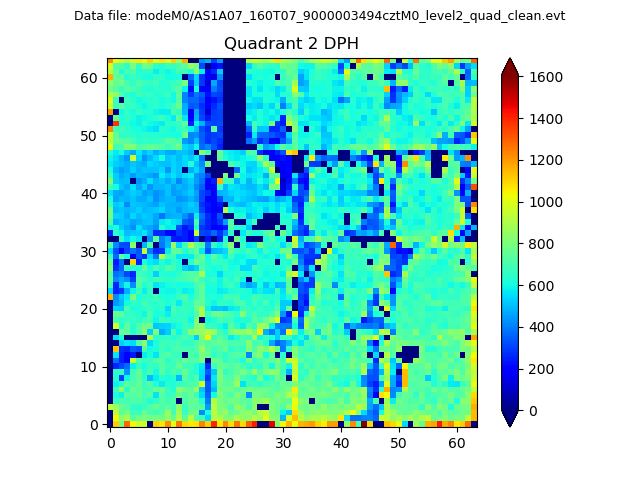
Histogram calculated using DETX and DETY for each event in the final _common_clean file
| Quadrant A |  |
 |
Quadrant B |
|---|---|---|---|
| Quadrant D |  |
 |
Quadrant C |
| Plot type | Count rate plots | Images |
|---|---|---|
| Comparison with Poisson distribution Blue bars denote a histogram of data divided into 1 sec bins. Red curve is a Poisson curve with rate = median count rate of data. |
 |
 |
| Quadrant-wise count rates Data is divided into 100 sec bins |
 |
|
| Module-wise count rates for Quadrant A Data is divided into 100 sec bins |
 |
 |
| Module-wise count rates for Quadrant B Data is divided into 100 sec bins |
 |
 |
| Module-wise count rates for Quadrant C Data is divided into 100 sec bins |
 |
 |
| Module-wise count rates for Quadrant D Data is divided into 100 sec bins |
 |
 |
| Parameter | Plot |
|---|---|
| CZT HV Monitor |  |
| D_VDD |  |
| Temperature 1 |  |
| Veto HV Monitor |  |
| Veto LLD |  |
| Alpha Counter |  |
| _CPM_Rate |  |
| CZT Counter |  |
| +2.5 Volts monitor |  |
| +5 Volts monitor |  |
| _ROLL_ROT |  |
| _Roll_DEC |  |
| _Roll_RA |  |
| Veto Counter |  |