| Param | Original file | Final file |
|---|---|---|
| Filename | modeM0/AS1A07_160T07_9000003494_23656cztM0_level2.evt | modeM0/AS1A07_160T07_9000003494_23656cztM0_level2_quad_clean.evt |
| Size (bytes) | 208,241,280 | 37,725,120 |
| Size | 198.6 MB | 36.0 MB |
| Events in quadrant A | 1,450,356 | 234,905 |
| Events in quadrant B | 1,639,623 | 239,850 |
| Events in quadrant C | 1,449,708 | 232,865 |
| Events in quadrant D | 1,569,438 | 229,121 |
| Mode SS | |||
|---|---|---|---|
| Quadrant | BADHDUFLAG | Total packets | Discarded packets |
| A | 0 | 60 | 0 |
| B | 0 | 60 | 0 |
| C | 0 | 60 | 0 |
| D | 0 | 60 | 0 |
| Mode M0 | |||
|---|---|---|---|
| Quadrant | BADHDUFLAG | Total packets | Discarded packets |
| A | 0 | 6131 | 1 |
| B | 0 | 6651 | 1 |
| C | 0 | 6138 | 1 |
| D | 0 | 6614 | 1 |
| Mode M9 | |||
|---|---|---|---|
| Quadrant | BADHDUFLAG | Total packets | Discarded packets |
| A | 0 | 2 | 0 |
| B | 0 | 2 | 0 |
| C | 0 | 2 | 0 |
| D | 0 | 2 | 0 |
| Quadrant | Total seconds | Saturated seconds | Saturation percentage |
|---|---|---|---|
| A | 2868 | 180 | 6.276151% |
| B | 2868 | 224 | 7.810321% |
| C | 2867 | 194 | 6.766655% |
| D | 2867 | 173 | 6.034182% |
Noise dominated data is calculated using 1-second bins in cleaned event files. If a bin has >2000 counts, and if more than 50% of those come from <1% of pixels, then it is considered to be noise-dominated and hence unusable.
| Quadrant | # 1 sec bins | Bins with >0 counts | Bins with >2000 counts | High rate bins dominated by noise | Noise dominated (total time) | Noise dominated (detector-on time) | Marked lightcurve |
|---|---|---|---|---|---|---|---|
| A | 3068 | 2868 | 0 | 0 | 0.00% | 0.00% | 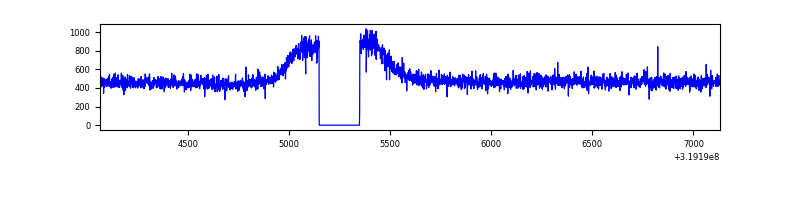 |
| B | 3068 | 2868 | 25 | 25 | 0.81% | 0.87% | 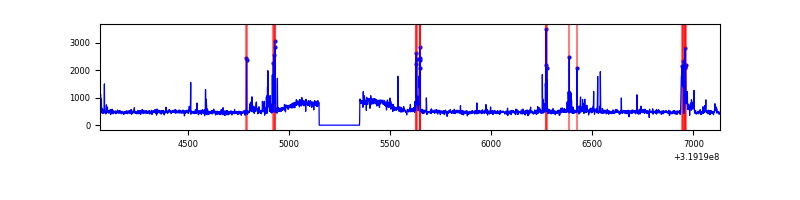 |
| C | 3067 | 2867 | 0 | 0 | 0.00% | 0.00% | 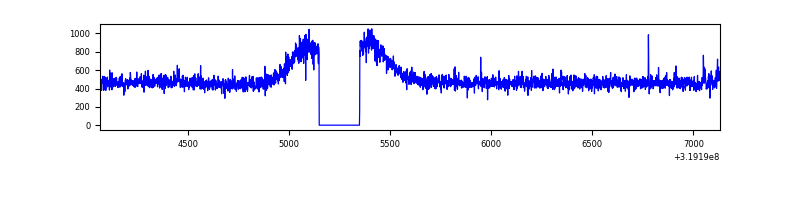 |
| D | 3067 | 2867 | 23 | 23 | 0.75% | 0.80% | 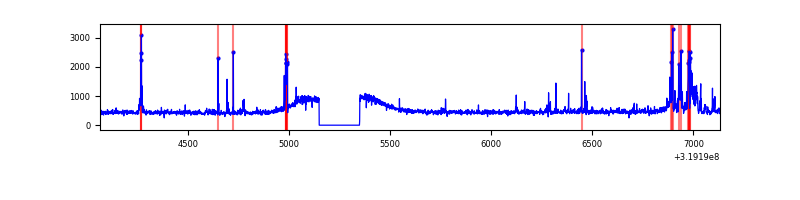 |
Top three noisy pixels from each quadrant. If the there are fewer than three noisy pixels in the level2.evt file, extra rows are filled as -1
| Pixel properties | Quadrant properties | ||||||
|---|---|---|---|---|---|---|---|
| Quadrant | DetID | PixID | Counts | Sigma | Mean | Median | Sigma |
| A | 13 | 254 | 4635 | 53.88 | 376 | 366 | 79.2 |
| A | 3 | 137 | 3584 | 40.62 | 376 | 366 | 79.2 |
| A | 0 | 226 | 3190 | 35.65 | 376 | 366 | 79.2 |
| B | 3 | 64 | 165387 | 2172.0 | 370 | 359 | 76.0 |
| B | 12 | 111 | 9204 | 116.41 | 370 | 359 | 76.0 |
| B | 0 | 229 | 8649 | 109.11 | 370 | 359 | 76.0 |
| C | 14 | 238 | 53312 | 616.46 | 356 | 357 | 85.9 |
| C | 7 | 247 | 7843 | 87.15 | 356 | 357 | 85.9 |
| C | 13 | 61 | 2464 | 24.53 | 356 | 357 | 85.9 |
| D | 13 | 189 | 61486 | 674.48 | 365 | 352 | 90.6 |
| D | 9 | 85 | 57010 | 625.09 | 365 | 352 | 90.6 |
| D | 12 | 233 | 45535 | 498.49 | 365 | 352 | 90.6 |
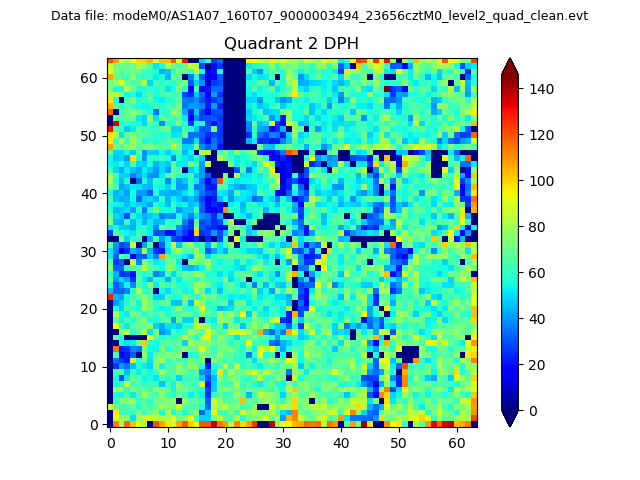
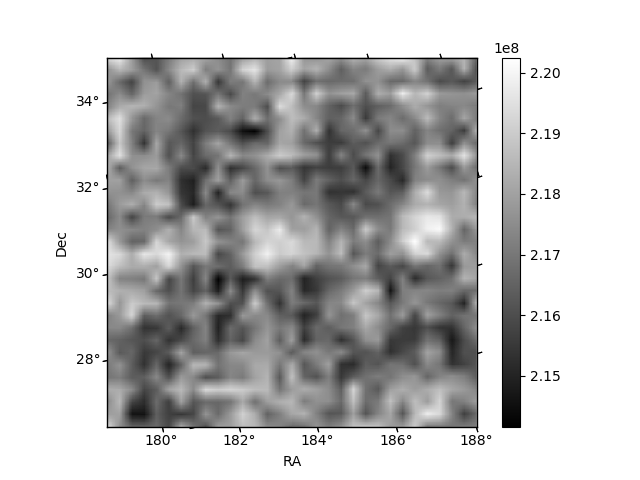
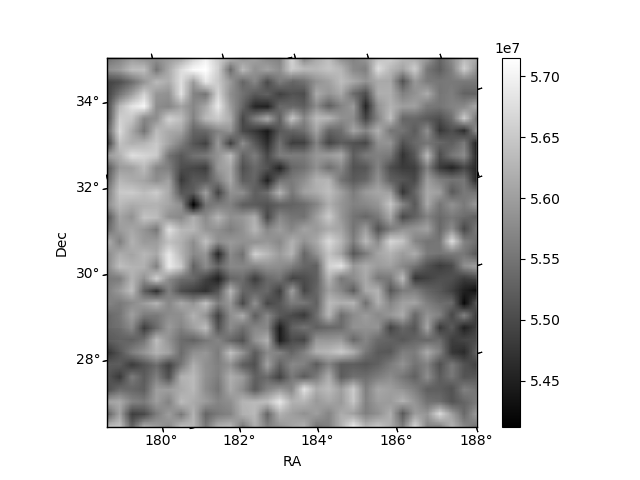
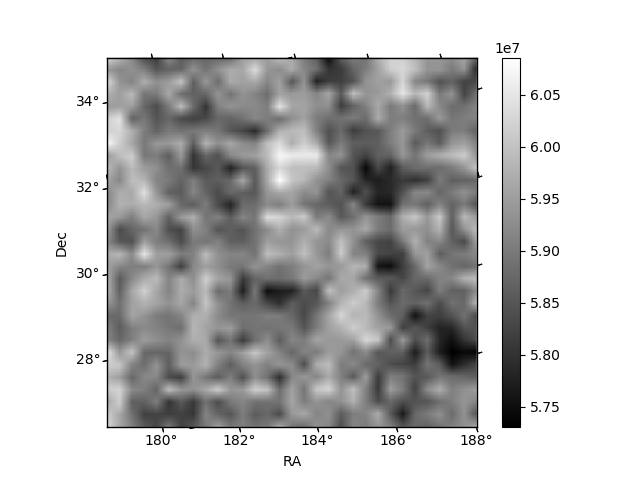
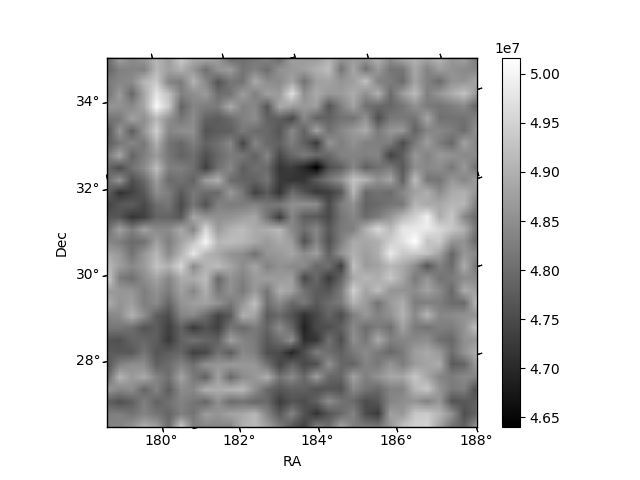
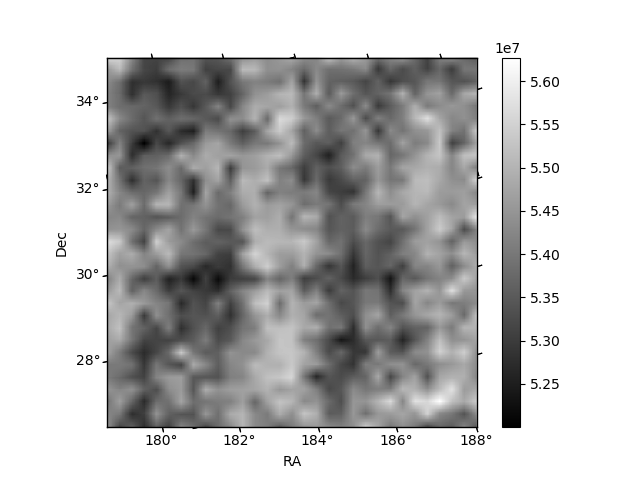
Histogram calculated using DETX and DETY for each event in the final _common_clean file
| Quadrant A | 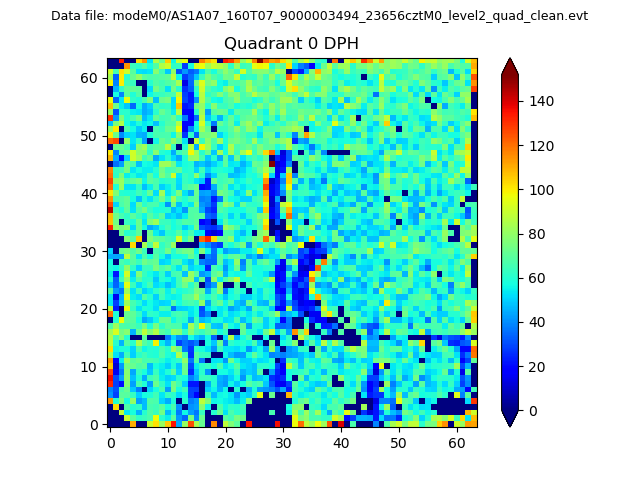 |
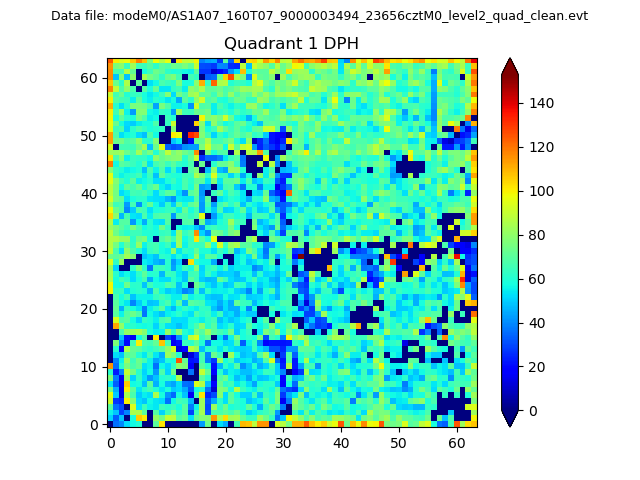 |
Quadrant B |
|---|---|---|---|
| Quadrant D | 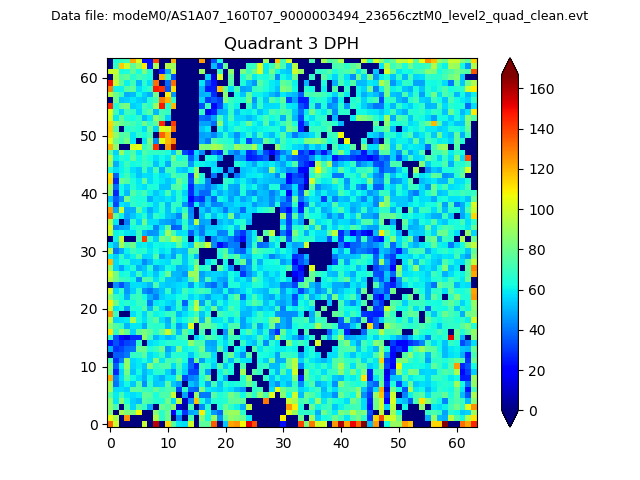 |
 |
Quadrant C |
| Plot type | Count rate plots | Images |
|---|---|---|
| Comparison with Poisson distribution Blue bars denote a histogram of data divided into 1 sec bins. Red curve is a Poisson curve with rate = median count rate of data. |
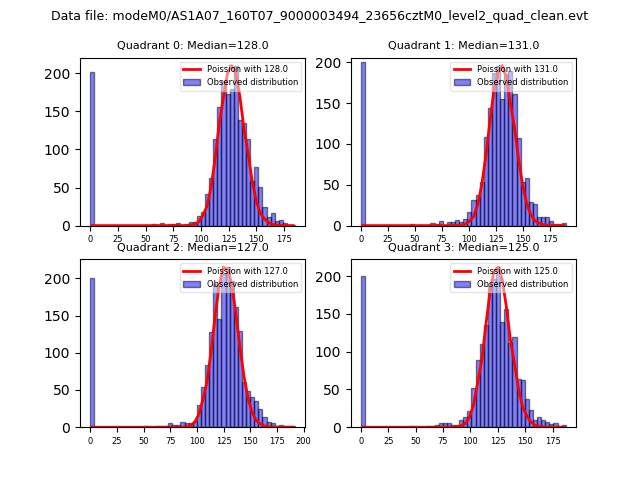 |
 |
| Quadrant-wise count rates Data is divided into 100 sec bins |
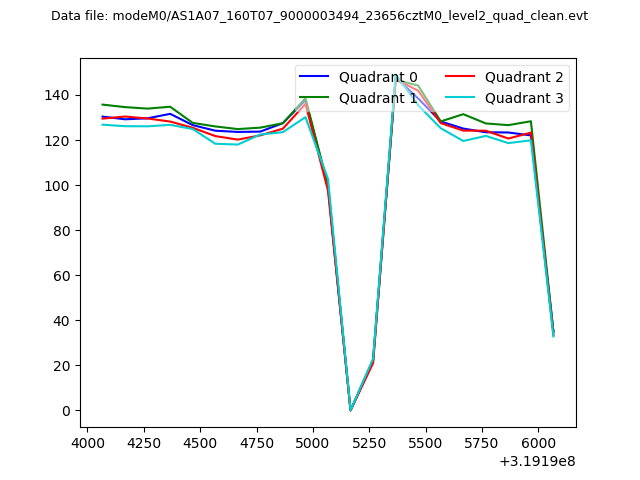 |
|
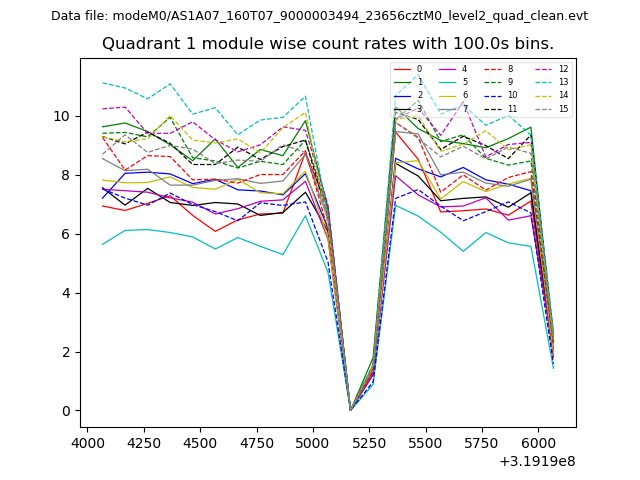
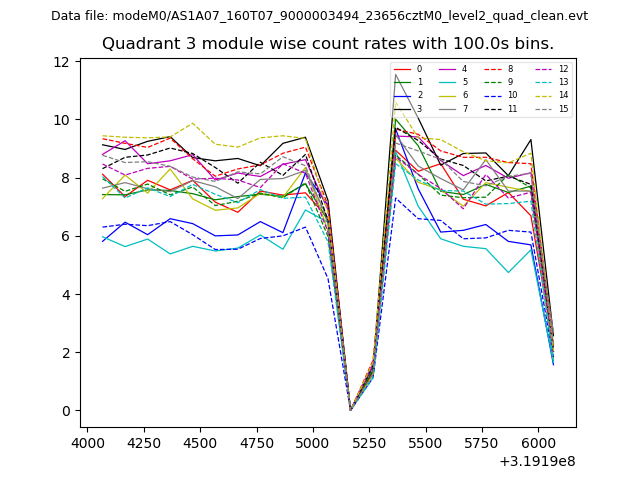
| Module-wise count rates for Quadrant A Data is divided into 100 sec bins |
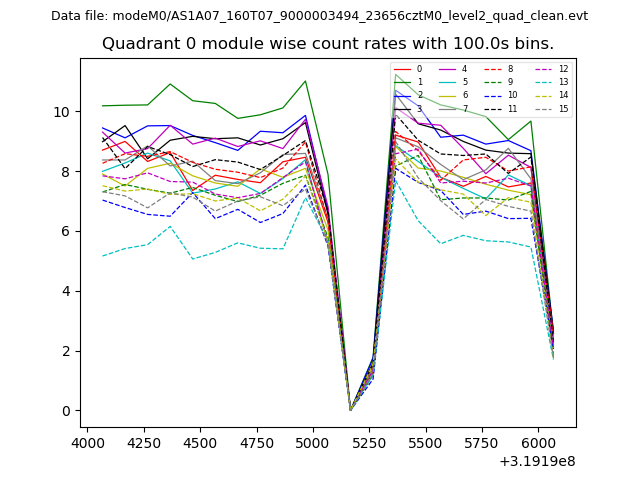 |
 |
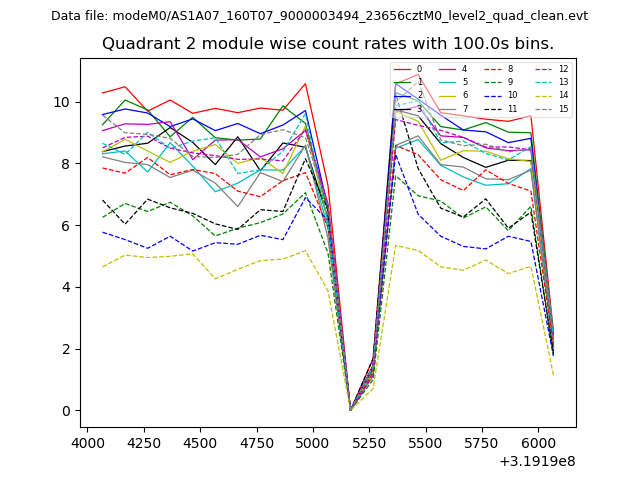
| Module-wise count rates for Quadrant B Data is divided into 100 sec bins |
 |
 |
| Module-wise count rates for Quadrant C Data is divided into 100 sec bins |
 |
 |
| Module-wise count rates for Quadrant D Data is divided into 100 sec bins |
 |
 |
| Parameter | Plot |
|---|---|
| CZT HV Monitor | 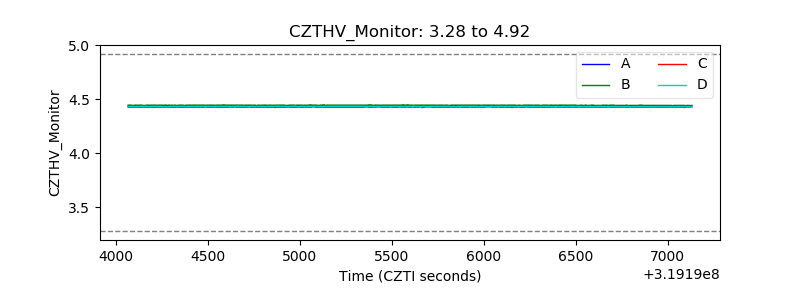 |
| D_VDD | 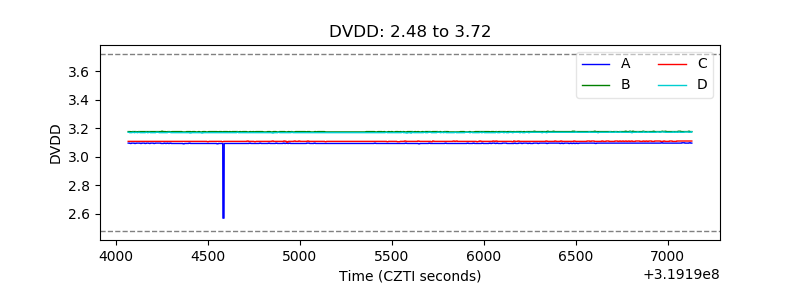 |
| Temperature 1 | 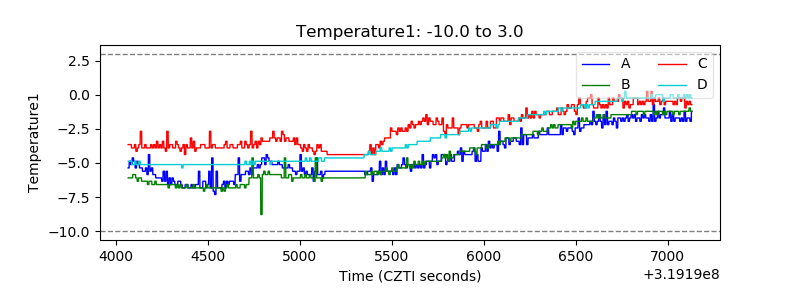 |
| Veto HV Monitor |  |
| Veto LLD |  |
| Alpha Counter | 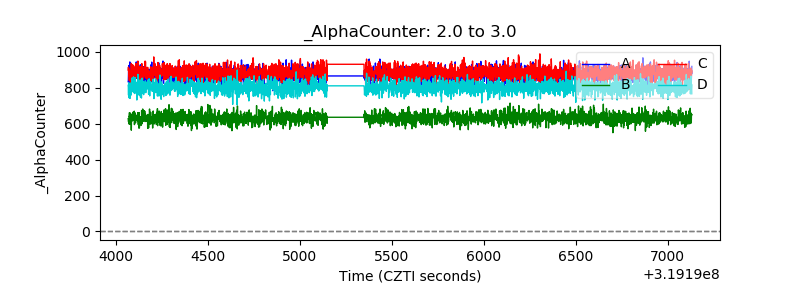 |
| _CPM_Rate | 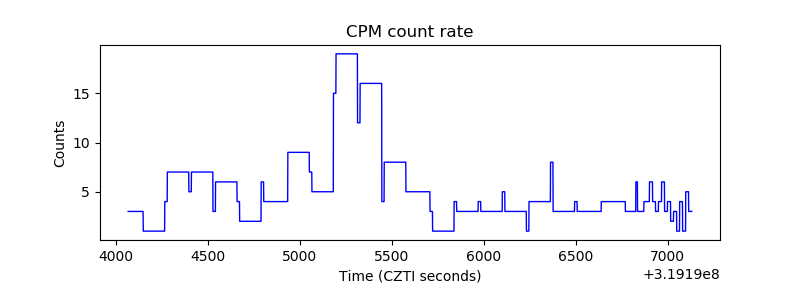 |
| CZT Counter | 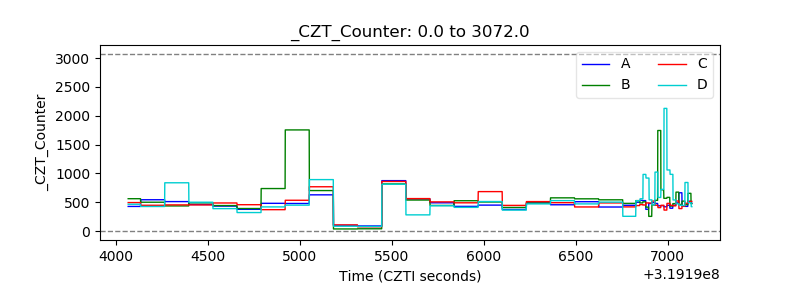 |
| +2.5 Volts monitor |  |
| +5 Volts monitor |  |
| _ROLL_ROT | 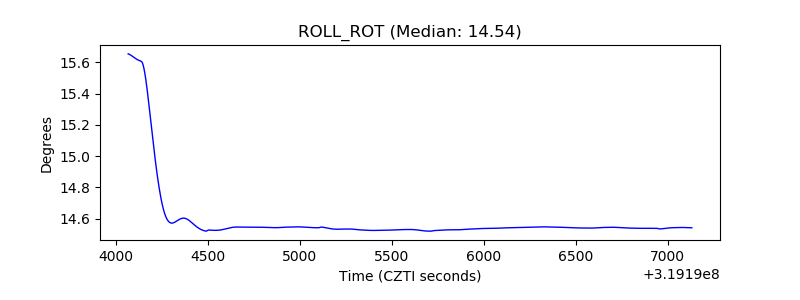 |
| _Roll_DEC | 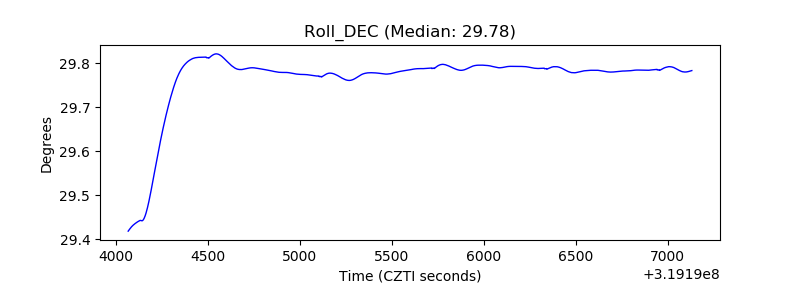 |
| _Roll_RA | 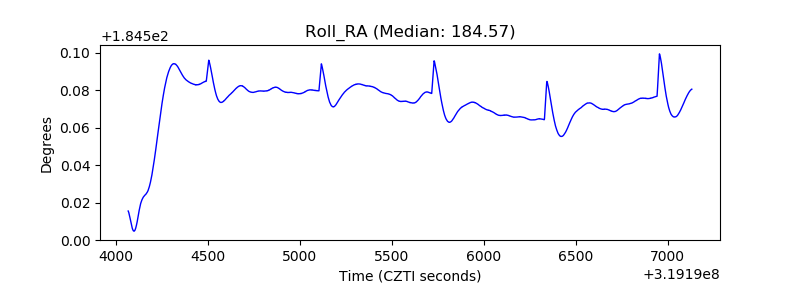 |
| Veto Counter | 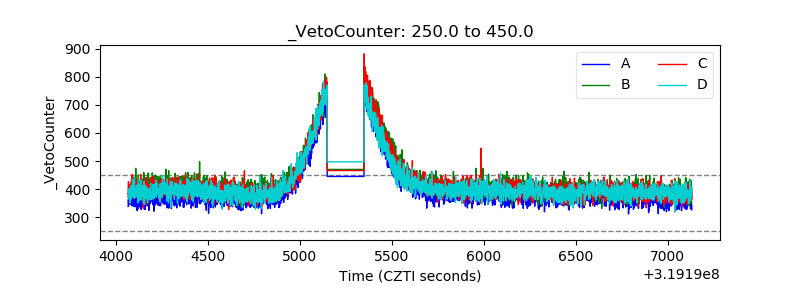 |