| Param | Original file | Final file |
|---|---|---|
| Filename | modeM0/AS1A07_160T07_9000003494_23657cztM0_level2.evt | modeM0/AS1A07_160T07_9000003494_23657cztM0_level2_quad_clean.evt |
| Size (bytes) | 620,994,240 | 105,707,520 |
| Size | 592.2 MB | 100.8 MB |
| Events in quadrant A | 4,218,112 | 655,460 |
| Events in quadrant B | 4,989,187 | 660,112 |
| Events in quadrant C | 4,250,498 | 644,802 |
| Events in quadrant D | 4,758,077 | 635,613 |
| Mode SS | |||
|---|---|---|---|
| Quadrant | BADHDUFLAG | Total packets | Discarded packets |
| A | 0 | 178 | 0 |
| B | 0 | 178 | 0 |
| C | 0 | 178 | 0 |
| D | 0 | 178 | 0 |
| Mode M0 | |||
|---|---|---|---|
| Quadrant | BADHDUFLAG | Total packets | Discarded packets |
| A | 0 | 18152 | 3 |
| B | 0 | 20167 | 2 |
| C | 0 | 18187 | 2 |
| D | 0 | 20036 | 2 |
| Mode M9 | |||
|---|---|---|---|
| Quadrant | BADHDUFLAG | Total packets | Discarded packets |
| A | 0 | 5 | 0 |
| B | 0 | 5 | 0 |
| C | 0 | 5 | 0 |
| D | 0 | 5 | 0 |
| Quadrant | Total seconds | Saturated seconds | Saturation percentage |
|---|---|---|---|
| A | 8710 | 316 | 3.628014% |
| B | 8710 | 446 | 5.120551% |
| C | 8710 | 353 | 4.052813% |
| D | 8710 | 338 | 3.880597% |
Noise dominated data is calculated using 1-second bins in cleaned event files. If a bin has >2000 counts, and if more than 50% of those come from <1% of pixels, then it is considered to be noise-dominated and hence unusable.
| Quadrant | # 1 sec bins | Bins with >0 counts | Bins with >2000 counts | High rate bins dominated by noise | Noise dominated (total time) | Noise dominated (detector-on time) | Marked lightcurve |
|---|---|---|---|---|---|---|---|
| A | 9210 | 8710 | 0 | 0 | 0.00% | 0.00% | 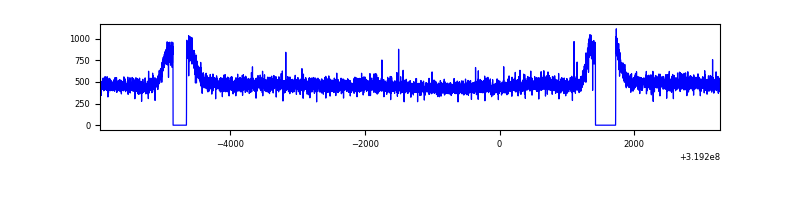 |
| B | 9210 | 8710 | 83 | 83 | 0.90% | 0.95% | 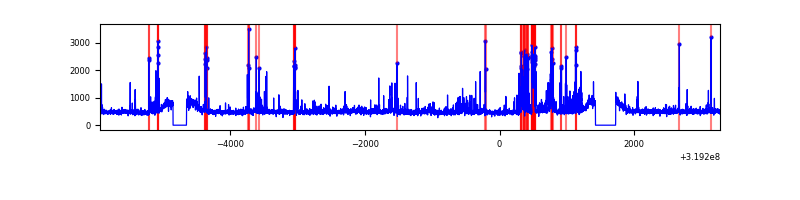 |
| C | 9210 | 8710 | 0 | 0 | 0.00% | 0.00% | 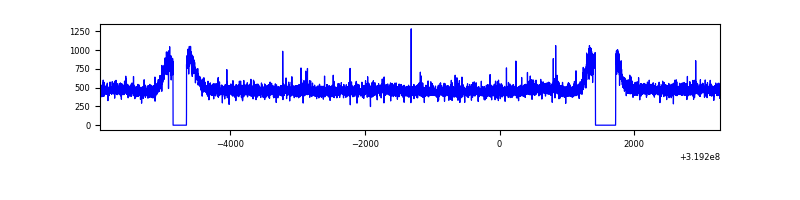 |
| D | 9210 | 8710 | 64 | 64 | 0.69% | 0.73% | 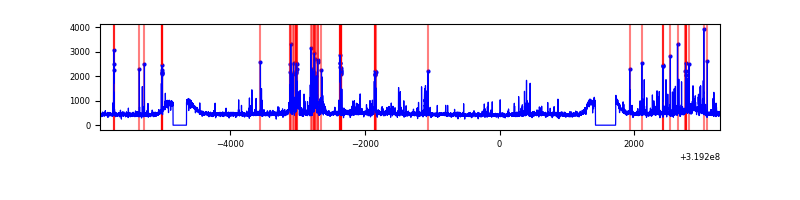 |
Top three noisy pixels from each quadrant. If the there are fewer than three noisy pixels in the level2.evt file, extra rows are filled as -1
| Pixel properties | Quadrant properties | ||||||
|---|---|---|---|---|---|---|---|
| Quadrant | DetID | PixID | Counts | Sigma | Mean | Median | Sigma |
| A | 13 | 254 | 14888 | 61.49 | 1093 | 1067 | 224.8 |
| A | 3 | 137 | 10228 | 40.76 | 1093 | 1067 | 224.8 |
| A | 0 | 226 | 9316 | 36.7 | 1093 | 1067 | 224.8 |
| B | 3 | 64 | 561721 | 2640.23 | 1076 | 1046 | 212.4 |
| B | 0 | 229 | 49684 | 229.04 | 1076 | 1046 | 212.4 |
| B | 0 | 189 | 40961 | 187.96 | 1076 | 1046 | 212.4 |
| C | 14 | 238 | 158786 | 636.78 | 1044 | 1047 | 247.7 |
| C | 7 | 247 | 22765 | 87.67 | 1044 | 1047 | 247.7 |
| C | 13 | 61 | 7246 | 25.02 | 1044 | 1047 | 247.7 |
| D | 12 | 233 | 205255 | 781.39 | 1062 | 1032 | 261.4 |
| D | 9 | 85 | 201186 | 765.82 | 1062 | 1032 | 261.4 |
| D | 13 | 189 | 160232 | 609.12 | 1062 | 1032 | 261.4 |
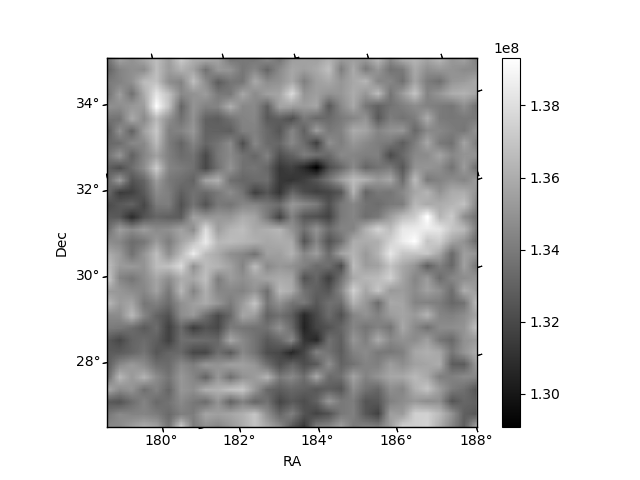
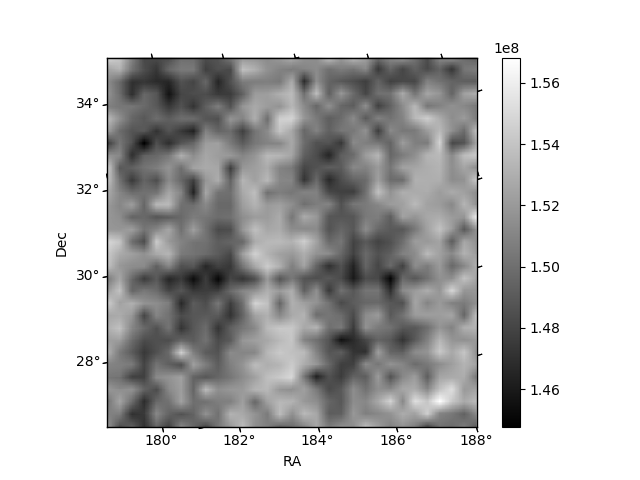
Histogram calculated using DETX and DETY for each event in the final _common_clean file
| Quadrant A |  |
 |
Quadrant B |
|---|---|---|---|
| Quadrant D |  |
 |
Quadrant C |
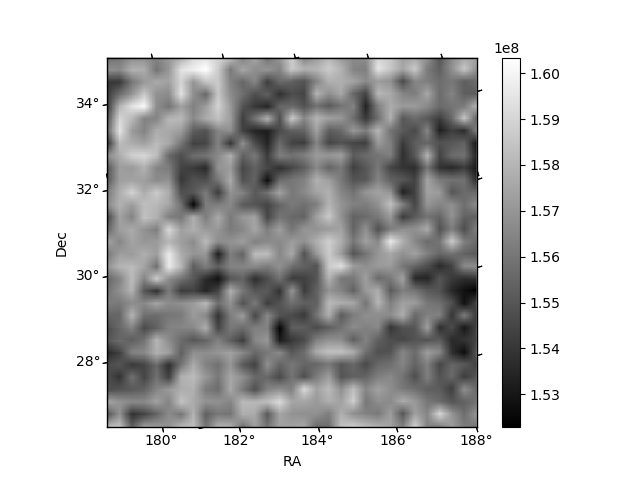
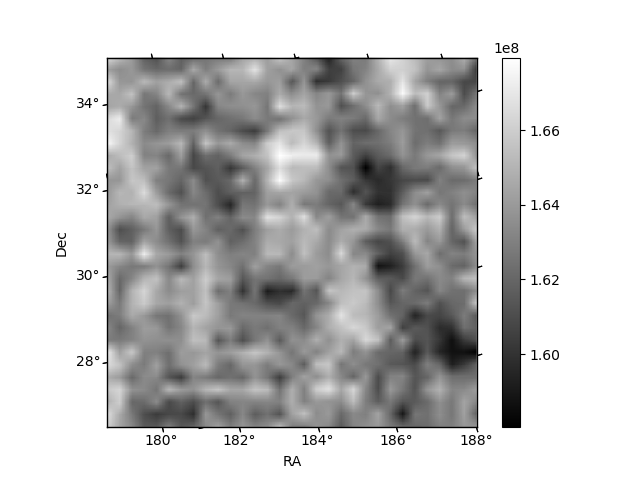
| Plot type | Count rate plots | Images |
|---|---|---|
| Comparison with Poisson distribution Blue bars denote a histogram of data divided into 1 sec bins. Red curve is a Poisson curve with rate = median count rate of data. |
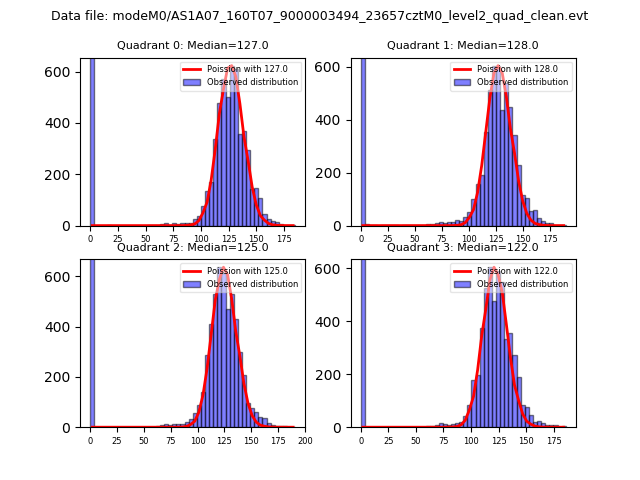 |
 |
| Quadrant-wise count rates Data is divided into 100 sec bins |
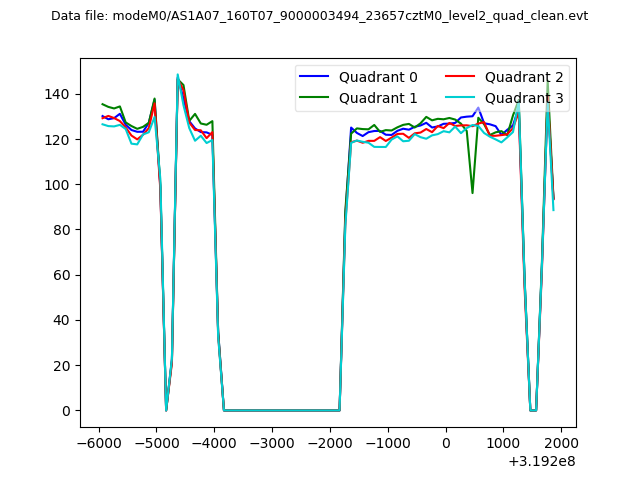 |
|
| Module-wise count rates for Quadrant A Data is divided into 100 sec bins |
 |
 |
| Module-wise count rates for Quadrant B Data is divided into 100 sec bins |
 |
 |
| Module-wise count rates for Quadrant C Data is divided into 100 sec bins |
 |
 |
| Module-wise count rates for Quadrant D Data is divided into 100 sec bins |
 |
 |
| Parameter | Plot |
|---|---|
| CZT HV Monitor |  |
| D_VDD | 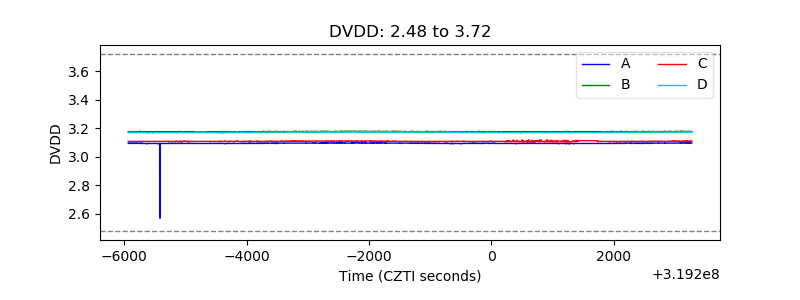 |
| Temperature 1 |  |
| Veto HV Monitor |  |
| Veto LLD |  |
| Alpha Counter | 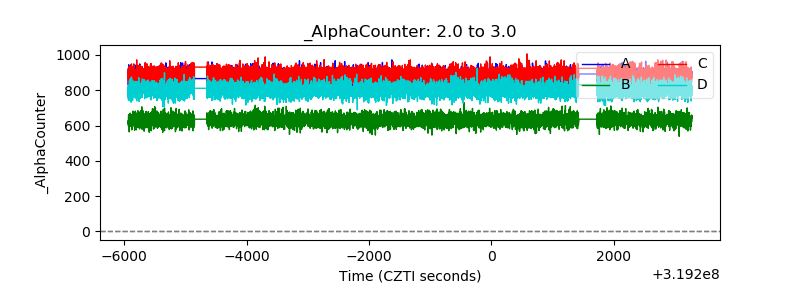 |
| _CPM_Rate | 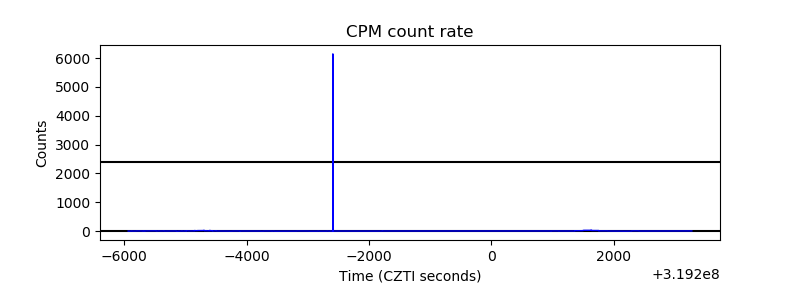 |
| CZT Counter |  |
| +2.5 Volts monitor |  |
| +5 Volts monitor |  |
| _ROLL_ROT |  |
| _Roll_DEC |  |
| _Roll_RA |  |
| Veto Counter |  |