| Param | Original file | Final file |
|---|---|---|
| Filename | modeM0/AS1A07_160T07_9000003494_23660cztM0_level2.evt | modeM0/AS1A07_160T07_9000003494_23660cztM0_level2_quad_clean.evt |
| Size (bytes) | 1,319,368,320 | 229,132,800 |
| Size | 1.2 GB | 218.5 MB |
| Events in quadrant A | 8,772,003 | 1,434,116 |
| Events in quadrant B | 9,945,706 | 1,446,679 |
| Events in quadrant C | 8,887,976 | 1,406,974 |
| Events in quadrant D | 11,093,364 | 1,369,763 |
| Mode SS | |||
|---|---|---|---|
| Quadrant | BADHDUFLAG | Total packets | Discarded packets |
| A | 0 | 382 | 0 |
| B | 0 | 382 | 0 |
| C | 0 | 382 | 0 |
| D | 0 | 382 | 0 |
| Mode M0 | |||
|---|---|---|---|
| Quadrant | BADHDUFLAG | Total packets | Discarded packets |
| A | 0 | 38219 | 4 |
| B | 0 | 41244 | 4 |
| C | 0 | 38248 | 4 |
| D | 0 | 45837 | 4 |
| Mode M9 | |||
|---|---|---|---|
| Quadrant | BADHDUFLAG | Total packets | Discarded packets |
| A | 0 | 22 | 0 |
| B | 0 | 22 | 0 |
| C | 0 | 22 | 0 |
| D | 0 | 22 | 0 |
| Quadrant | Total seconds | Saturated seconds | Saturation percentage |
|---|---|---|---|
| A | 18598 | 265 | 1.424884% |
| B | 18599 | 466 | 2.505511% |
| C | 18599 | 382 | 2.053874% |
| D | 18599 | 896 | 4.817463% |
Noise dominated data is calculated using 1-second bins in cleaned event files. If a bin has >2000 counts, and if more than 50% of those come from <1% of pixels, then it is considered to be noise-dominated and hence unusable.
| Quadrant | # 1 sec bins | Bins with >0 counts | Bins with >2000 counts | High rate bins dominated by noise | Noise dominated (total time) | Noise dominated (detector-on time) | Marked lightcurve |
|---|---|---|---|---|---|---|---|
| A | 20943 | 18598 | 0 | 0 | 0.00% | 0.00% | 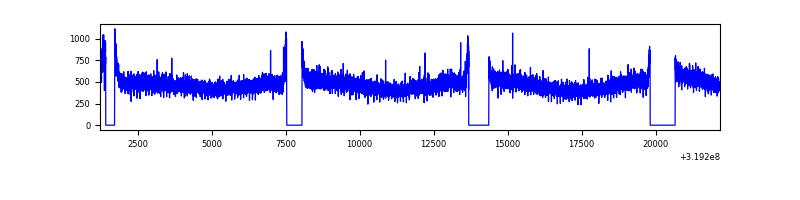 |
| B | 20944 | 18599 | 109 | 109 | 0.52% | 0.59% | 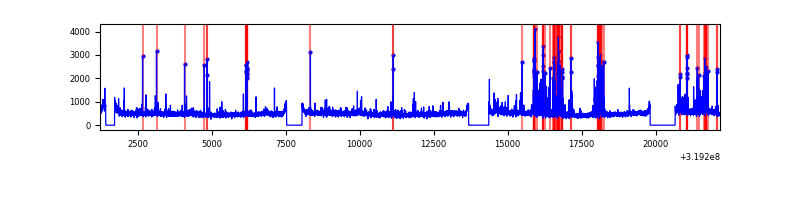 |
| C | 20944 | 18599 | 0 | 0 | 0.00% | 0.00% | 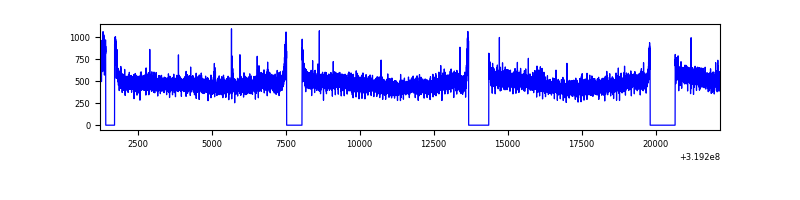 |
| D | 20944 | 18599 | 511 | 511 | 2.44% | 2.75% | 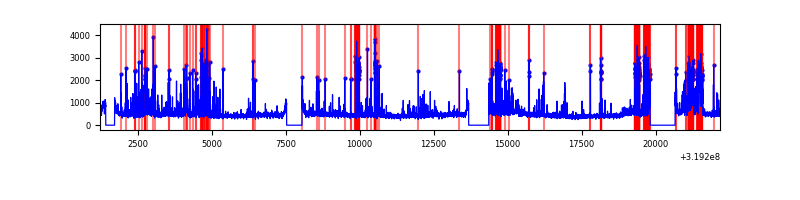 |
Top three noisy pixels from each quadrant. If the there are fewer than three noisy pixels in the level2.evt file, extra rows are filled as -1
| Pixel properties | Quadrant properties | ||||||
|---|---|---|---|---|---|---|---|
| Quadrant | DetID | PixID | Counts | Sigma | Mean | Median | Sigma |
| A | 13 | 254 | 31396 | 63.68 | 2272 | 2219 | 458.2 |
| A | 3 | 137 | 20995 | 40.98 | 2272 | 2219 | 458.2 |
| A | 0 | 226 | 19429 | 37.56 | 2272 | 2219 | 458.2 |
| B | 3 | 64 | 695774 | 1598.56 | 2255 | 2193 | 433.9 |
| B | 0 | 229 | 144153 | 327.19 | 2255 | 2193 | 433.9 |
| B | 0 | 189 | 133756 | 303.22 | 2255 | 2193 | 433.9 |
| C | 14 | 238 | 342040 | 665.16 | 2183 | 2194 | 510.9 |
| C | 7 | 247 | 43858 | 81.55 | 2183 | 2194 | 510.9 |
| C | 13 | 61 | 15188 | 25.43 | 2183 | 2194 | 510.9 |
| D | 1 | 52 | 1219042 | 2282.17 | 2185 | 2120 | 533.2 |
| D | 12 | 233 | 648476 | 1212.15 | 2185 | 2120 | 533.2 |
| D | 9 | 85 | 468758 | 875.12 | 2185 | 2120 | 533.2 |
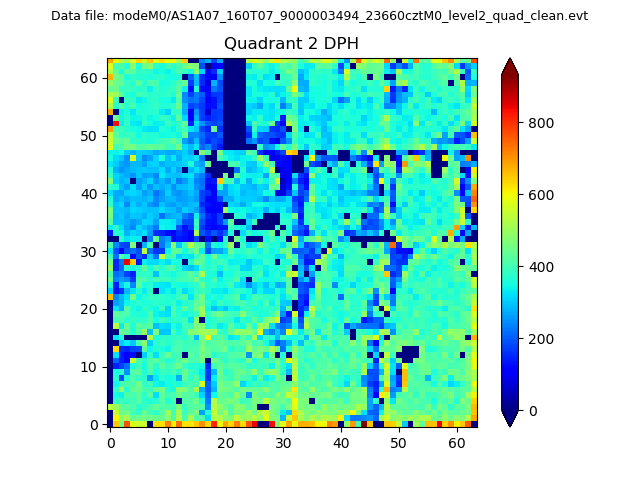
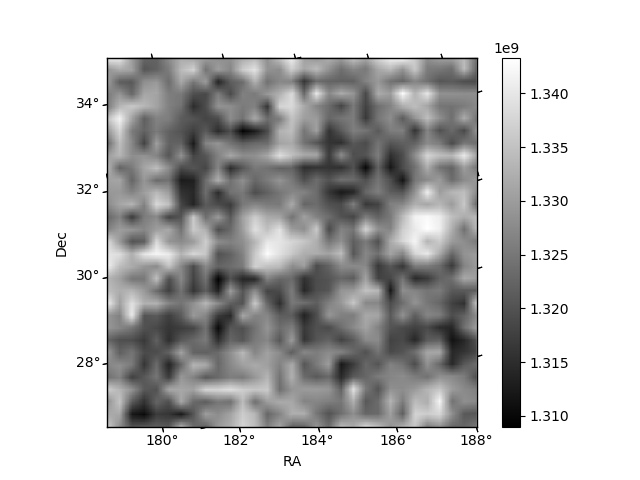
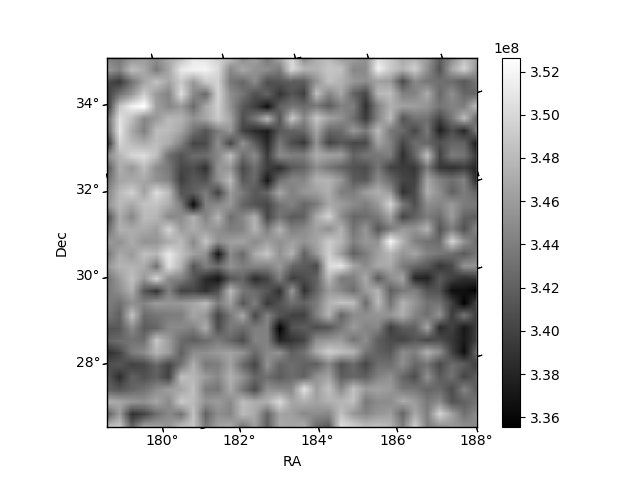
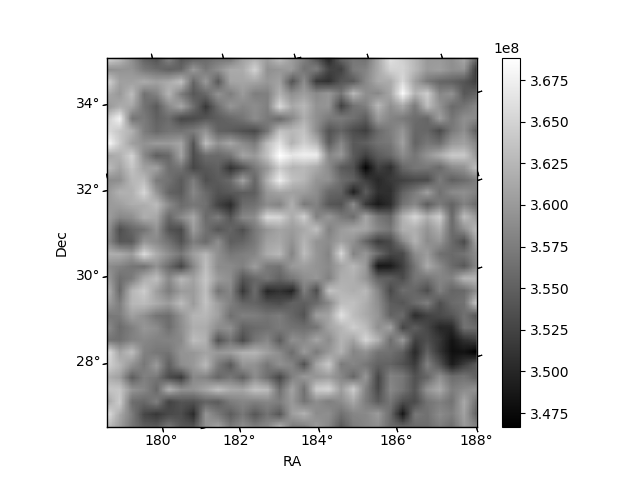
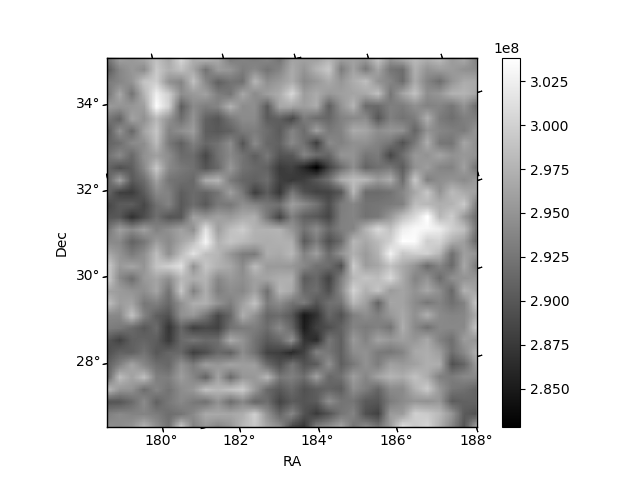
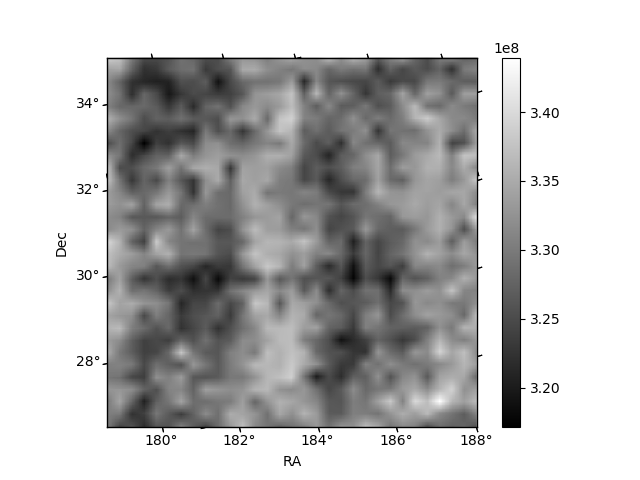
Histogram calculated using DETX and DETY for each event in the final _common_clean file
| Quadrant A | 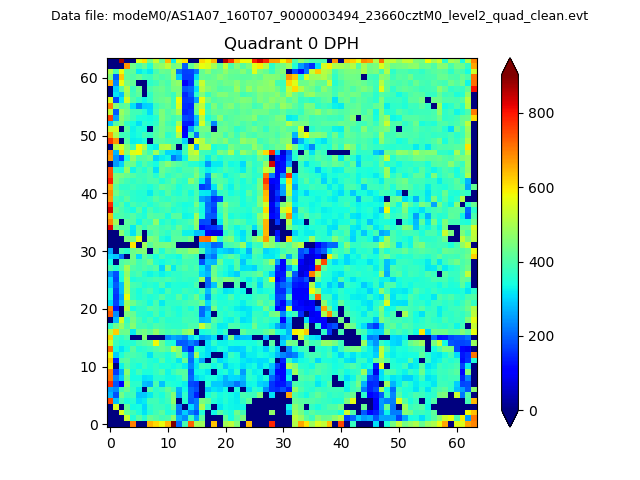 |
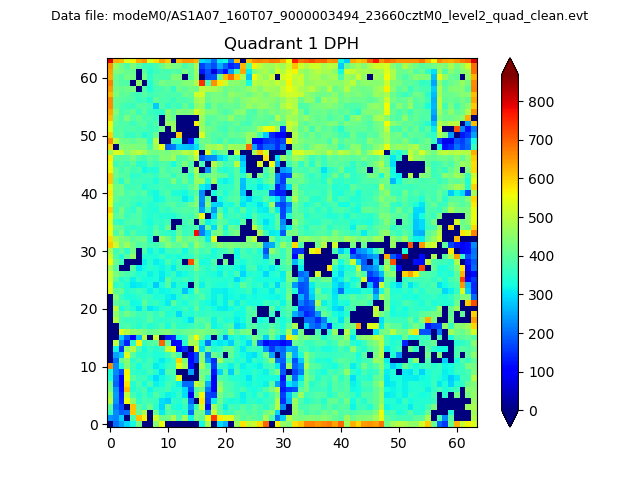 |
Quadrant B |
|---|---|---|---|
| Quadrant D | 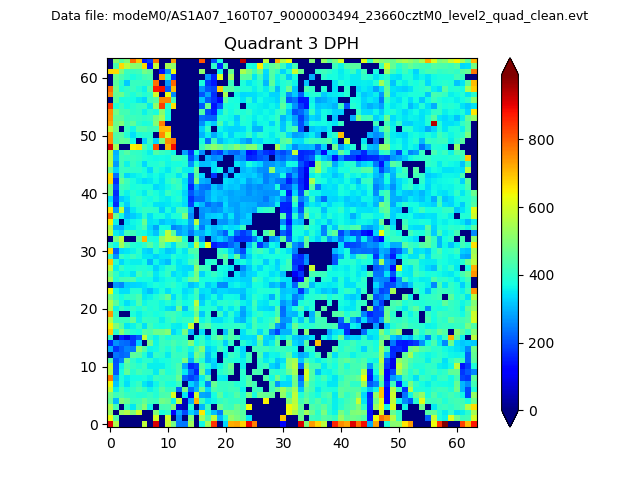 |
 |
Quadrant C |
| Plot type | Count rate plots | Images |
|---|---|---|
| Comparison with Poisson distribution Blue bars denote a histogram of data divided into 1 sec bins. Red curve is a Poisson curve with rate = median count rate of data. |
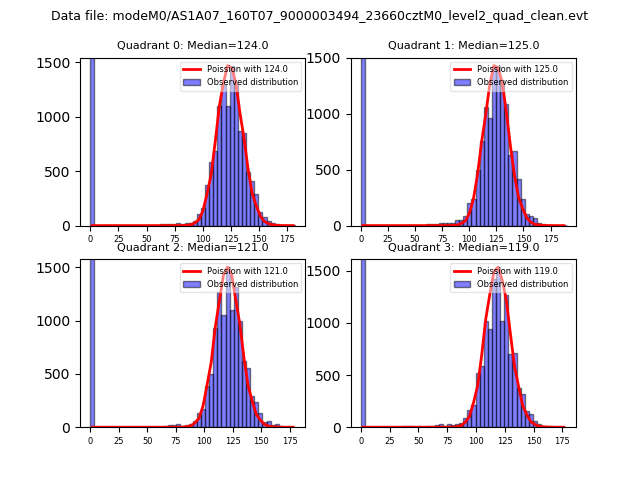 |
 |
| Quadrant-wise count rates Data is divided into 100 sec bins |
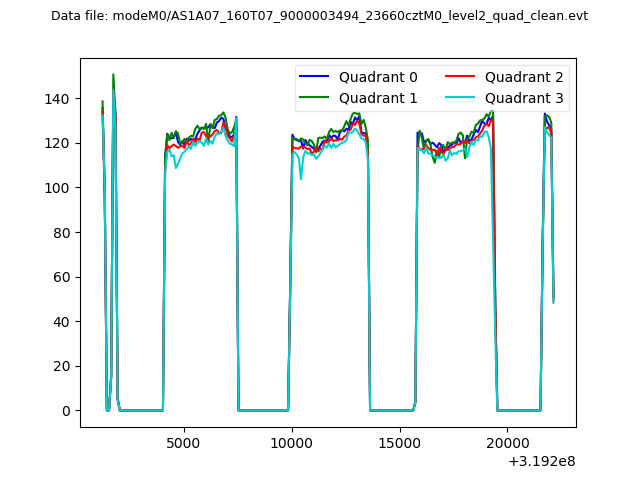 |
|
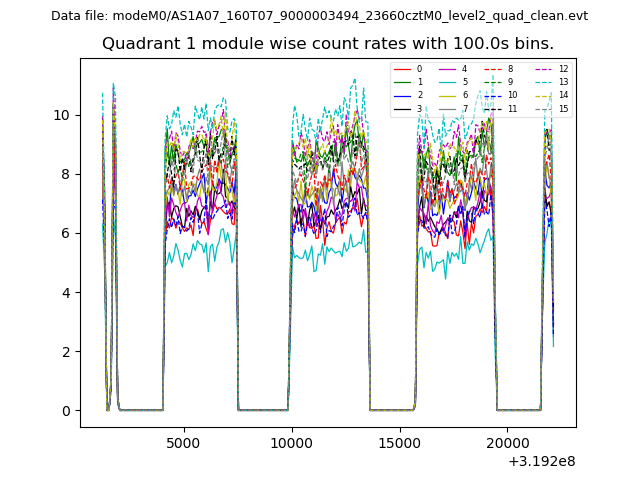
| Module-wise count rates for Quadrant A Data is divided into 100 sec bins |
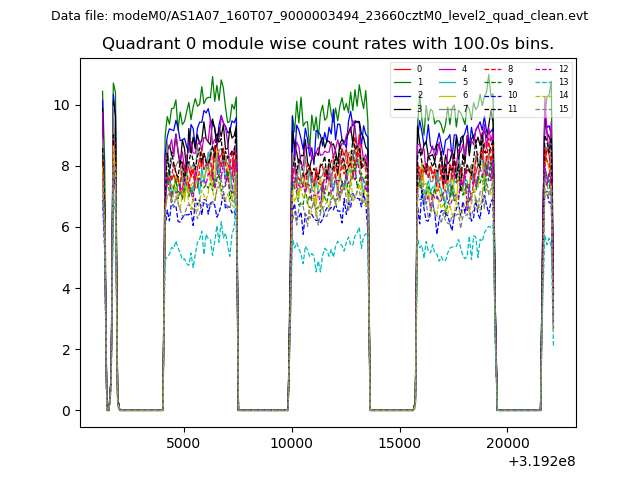 |
 |
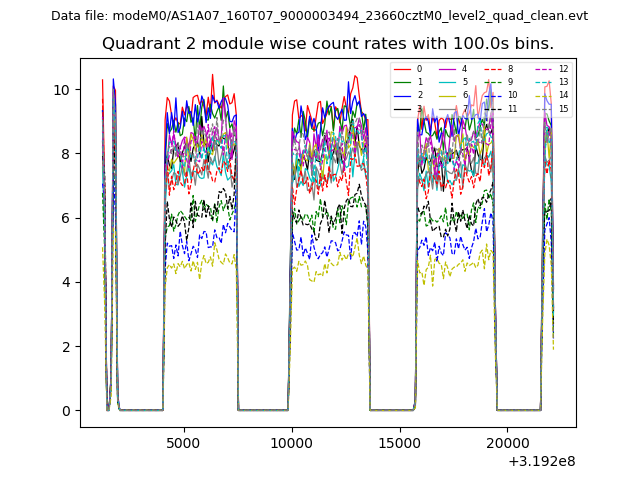
| Module-wise count rates for Quadrant B Data is divided into 100 sec bins |
 |
 |
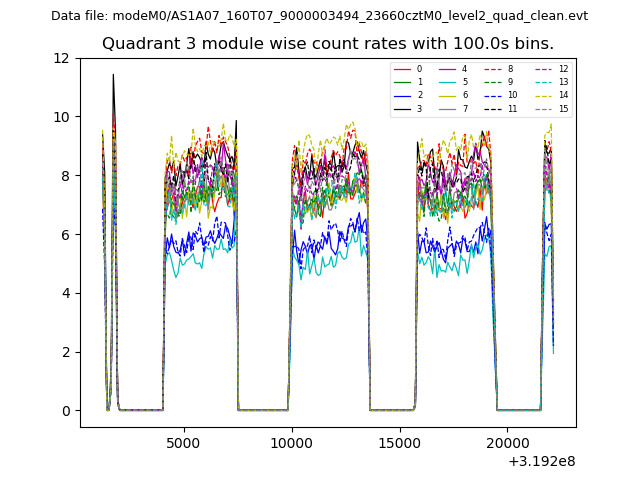
| Module-wise count rates for Quadrant C Data is divided into 100 sec bins |
 |
 |
| Module-wise count rates for Quadrant D Data is divided into 100 sec bins |
 |
 |
| Parameter | Plot |
|---|---|
| CZT HV Monitor | 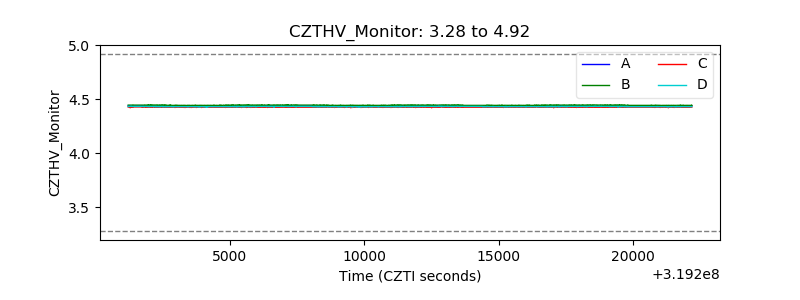 |
| D_VDD |  |
| Temperature 1 | 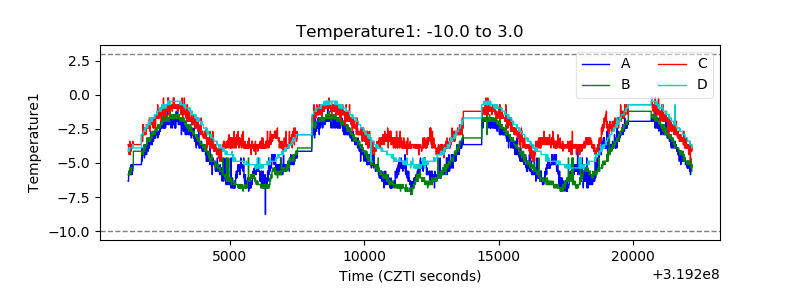 |
| Veto HV Monitor | 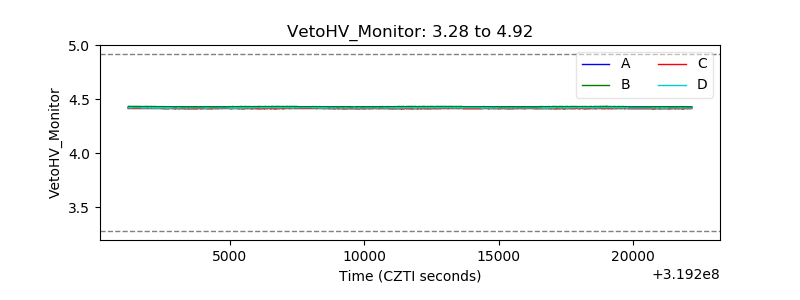 |
| Veto LLD | 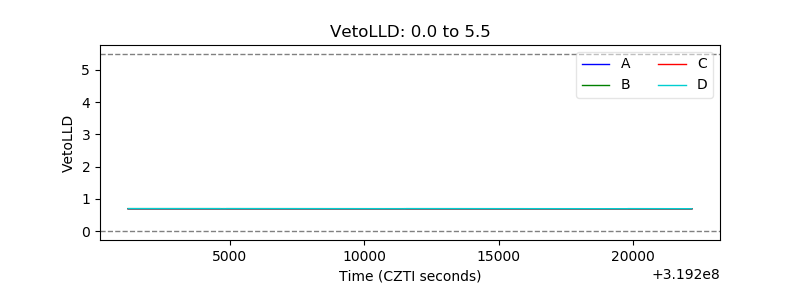 |
| Alpha Counter | 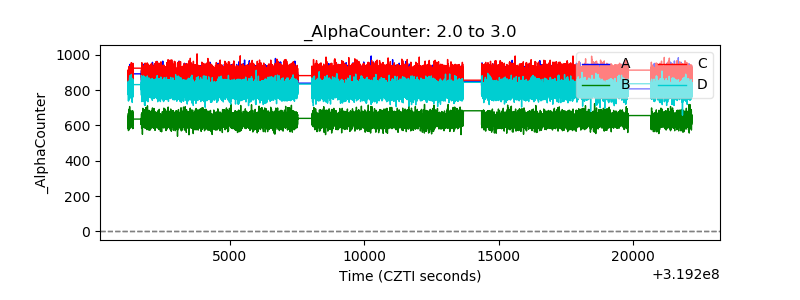 |
| _CPM_Rate | 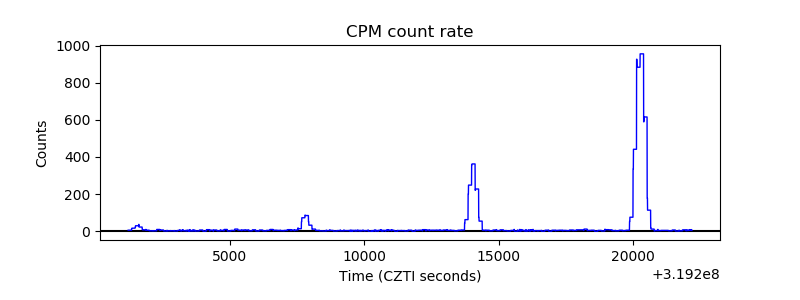 |
| CZT Counter | 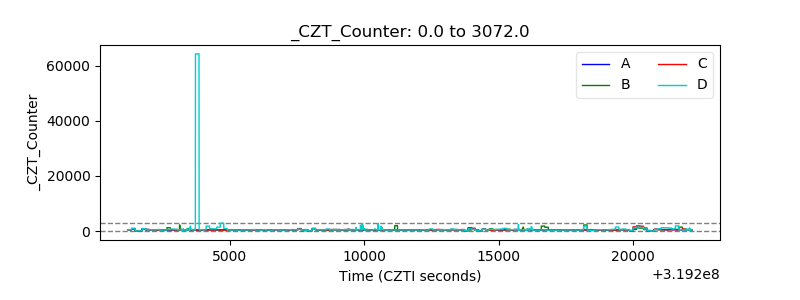 |
| +2.5 Volts monitor |  |
| +5 Volts monitor |  |
| _ROLL_ROT | 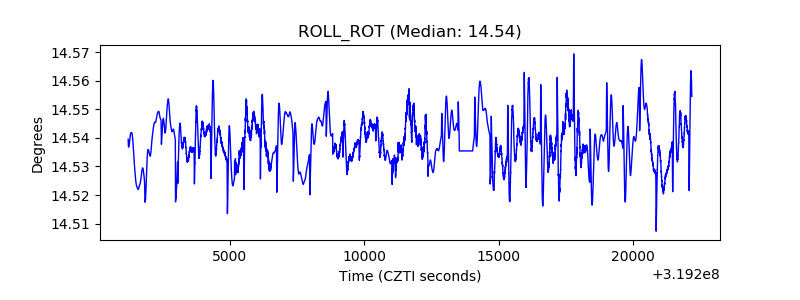 |
| _Roll_DEC | 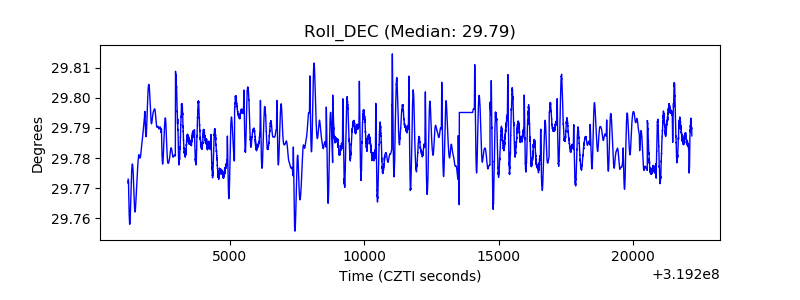 |
| _Roll_RA | 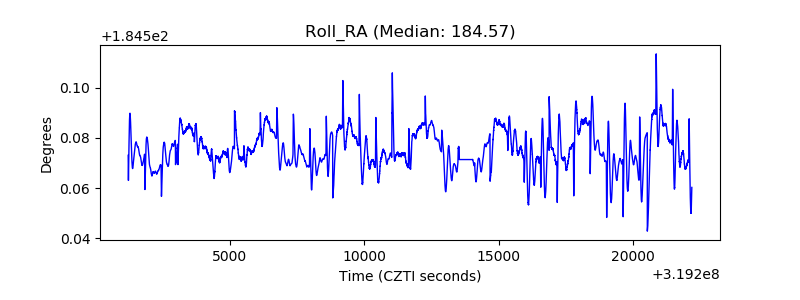 |
| Veto Counter | 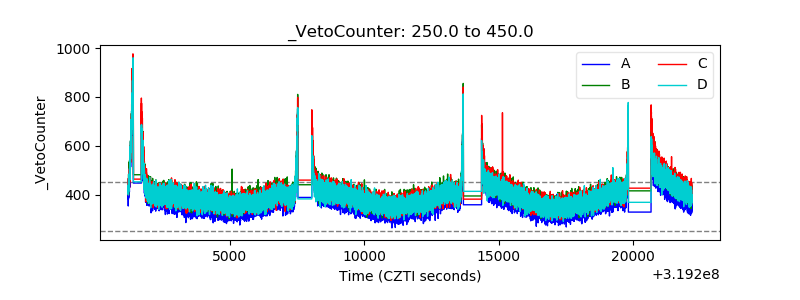 |