| Param | Original file | Final file |
|---|---|---|
| Filename | modeM0/AS1A08_004T02_9000003496cztM0_level2.fits | modeM0/AS1A08_004T02_9000003496cztM0_level2_quad_clean.evt |
| Size (bytes) | 459,610,560 | 408,032,640 |
| Size | 438.3 MB | 389.1 MB |
| Events in quadrant A | 2,848,350 | 2,424,669 |
| Events in quadrant B | 2,710,176 | 2,386,793 |
| Events in quadrant C | 2,806,326 | 2,342,038 |
| Events in quadrant D | 2,381,654 | 2,031,213 |
| Mode M9 | |||
|---|---|---|---|
| Quadrant | BADHDUFLAG | Total packets | Discarded packets |
| A | 0 | 88 | 0 |
| B | 0 | 88 | 0 |
| C | 0 | 88 | 0 |
| D | 0 | 88 | 0 |
| Mode M0 | |||
|---|---|---|---|
| Quadrant | BADHDUFLAG | Total packets | Discarded packets |
| A | 0 | 95178 | 0 |
| B | 0 | 111022 | 0 |
| C | 0 | 96192 | 0 |
| D | 0 | 122732 | 0 |
| Mode SS | |||
|---|---|---|---|
| Quadrant | BADHDUFLAG | Total packets | Discarded packets |
| A | 0 | 940 | 0 |
| B | 0 | 939 | 0 |
| C | 0 | 940 | 0 |
| D | 0 | 940 | 0 |
| Quadrant | Total seconds | Saturated seconds | Saturation percentage |
|---|---|---|---|
| A | 46227 | 533 | 1.153006% |
| B | 46220 | 1870 | 4.045868% |
| C | 46210 | 858 | 1.856741% |
| D | 46211 | 2631 | 5.693450% |
Noise dominated data is calculated using 1-second bins in cleaned event files. If a bin has >2000 counts, and if more than 50% of those come from <1% of pixels, then it is considered to be noise-dominated and hence unusable.
| Quadrant | # 1 sec bins | Bins with >0 counts | Bins with >2000 counts | High rate bins dominated by noise | Noise dominated (total time) | Noise dominated (detector-on time) | Marked lightcurve |
|---|---|---|---|---|---|---|---|
| A | 58005 | 46255 | 0 | 0 | 0.00% | 0.00% | 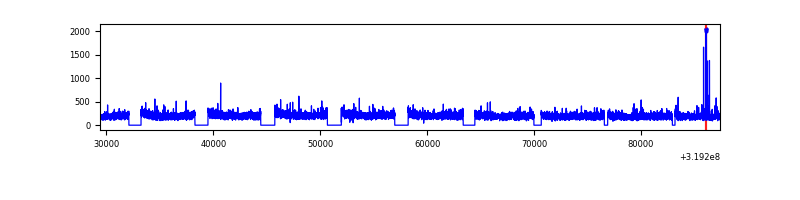 |
| B | 58005 | 46209 | 0 | 0 | 0.00% | 0.00% |  |
| C | 58005 | 46252 | 0 | 0 | 0.00% | 0.00% |  |
| D | 58005 | 46206 | 0 | 0 | 0.00% | 0.00% |  |
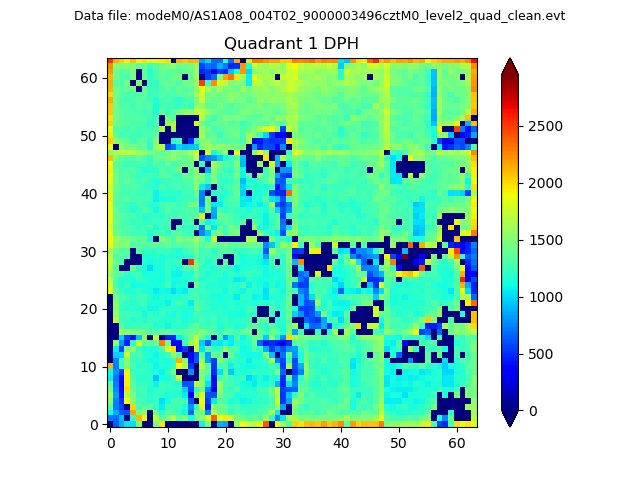
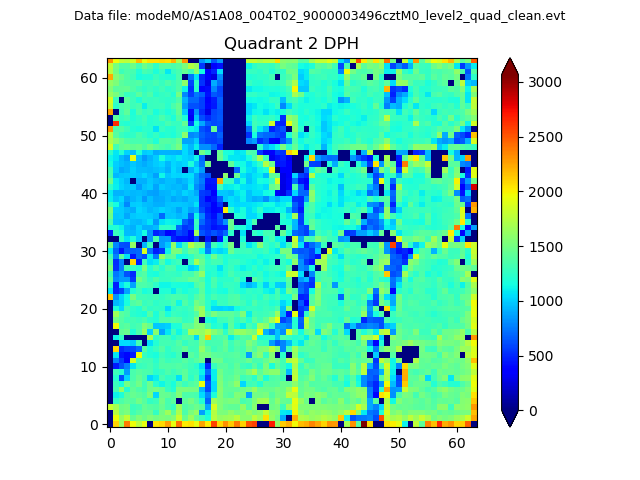
Top three noisy pixels from each quadrant. If the there are fewer than three noisy pixels in the level2.evt file, extra rows are filled as -1
| Pixel properties | Quadrant properties | ||||||
|---|---|---|---|---|---|---|---|
| Quadrant | DetID | PixID | Counts | Sigma | Mean | Median | Sigma |
| A | 0 | 29 | 2823 | 11.62 | 741 | 699 | 182.8 |
| A | 7 | 110 | 2310 | 8.81 | 741 | 699 | 182.8 |
| A | 0 | 30 | 2157 | 7.97 | 741 | 699 | 182.8 |
| B | 2 | 9 | 2169 | 10.66 | 716 | 685 | 139.3 |
| B | 2 | 8 | 1810 | 8.08 | 716 | 685 | 139.3 |
| B | 5 | 255 | 1795 | 7.97 | 716 | 685 | 139.3 |
| C | 1 | 81 | 2248 | 8.26 | 741 | 700 | 187.5 |
| C | 1 | 80 | 2178 | 7.88 | 741 | 700 | 187.5 |
| C | 12 | 241 | 1894 | 6.37 | 741 | 700 | 187.5 |
| D | 4 | 246 | 1796 | 6.54 | 679 | 622 | 179.5 |
| D | 3 | 14 | 1795 | 6.53 | 679 | 622 | 179.5 |
| D | 10 | 189 | 1714 | 6.08 | 679 | 622 | 179.5 |
Histogram calculated using DETX and DETY for each event in the final _common_clean file
| Quadrant A |  |
 |
Quadrant B |
|---|---|---|---|
| Quadrant D |  |
 |
Quadrant C |
| Plot type | Count rate plots | Images |
|---|---|---|
| Comparison with Poisson distribution Blue bars denote a histogram of data divided into 1 sec bins. Red curve is a Poisson curve with rate = median count rate of data. |
 |
 |
| Quadrant-wise count rates Data is divided into 100 sec bins |
 |
|
| Module-wise count rates for Quadrant A Data is divided into 100 sec bins |
 |
 |
| Module-wise count rates for Quadrant B Data is divided into 100 sec bins |
 |
 |
| Module-wise count rates for Quadrant C Data is divided into 100 sec bins |
 |
 |
| Module-wise count rates for Quadrant D Data is divided into 100 sec bins |
 |
 |
| Parameter | Plot |
|---|---|
| CZT HV Monitor |  |
| D_VDD |  |
| Temperature 1 |  |
| Veto HV Monitor |  |
| Veto LLD |  |
| Alpha Counter |  |
| _CPM_Rate |  |
| CZT Counter |  |
| +2.5 Volts monitor |  |
| +5 Volts monitor |  |
| _ROLL_ROT |  |
| _Roll_DEC |  |
| _Roll_RA |  |
| Veto Counter |  |