| Param | Original file | Final file |
|---|---|---|
| Filename | modeM0/AS1A08_004T02_9000003496_23664cztM0_level2.evt | modeM0/AS1A08_004T02_9000003496_23664cztM0_level2_quad_clean.evt |
| Size (bytes) | 469,169,280 | 104,895,360 |
| Size | 447.4 MB | 100.0 MB |
| Events in quadrant A | 3,011,765 | 698,054 |
| Events in quadrant B | 3,518,431 | 716,101 |
| Events in quadrant C | 3,074,975 | 684,045 |
| Events in quadrant D | 4,180,106 | 643,165 |
| Mode M9 | |||
|---|---|---|---|
| Quadrant | BADHDUFLAG | Total packets | Discarded packets |
| A | 0 | 20 | 0 |
| B | 0 | 21 | 0 |
| C | 0 | 21 | 0 |
| D | 0 | 21 | 0 |
| Mode M0 | |||
|---|---|---|---|
| Quadrant | BADHDUFLAG | Total packets | Discarded packets |
| A | 0 | 12986 | 2 |
| B | 0 | 14507 | 2 |
| C | 0 | 13007 | 3 |
| D | 0 | 16669 | 2 |
| Mode SS | |||
|---|---|---|---|
| Quadrant | BADHDUFLAG | Total packets | Discarded packets |
| A | 0 | 126 | 0 |
| B | 0 | 126 | 0 |
| C | 0 | 126 | 0 |
| D | 0 | 126 | 0 |
| Quadrant | Total seconds | Saturated seconds | Saturation percentage |
|---|---|---|---|
| A | 6242 | 18 | 0.288369% |
| B | 6242 | 53 | 0.849087% |
| C | 6241 | 52 | 0.833200% |
| D | 6241 | 158 | 2.531646% |
Noise dominated data is calculated using 1-second bins in cleaned event files. If a bin has >2000 counts, and if more than 50% of those come from <1% of pixels, then it is considered to be noise-dominated and hence unusable.
| Quadrant | # 1 sec bins | Bins with >0 counts | Bins with >2000 counts | High rate bins dominated by noise | Noise dominated (total time) | Noise dominated (detector-on time) | Marked lightcurve |
|---|---|---|---|---|---|---|---|
| A | 7472 | 6243 | 0 | 0 | 0.00% | 0.00% | 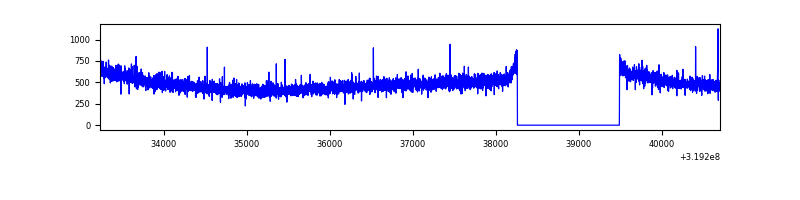 |
| B | 7472 | 6242 | 12 | 12 | 0.16% | 0.19% | 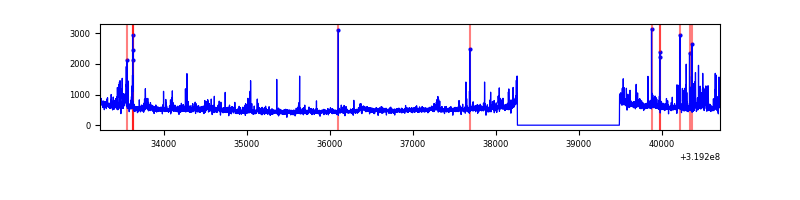 |
| C | 7471 | 6242 | 0 | 0 | 0.00% | 0.00% | 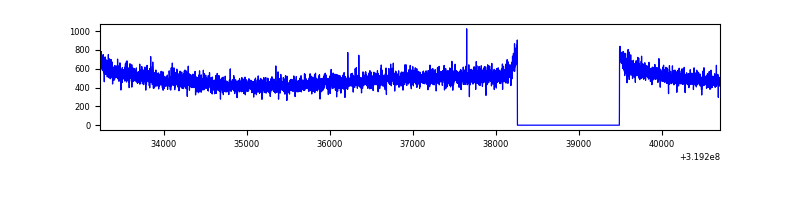 |
| D | 7471 | 6242 | 146 | 146 | 1.95% | 2.34% | 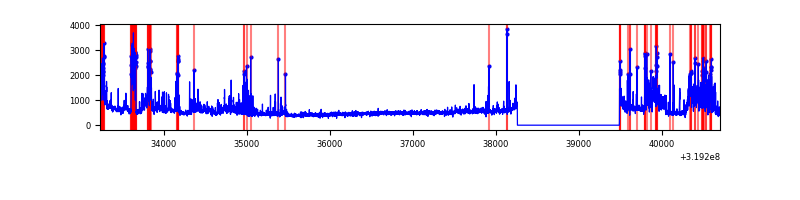 |
Top three noisy pixels from each quadrant. If the there are fewer than three noisy pixels in the level2.evt file, extra rows are filled as -1
| Pixel properties | Quadrant properties | ||||||
|---|---|---|---|---|---|---|---|
| Quadrant | DetID | PixID | Counts | Sigma | Mean | Median | Sigma |
| A | 13 | 254 | 11278 | 67.78 | 780 | 766 | 155.1 |
| A | 0 | 226 | 6718 | 38.38 | 780 | 766 | 155.1 |
| A | 3 | 137 | 6664 | 38.03 | 780 | 766 | 155.1 |
| B | 3 | 64 | 232975 | 1581.36 | 787 | 768 | 146.8 |
| B | 0 | 230 | 68387 | 460.49 | 787 | 768 | 146.8 |
| B | 0 | 229 | 47011 | 314.92 | 787 | 768 | 146.8 |
| C | 14 | 238 | 123383 | 704.95 | 752 | 758 | 173.9 |
| C | 7 | 247 | 21260 | 117.86 | 752 | 758 | 173.9 |
| C | 13 | 61 | 5244 | 25.79 | 752 | 758 | 173.9 |
| D | 1 | 52 | 582893 | 3239.77 | 742 | 721 | 179.7 |
| D | 9 | 85 | 469684 | 2609.76 | 742 | 721 | 179.7 |
| D | 12 | 233 | 110205 | 609.28 | 742 | 721 | 179.7 |
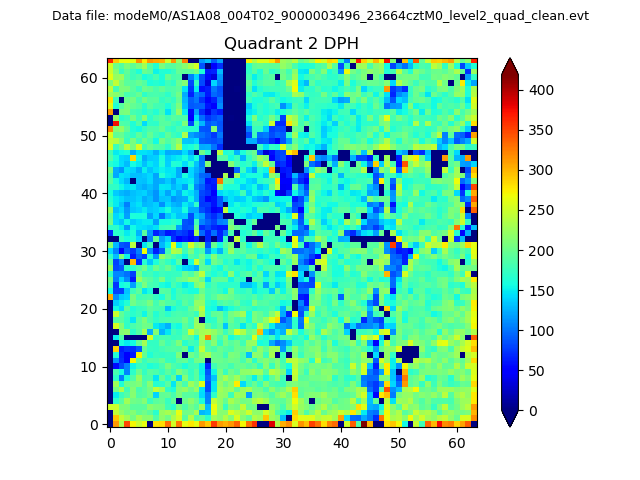
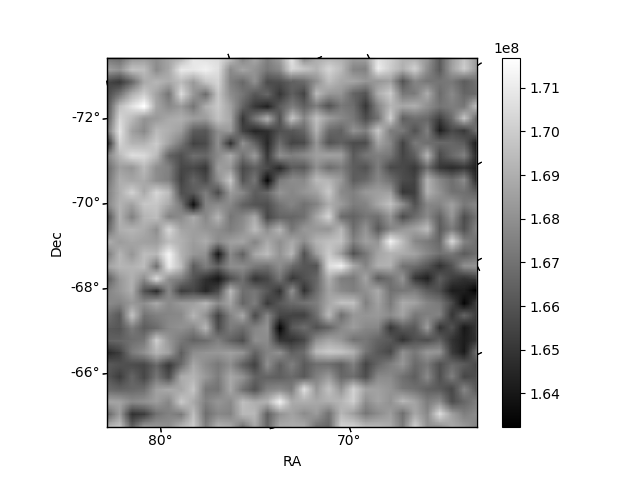
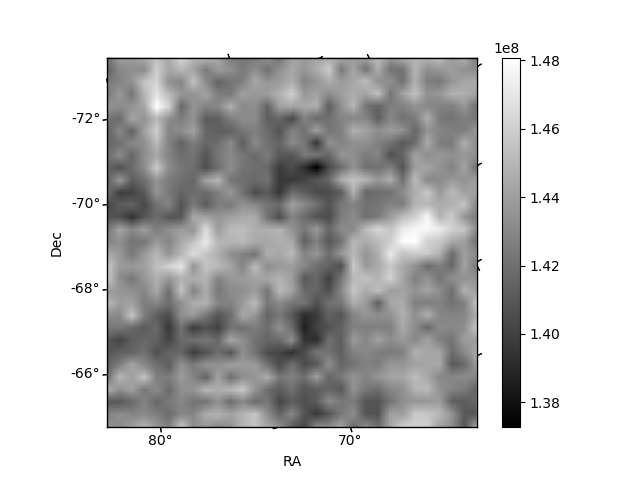
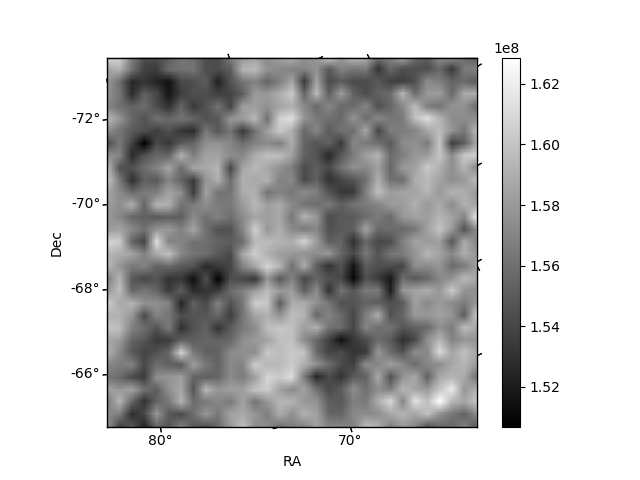
Histogram calculated using DETX and DETY for each event in the final _common_clean file
| Quadrant A |  |
 |
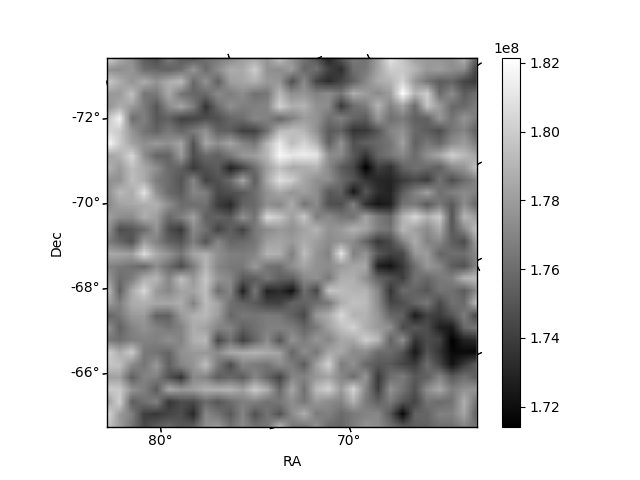
Quadrant B |
|---|---|---|---|
| Quadrant D |  |
 |
Quadrant C |
| Plot type | Count rate plots | Images |
|---|---|---|
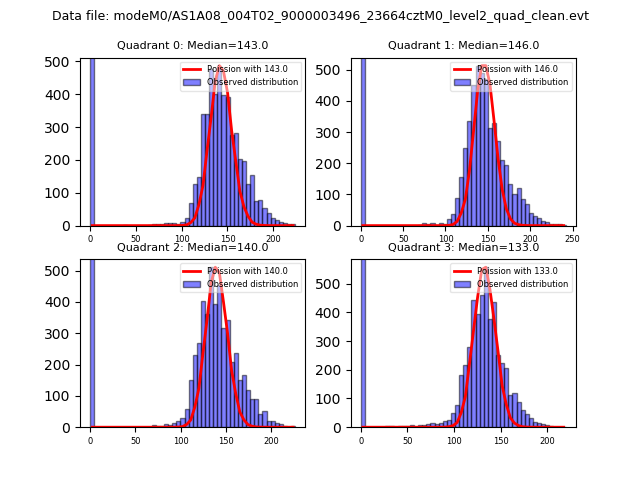
| Comparison with Poisson distribution Blue bars denote a histogram of data divided into 1 sec bins. Red curve is a Poisson curve with rate = median count rate of data. |
 |
 |
| Quadrant-wise count rates Data is divided into 100 sec bins |
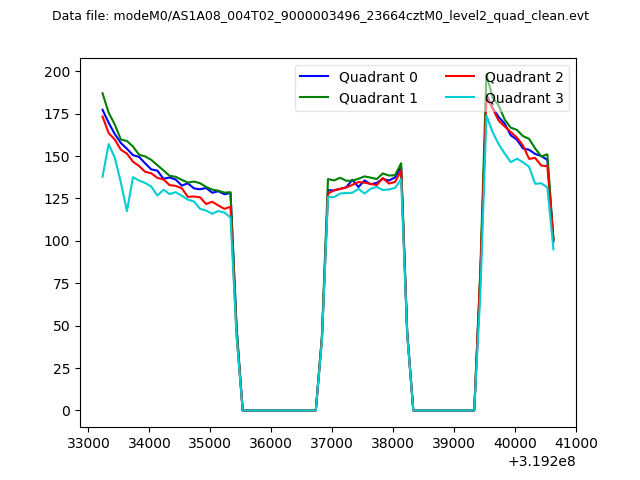 |
|
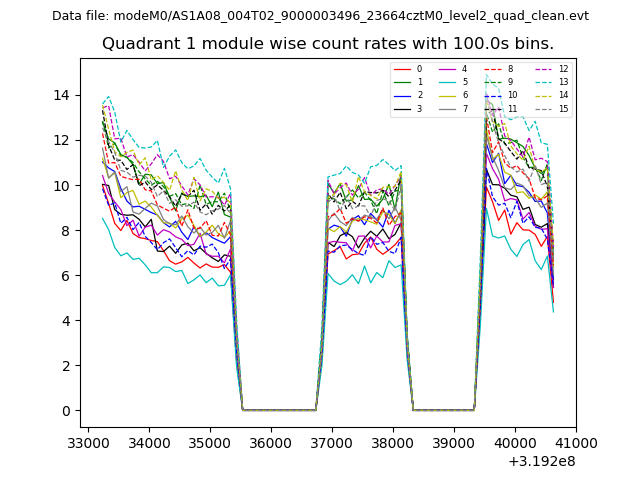
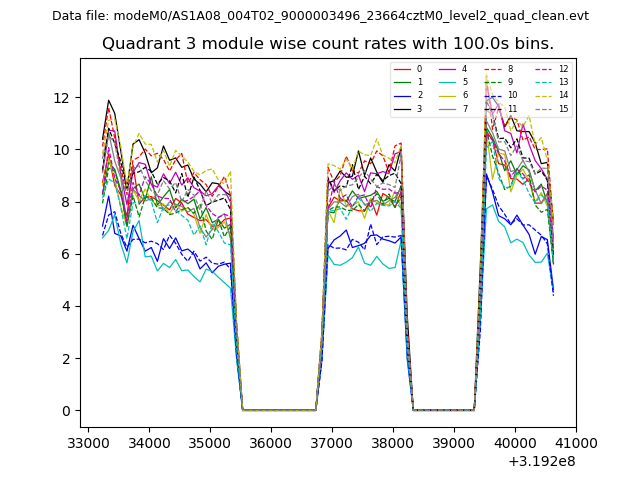
| Module-wise count rates for Quadrant A Data is divided into 100 sec bins |
 |
 |
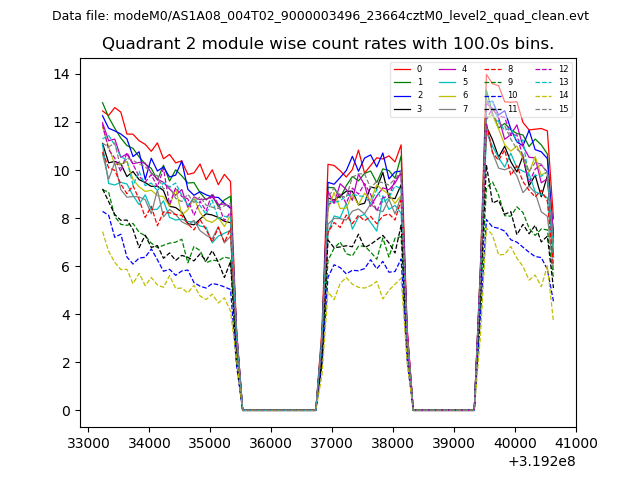
| Module-wise count rates for Quadrant B Data is divided into 100 sec bins |
 |
 |
| Module-wise count rates for Quadrant C Data is divided into 100 sec bins |
 |
 |
| Module-wise count rates for Quadrant D Data is divided into 100 sec bins |
 |
 |
| Parameter | Plot |
|---|---|
| CZT HV Monitor |  |
| D_VDD | 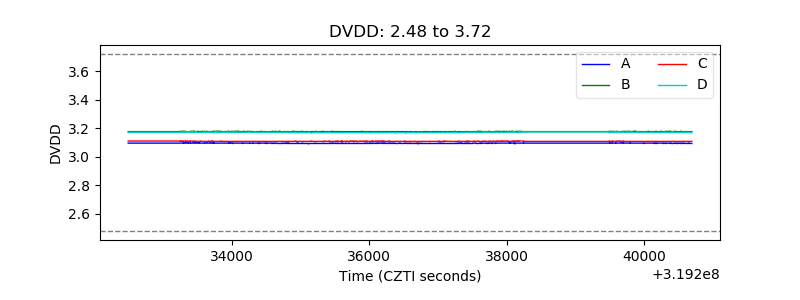 |
| Temperature 1 | 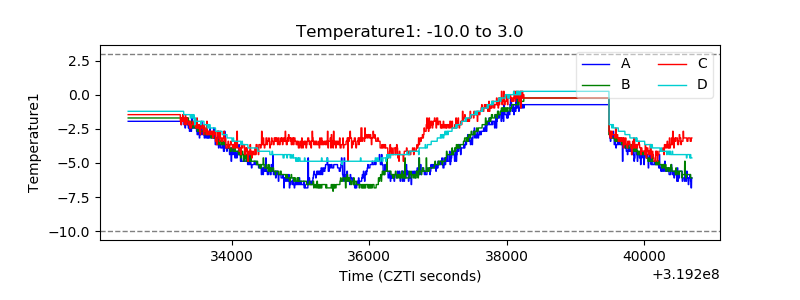 |
| Veto HV Monitor | 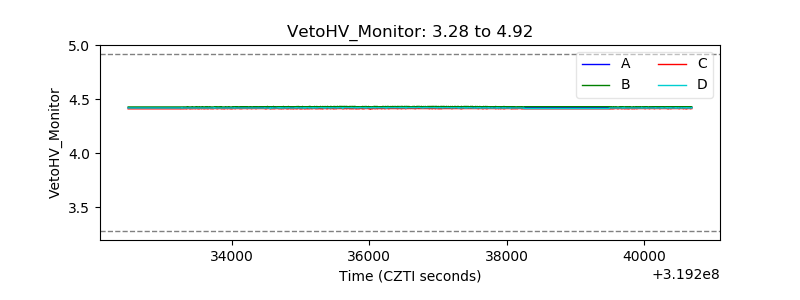 |
| Veto LLD | 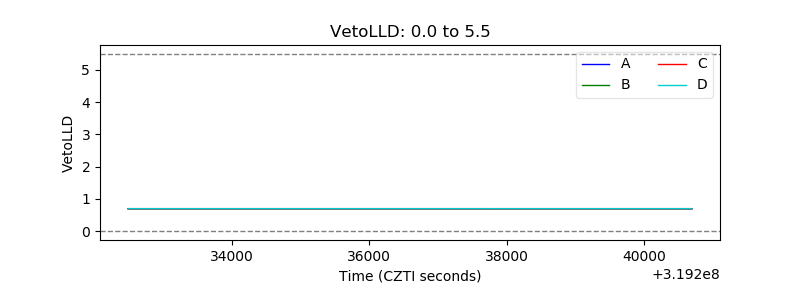 |
| Alpha Counter | 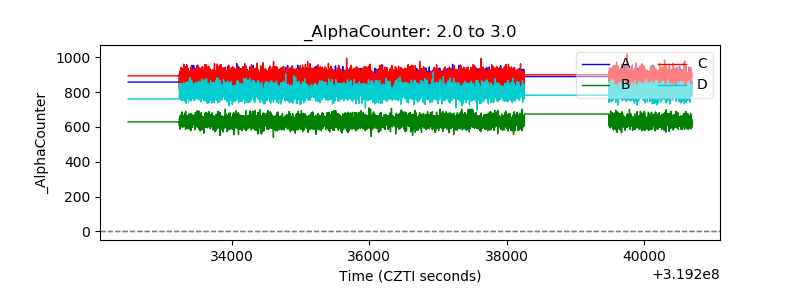 |
| _CPM_Rate | 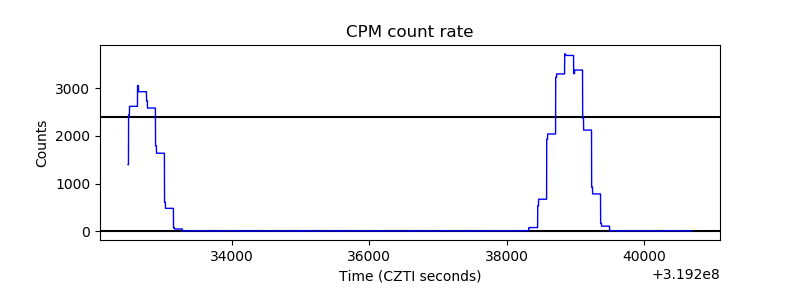 |
| CZT Counter | 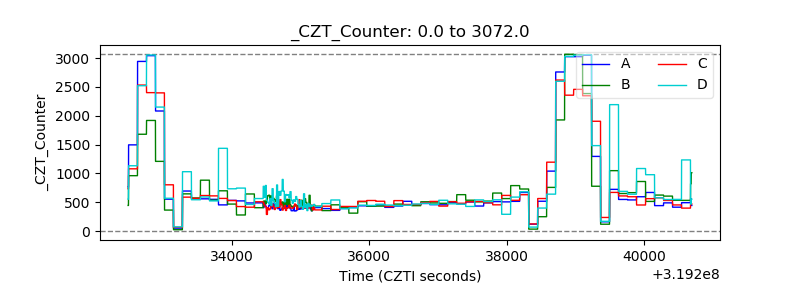 |
| +2.5 Volts monitor |  |
| +5 Volts monitor | 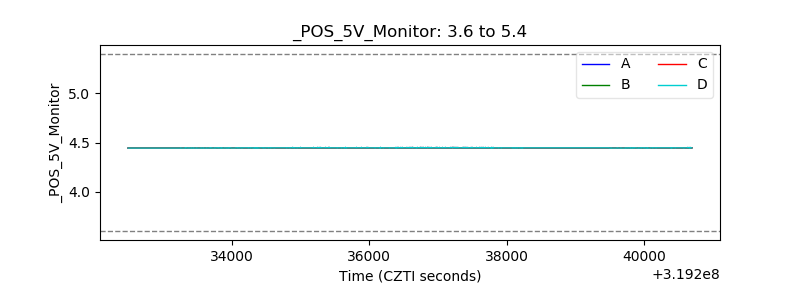 |
| _ROLL_ROT | 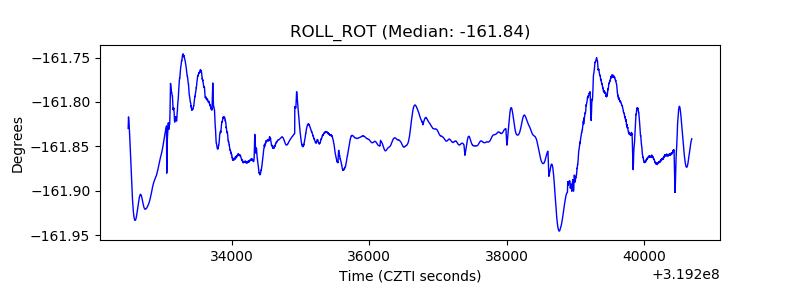 |
| _Roll_DEC | 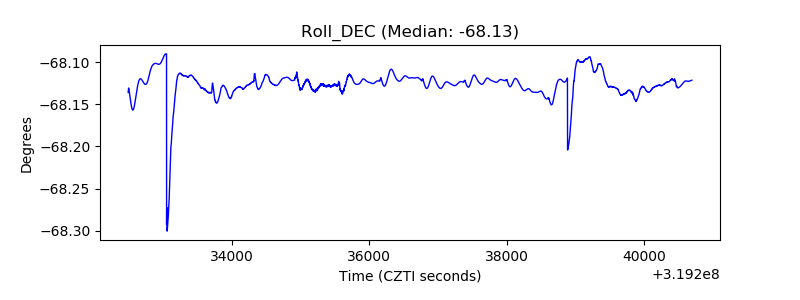 |
| _Roll_RA | 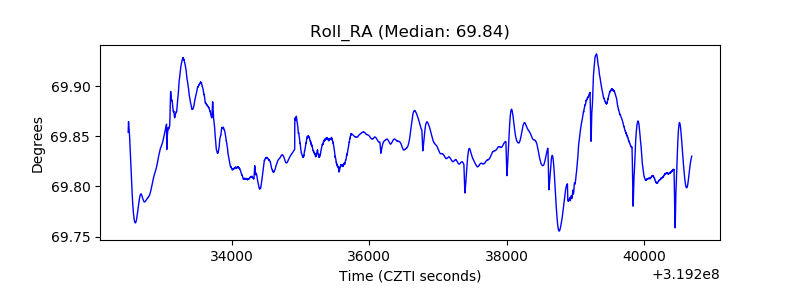 |
| Veto Counter | 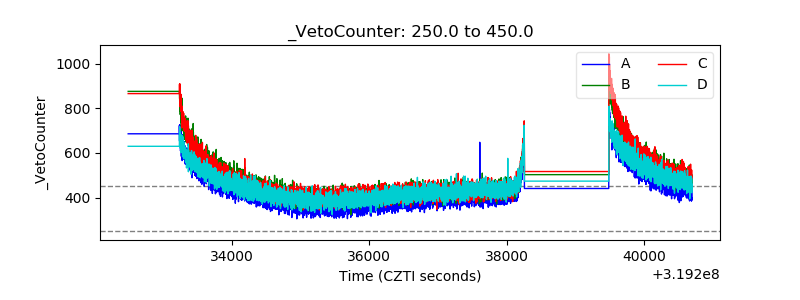 |