| Param | Original file | Final file |
|---|---|---|
| Filename | modeM0/AS1A08_004T02_9000003496_23674cztM0_level2.evt | modeM0/AS1A08_004T02_9000003496_23674cztM0_level2_quad_clean.evt |
| Size (bytes) | 224,127,360 | 57,124,800 |
| Size | 213.7 MB | 54.5 MB |
| Events in quadrant A | 1,429,490 | 384,324 |
| Events in quadrant B | 1,784,173 | 381,800 |
| Events in quadrant C | 1,375,679 | 375,303 |
| Events in quadrant D | 1,980,944 | 362,867 |
| Mode M0 | |||
|---|---|---|---|
| Quadrant | BADHDUFLAG | Total packets | Discarded packets |
| A | 0 | 6842 | 306 |
| B | 0 | 7734 | 379 |
| C | 0 | 6686 | 311 |
| D | 0 | 8292 | 315 |
| Mode SS | |||
|---|---|---|---|
| Quadrant | BADHDUFLAG | Total packets | Discarded packets |
| A | 0 | 68 | 4 |
| B | 0 | 67 | 5 |
| C | 0 | 68 | 2 |
| D | 0 | 67 | 5 |
| Quadrant | Total seconds | Saturated seconds | Saturation percentage |
|---|---|---|---|
| A | 3175 | 10 | 0.314961% |
| B | 3171 | 62 | 1.955219% |
| C | 3172 | 6 | 0.189155% |
| D | 3170 | 81 | 2.555205% |
Noise dominated data is calculated using 1-second bins in cleaned event files. If a bin has >2000 counts, and if more than 50% of those come from <1% of pixels, then it is considered to be noise-dominated and hence unusable.
| Quadrant | # 1 sec bins | Bins with >0 counts | Bins with >2000 counts | High rate bins dominated by noise | Noise dominated (total time) | Noise dominated (detector-on time) | Marked lightcurve |
|---|---|---|---|---|---|---|---|
| A | 3236 | 3218 | 5 | 5 | 0.15% | 0.16% | 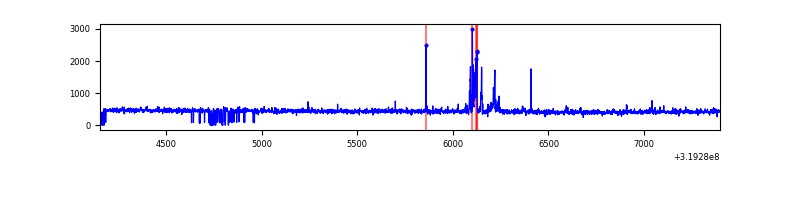 |
| B | 3225 | 3206 | 42 | 42 | 1.30% | 1.31% | 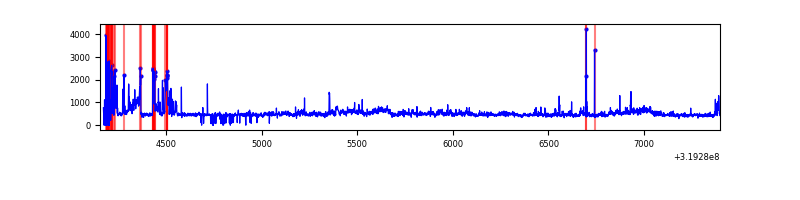 |
| C | 3229 | 3214 | 0 | 0 | 0.00% | 0.00% | 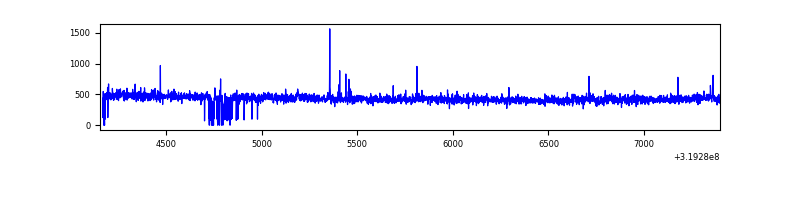 |
| D | 3243 | 3207 | 72 | 72 | 2.22% | 2.25% | 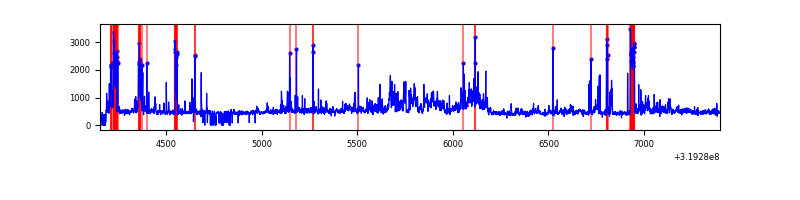 |
Top three noisy pixels from each quadrant. If the there are fewer than three noisy pixels in the level2.evt file, extra rows are filled as -1
| Pixel properties | Quadrant properties | ||||||
|---|---|---|---|---|---|---|---|
| Quadrant | DetID | PixID | Counts | Sigma | Mean | Median | Sigma |
| A | 12 | 96 | 68615 | 938.83 | 352 | 344 | 72.7 |
| A | 13 | 254 | 6473 | 84.28 | 352 | 344 | 72.7 |
| A | 0 | 226 | 3116 | 38.12 | 352 | 344 | 72.7 |
| B | 3 | 64 | 205668 | 3053.33 | 346 | 339 | 67.2 |
| B | 0 | 189 | 116718 | 1730.6 | 346 | 339 | 67.2 |
| B | 15 | 32 | 28870 | 424.27 | 346 | 339 | 67.2 |
| C | 14 | 238 | 52585 | 661.76 | 331 | 332 | 79.0 |
| C | 8 | 208 | 8096 | 98.32 | 331 | 332 | 79.0 |
| C | 0 | 207 | 5410 | 64.31 | 331 | 332 | 79.0 |
| D | 7 | 238 | 184729 | 2232.97 | 333 | 322 | 82.6 |
| D | 12 | 235 | 158600 | 1916.57 | 333 | 322 | 82.6 |
| D | 12 | 233 | 142061 | 1716.31 | 333 | 322 | 82.6 |
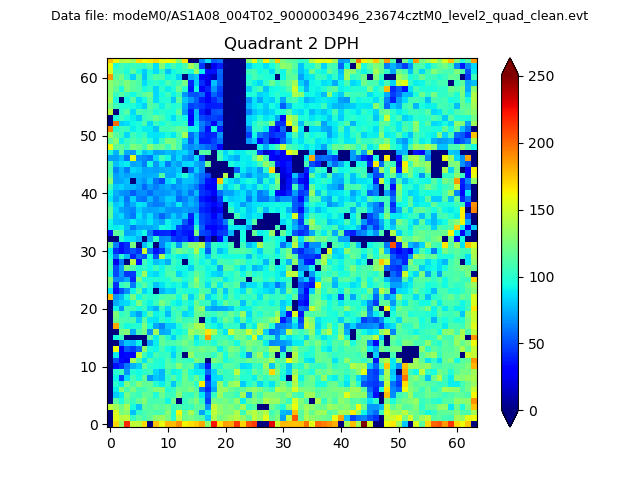
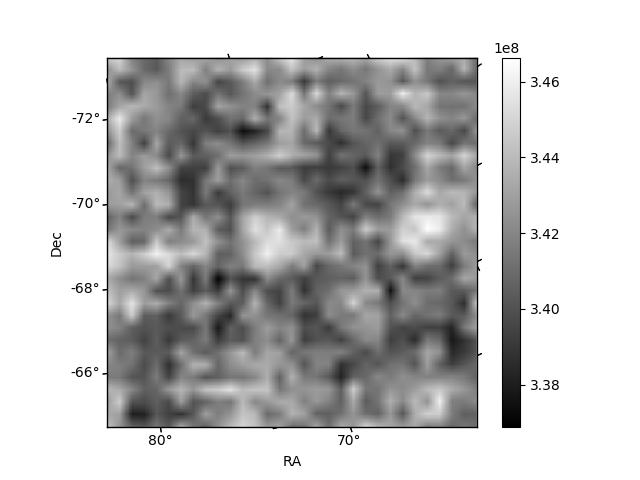
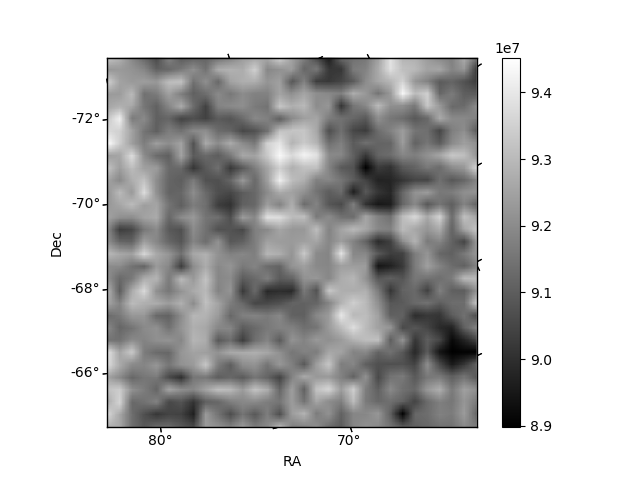
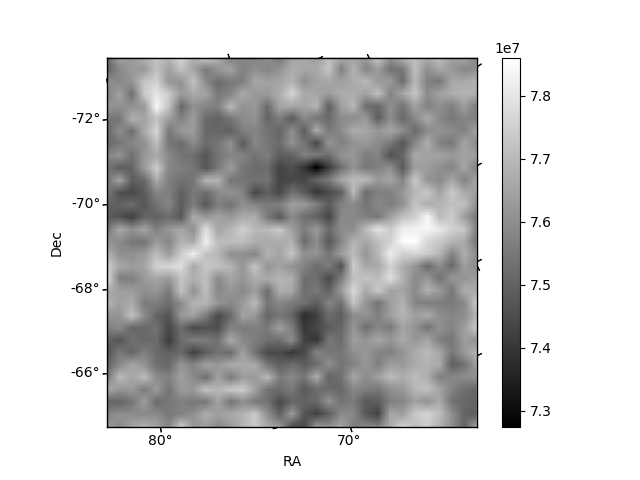
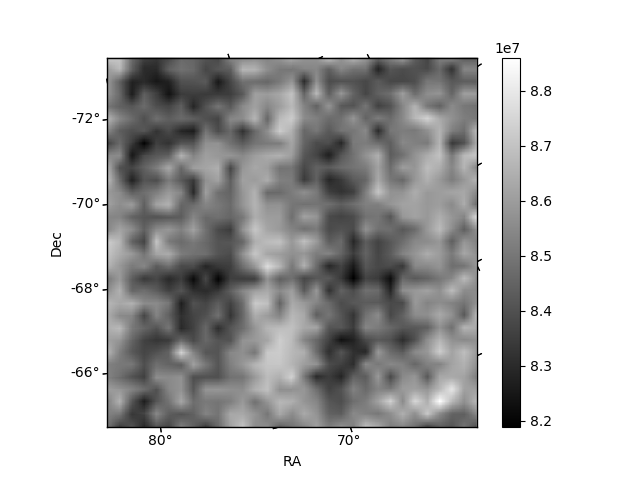
Histogram calculated using DETX and DETY for each event in the final _common_clean file
| Quadrant A | 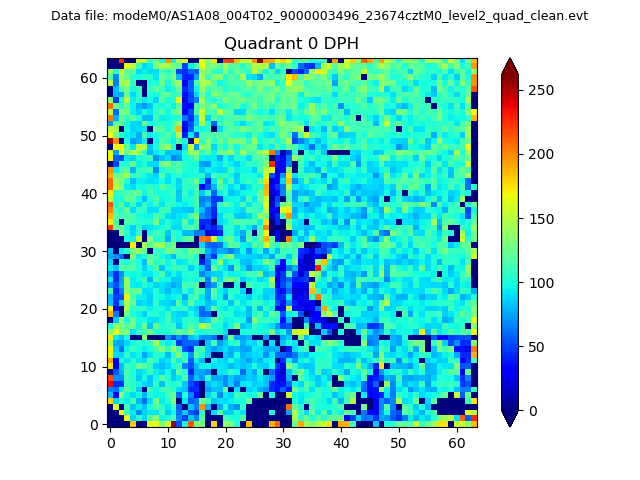 |
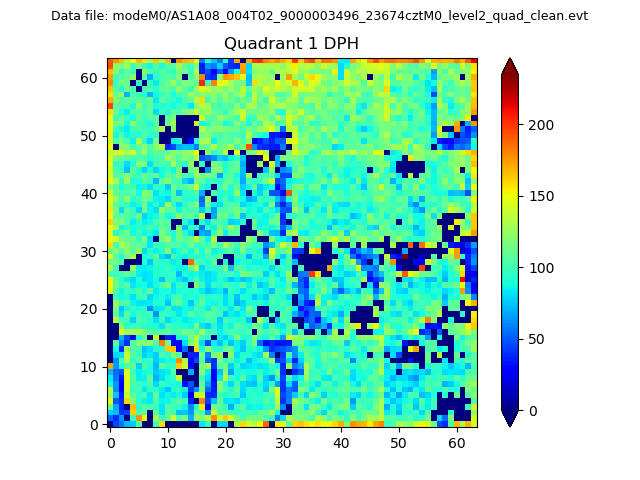 |
Quadrant B |
|---|---|---|---|
| Quadrant D | 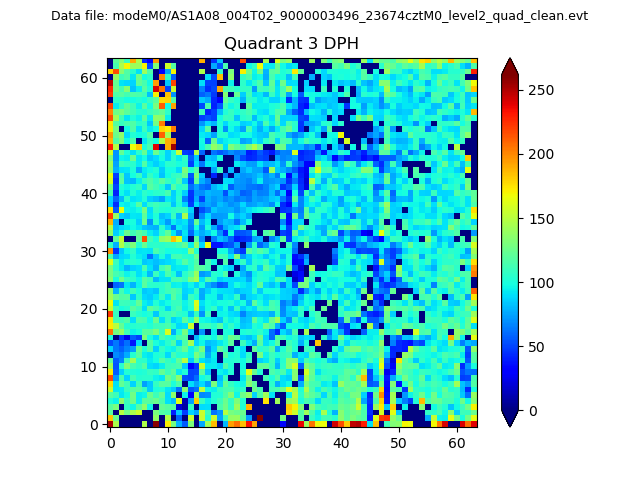 |
 |
Quadrant C |
| Plot type | Count rate plots | Images |
|---|---|---|
| Comparison with Poisson distribution Blue bars denote a histogram of data divided into 1 sec bins. Red curve is a Poisson curve with rate = median count rate of data. |
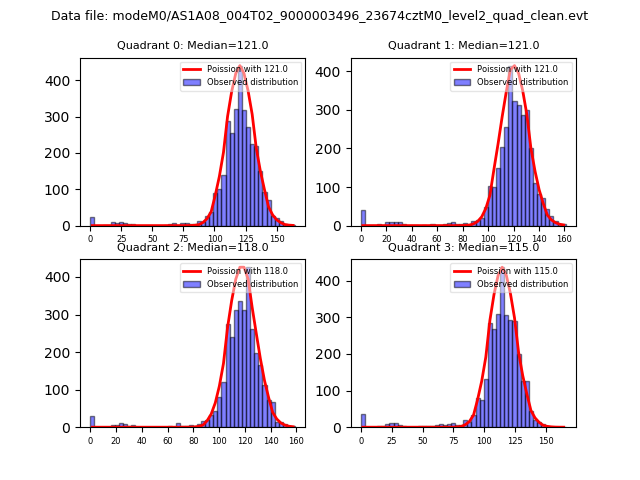 |
 |
| Quadrant-wise count rates Data is divided into 100 sec bins |
 |
|
| Module-wise count rates for Quadrant A Data is divided into 100 sec bins |
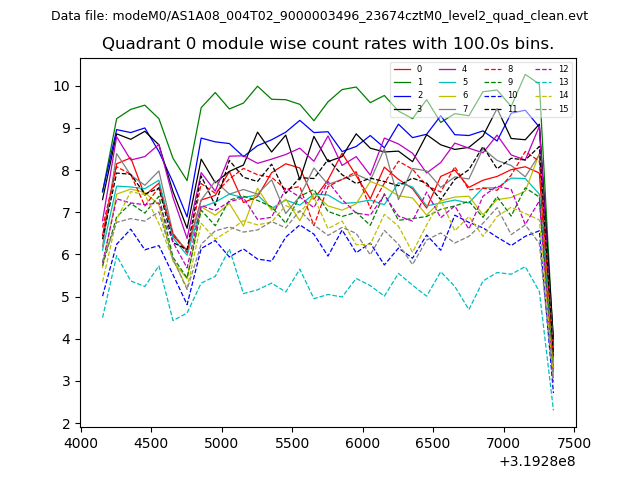 |
 |
| Module-wise count rates for Quadrant B Data is divided into 100 sec bins |
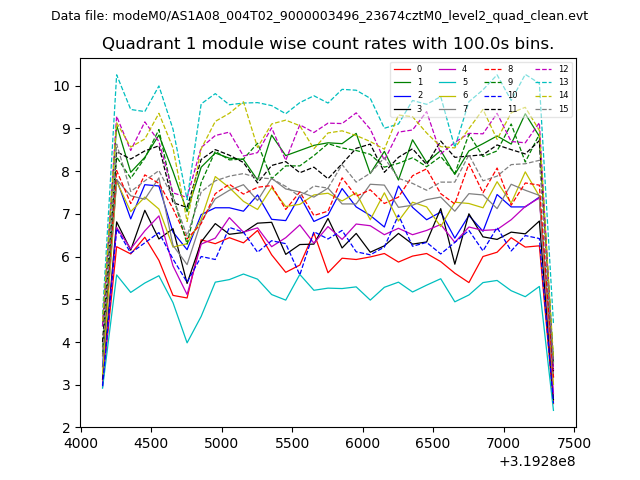 |
 |
| Module-wise count rates for Quadrant C Data is divided into 100 sec bins |
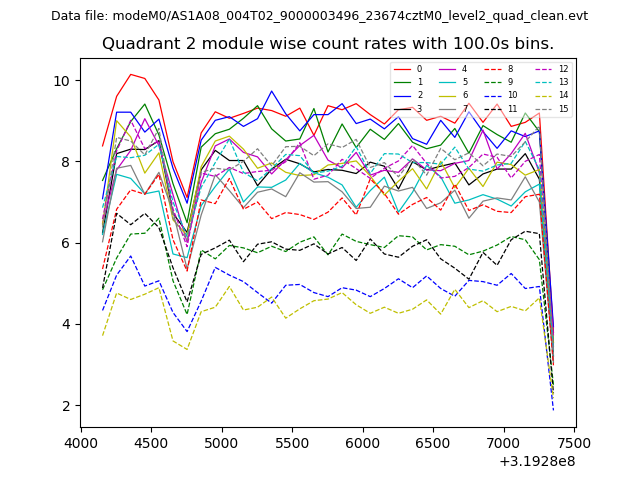 |
 |
| Module-wise count rates for Quadrant D Data is divided into 100 sec bins |
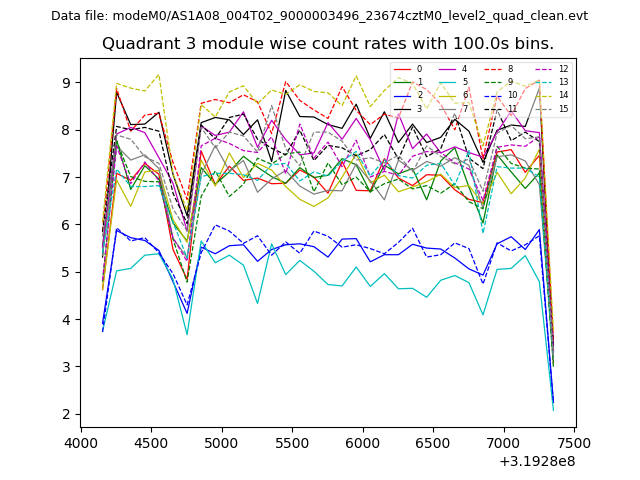 |
 |
| Parameter | Plot |
|---|---|
| CZT HV Monitor | 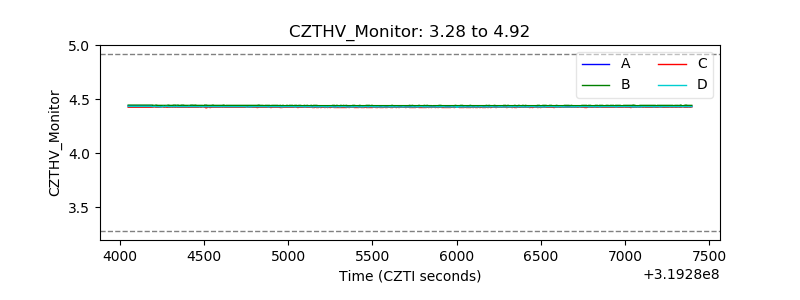 |
| D_VDD | 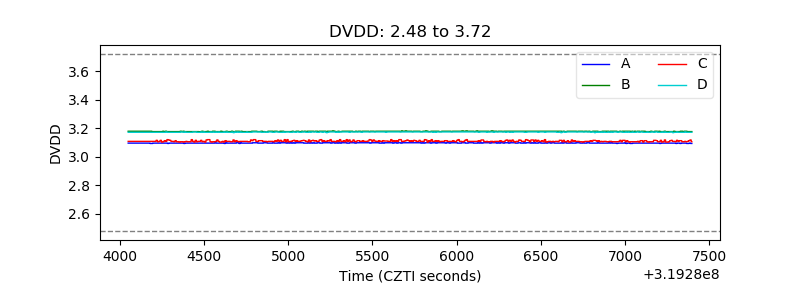 |
| Temperature 1 | 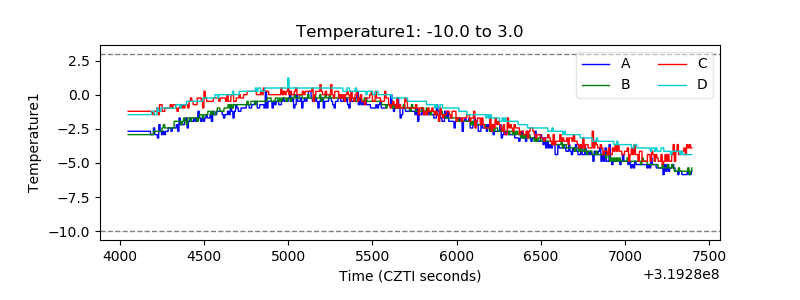 |
| Veto HV Monitor | 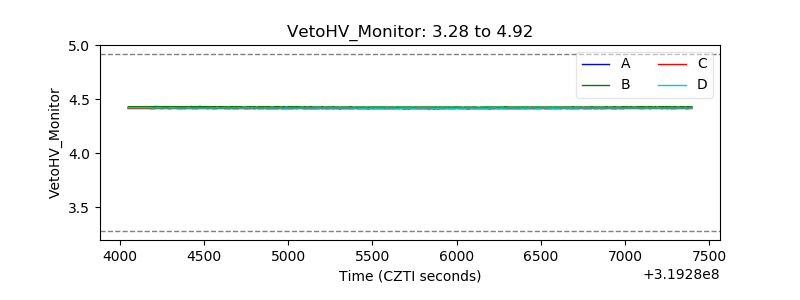 |
| Veto LLD | 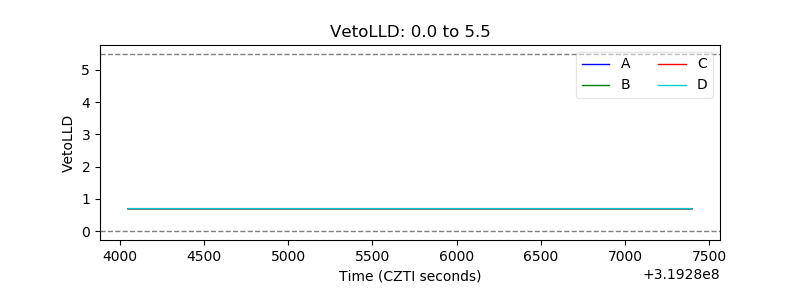 |
| Alpha Counter | 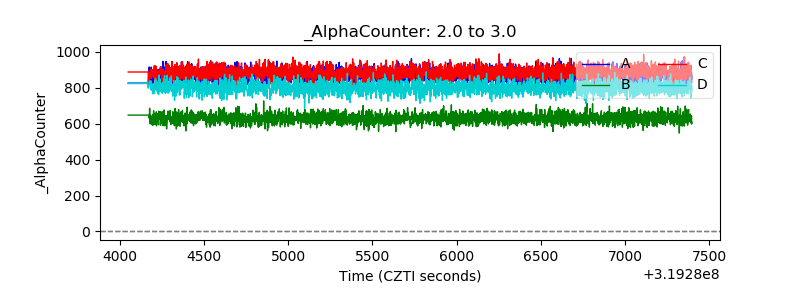 |
| _CPM_Rate |  |
| CZT Counter | 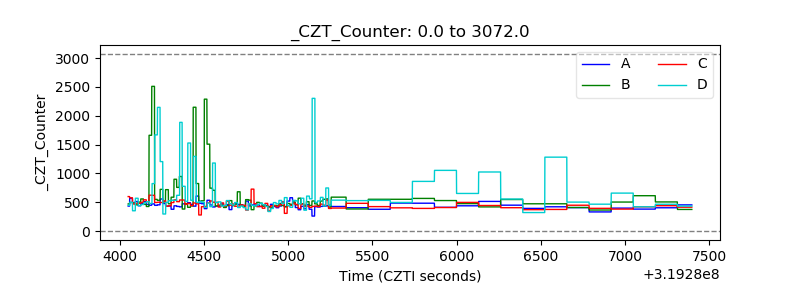 |
| +2.5 Volts monitor |  |
| +5 Volts monitor |  |
| _ROLL_ROT | 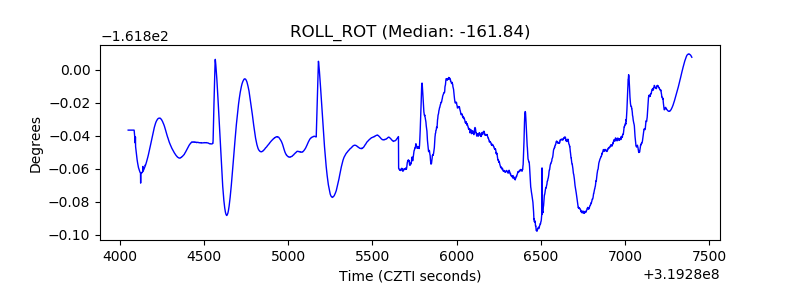 |
| _Roll_DEC | 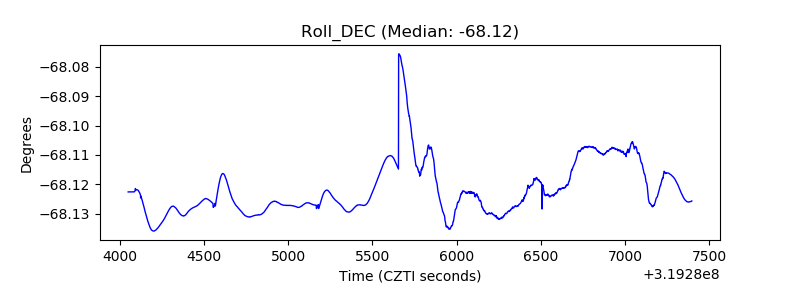 |
| _Roll_RA | 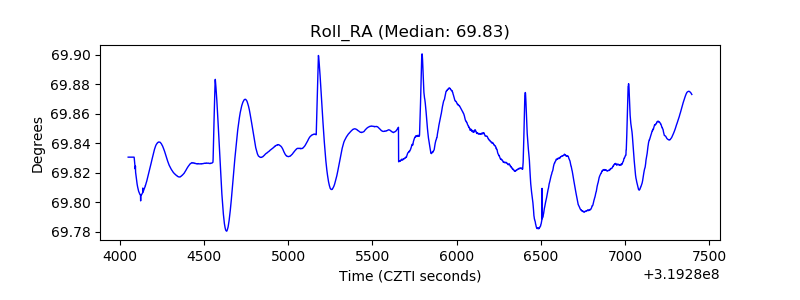 |
| Veto Counter | 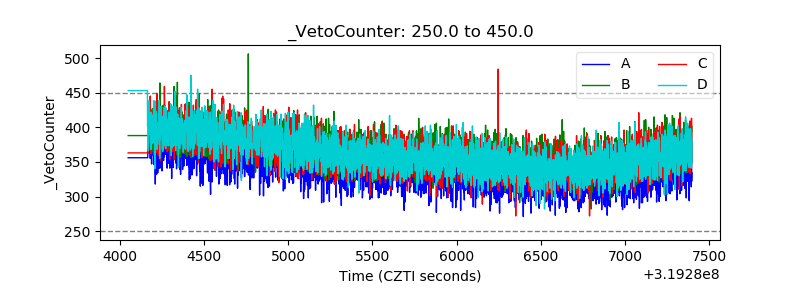 |