| Param | Original file | Final file |
|---|---|---|
| Filename | modeM0/AS1A08_004T02_9000003496_23675cztM0_level2.evt | modeM0/AS1A08_004T02_9000003496_23675cztM0_level2_quad_clean.evt |
| Size (bytes) | 2,023,067,520 | 397,592,640 |
| Size | 1.9 GB | 379.2 MB |
| Events in quadrant A | 12,510,702 | 2,608,837 |
| Events in quadrant B | 16,744,027 | 2,597,606 |
| Events in quadrant C | 12,846,255 | 2,568,148 |
| Events in quadrant D | 17,357,116 | 2,423,734 |
| Mode M9 | |||
|---|---|---|---|
| Quadrant | BADHDUFLAG | Total packets | Discarded packets |
| A | 0 | 25 | 0 |
| B | 0 | 26 | 0 |
| C | 0 | 26 | 0 |
| D | 0 | 26 | 0 |
| Mode M0 | |||
|---|---|---|---|
| Quadrant | BADHDUFLAG | Total packets | Discarded packets |
| A | 0 | 54990 | 5 |
| B | 0 | 66538 | 5 |
| C | 0 | 55472 | 5 |
| D | 0 | 69114 | 5 |
| Mode SS | |||
|---|---|---|---|
| Quadrant | BADHDUFLAG | Total packets | Discarded packets |
| A | 0 | 542 | 0 |
| B | 0 | 542 | 0 |
| C | 0 | 542 | 0 |
| D | 0 | 542 | 0 |
| Quadrant | Total seconds | Saturated seconds | Saturation percentage |
|---|---|---|---|
| A | 26827 | 428 | 1.595408% |
| B | 26827 | 1569 | 5.848585% |
| C | 26827 | 601 | 2.240280% |
| D | 26827 | 1418 | 5.285720% |
Noise dominated data is calculated using 1-second bins in cleaned event files. If a bin has >2000 counts, and if more than 50% of those come from <1% of pixels, then it is considered to be noise-dominated and hence unusable.
| Quadrant | # 1 sec bins | Bins with >0 counts | Bins with >2000 counts | High rate bins dominated by noise | Noise dominated (total time) | Noise dominated (detector-on time) | Marked lightcurve |
|---|---|---|---|---|---|---|---|
| A | 29177 | 26828 | 5 | 5 | 0.02% | 0.02% | 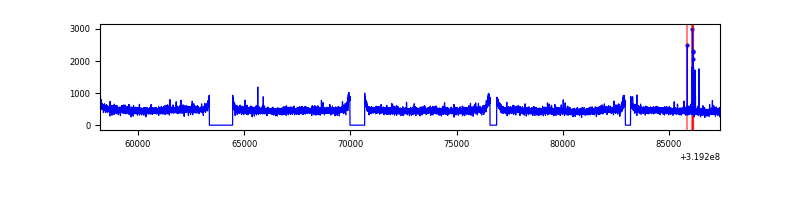 |
| B | 29177 | 26827 | 843 | 843 | 2.89% | 3.14% | 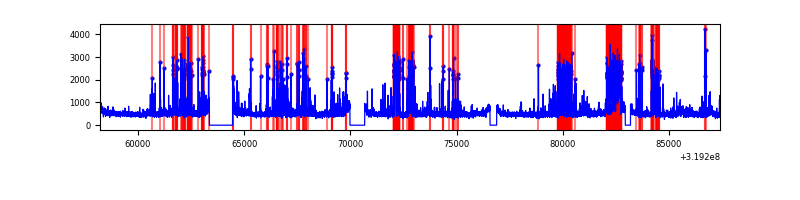 |
| C | 29177 | 26828 | 4 | 4 | 0.01% | 0.01% | 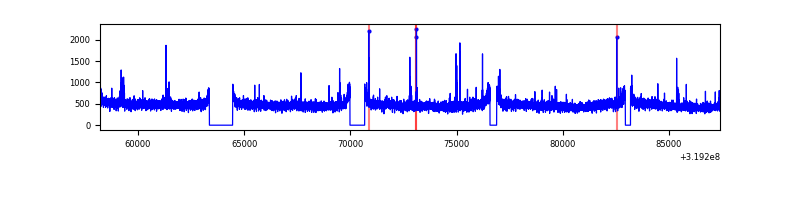 |
| D | 29177 | 26828 | 1080 | 1080 | 3.70% | 4.03% | 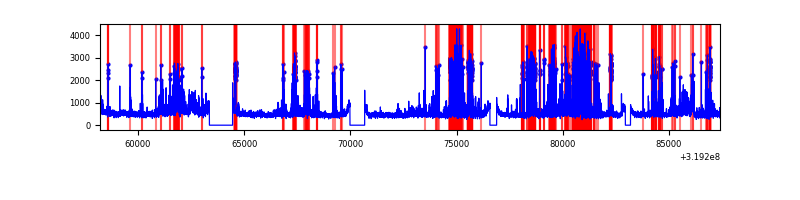 |
Top three noisy pixels from each quadrant. If the there are fewer than three noisy pixels in the level2.evt file, extra rows are filled as -1
| Pixel properties | Quadrant properties | ||||||
|---|---|---|---|---|---|---|---|
| Quadrant | DetID | PixID | Counts | Sigma | Mean | Median | Sigma |
| A | 12 | 96 | 72010 | 107.15 | 3224 | 3152 | 642.7 |
| A | 13 | 254 | 47797 | 69.47 | 3224 | 3152 | 642.7 |
| A | 3 | 137 | 27657 | 38.13 | 3224 | 3152 | 642.7 |
| B | 3 | 64 | 3519857 | 5928.95 | 3166 | 3087 | 593.2 |
| B | 0 | 189 | 388405 | 649.61 | 3166 | 3087 | 593.2 |
| B | 0 | 230 | 113319 | 185.84 | 3166 | 3087 | 593.2 |
| C | 14 | 238 | 495754 | 690.84 | 3103 | 3121 | 713.1 |
| C | 7 | 247 | 153195 | 210.45 | 3103 | 3121 | 713.1 |
| C | 10 | 9 | 41918 | 54.41 | 3103 | 3121 | 713.1 |
| D | 1 | 52 | 3506837 | 4725.32 | 3087 | 2994 | 741.5 |
| D | 12 | 233 | 867360 | 1165.69 | 3087 | 2994 | 741.5 |
| D | 12 | 235 | 380668 | 509.34 | 3087 | 2994 | 741.5 |
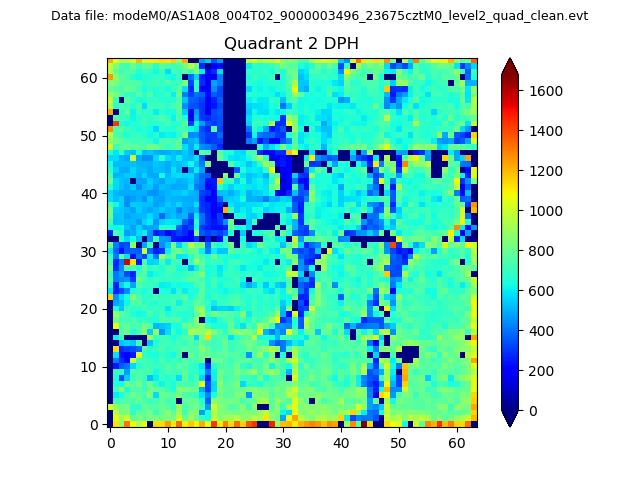
Histogram calculated using DETX and DETY for each event in the final _common_clean file
| Quadrant A | 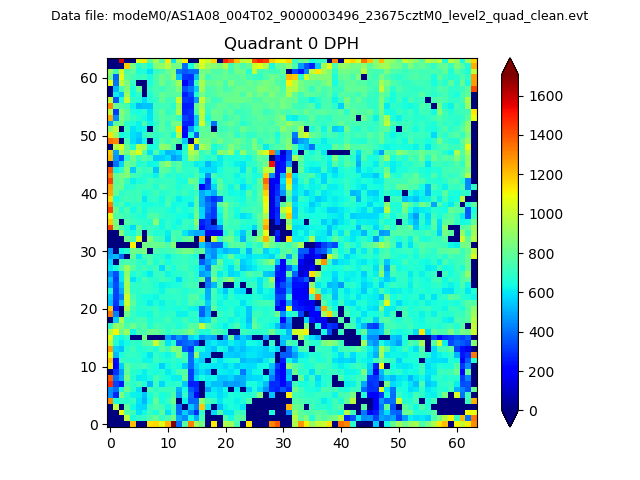 |
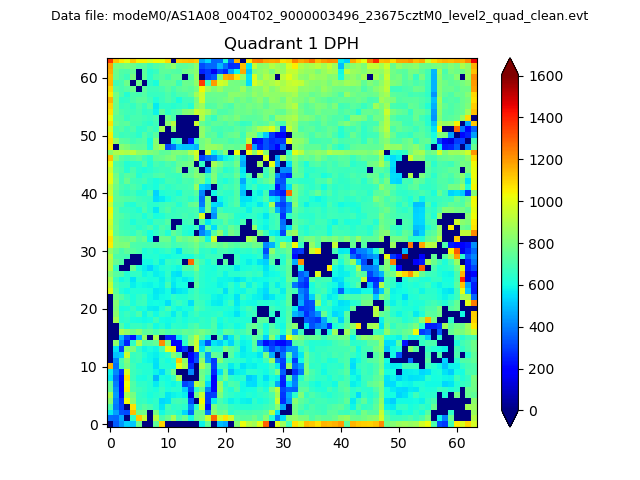 |
Quadrant B |
|---|---|---|---|
| Quadrant D | 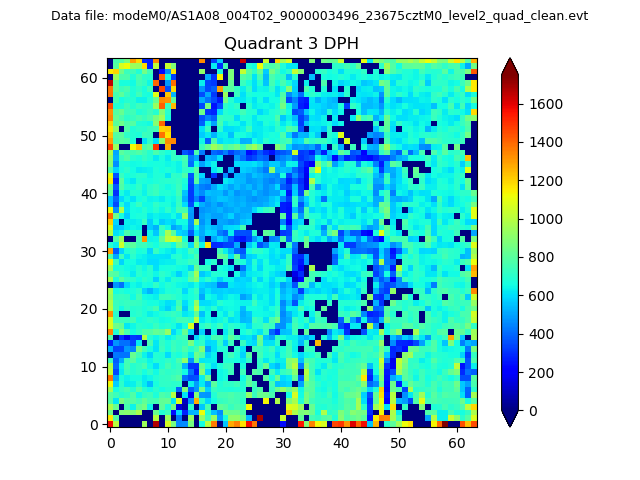 |
 |
Quadrant C |
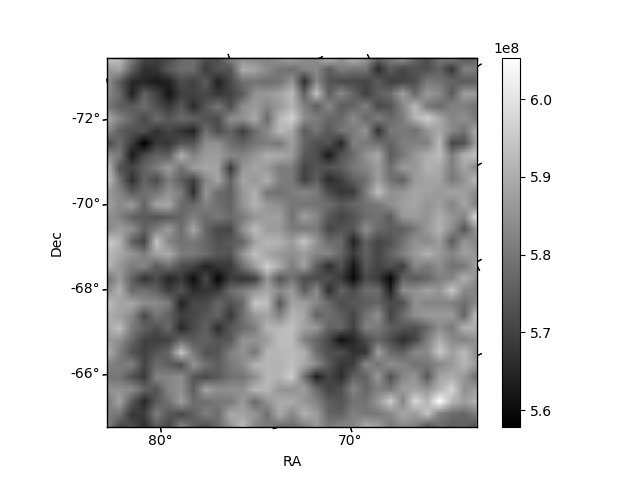
| Plot type | Count rate plots | Images |
|---|---|---|
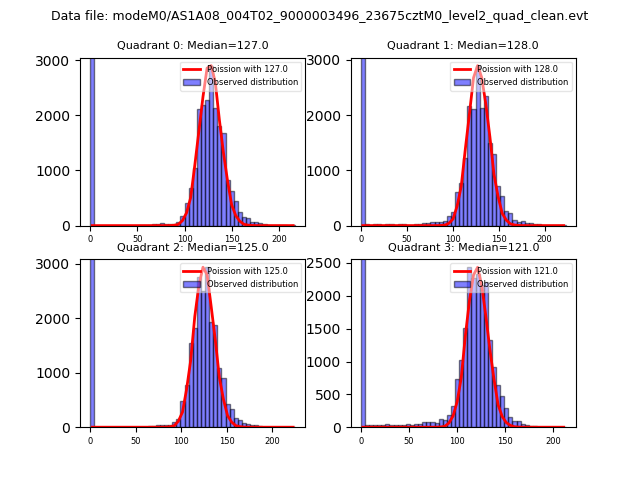
| Comparison with Poisson distribution Blue bars denote a histogram of data divided into 1 sec bins. Red curve is a Poisson curve with rate = median count rate of data. |
 |
 |
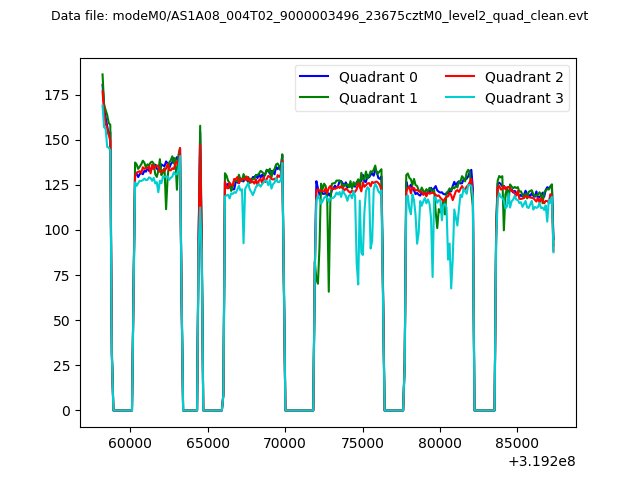
| Quadrant-wise count rates Data is divided into 100 sec bins |
 |
|
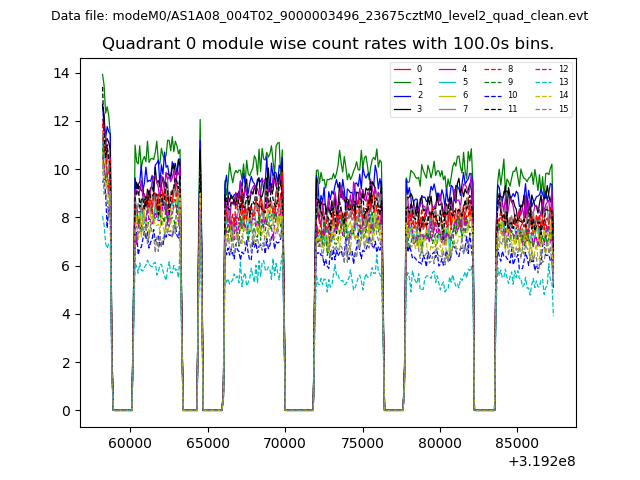
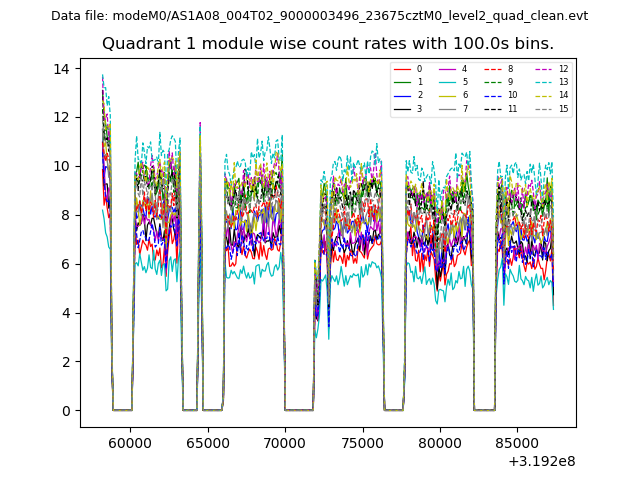
| Module-wise count rates for Quadrant A Data is divided into 100 sec bins |
 |
 |
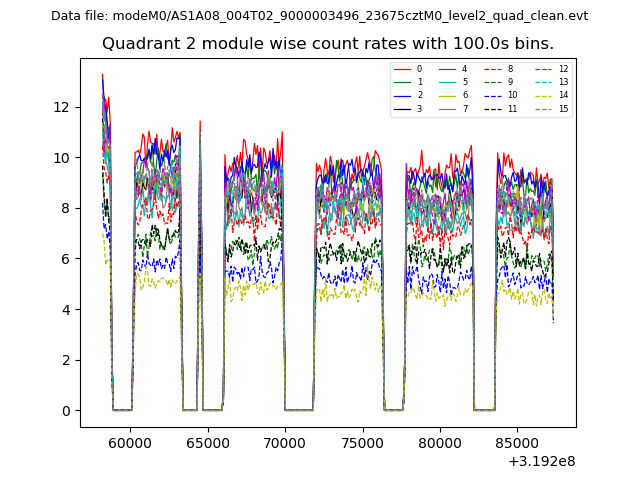
| Module-wise count rates for Quadrant B Data is divided into 100 sec bins |
 |
 |
| Module-wise count rates for Quadrant C Data is divided into 100 sec bins |
 |
 |
| Module-wise count rates for Quadrant D Data is divided into 100 sec bins |
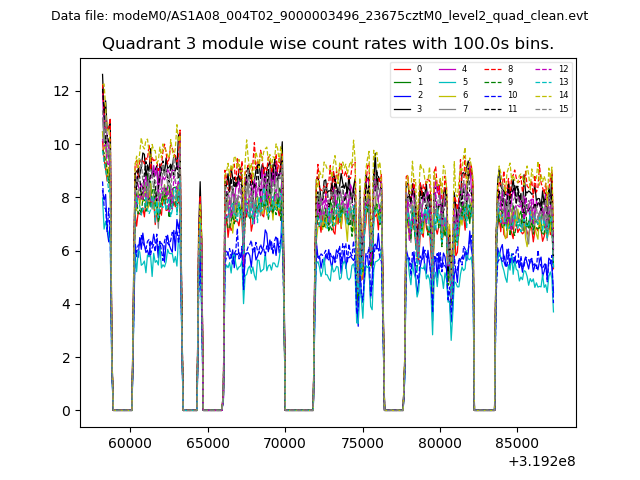 |
 |
| Parameter | Plot |
|---|---|
| CZT HV Monitor | 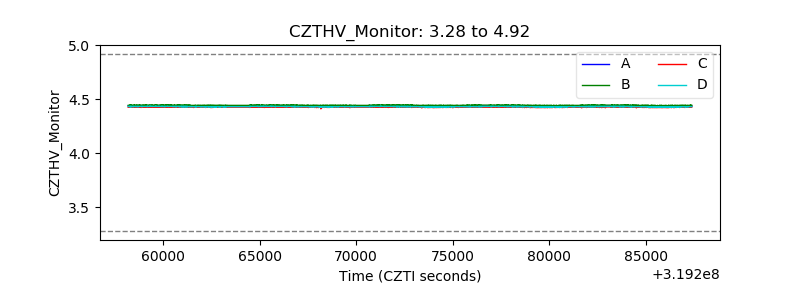 |
| D_VDD | 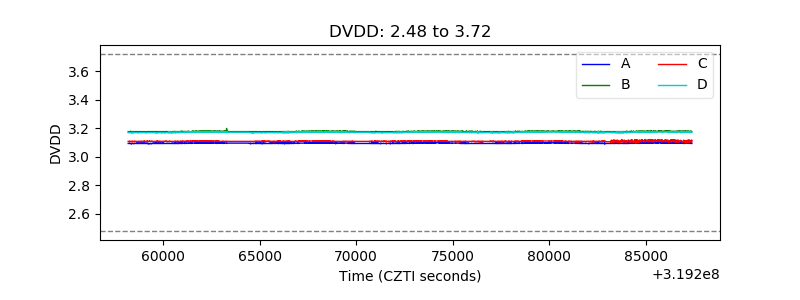 |
| Temperature 1 | 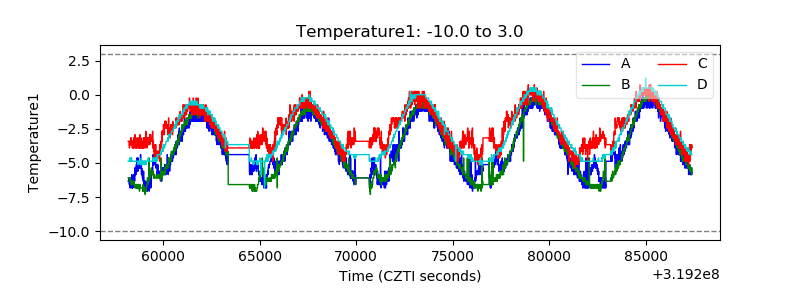 |
| Veto HV Monitor | 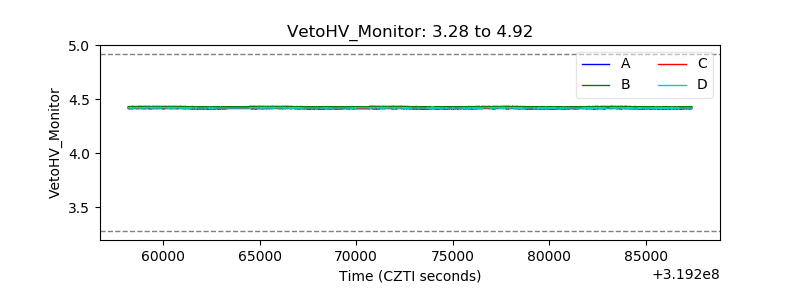 |
| Veto LLD | 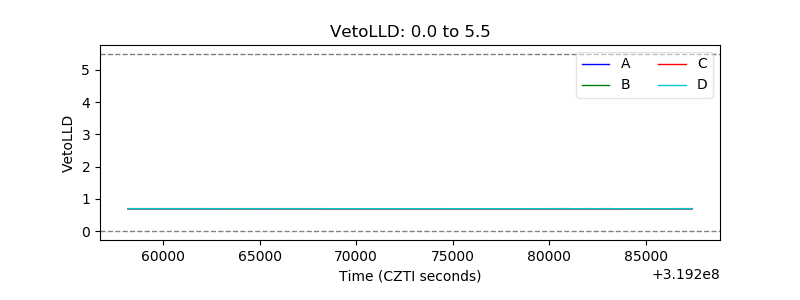 |
| Alpha Counter | 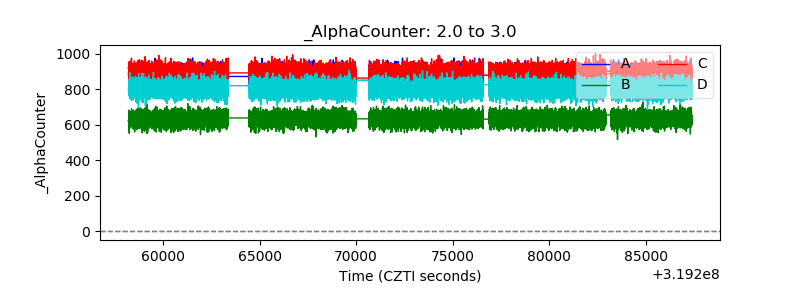 |
| _CPM_Rate | 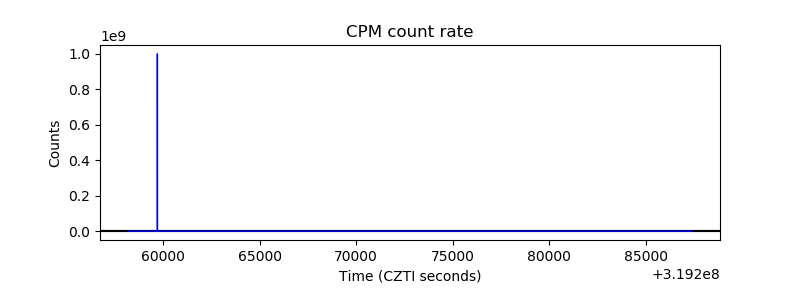 |
| CZT Counter |  |
| +2.5 Volts monitor |  |
| +5 Volts monitor | 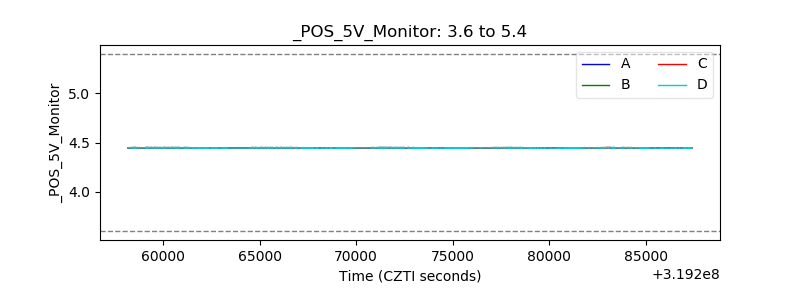 |
| _ROLL_ROT | 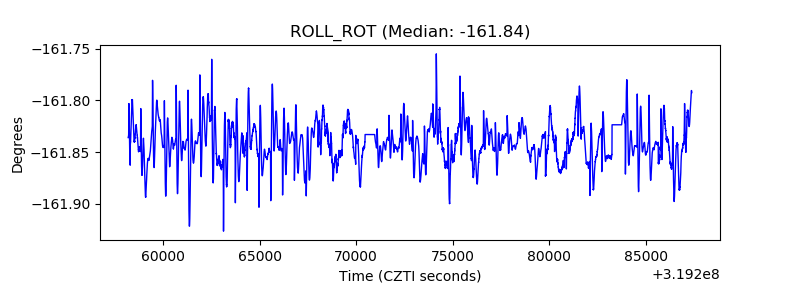 |
| _Roll_DEC | 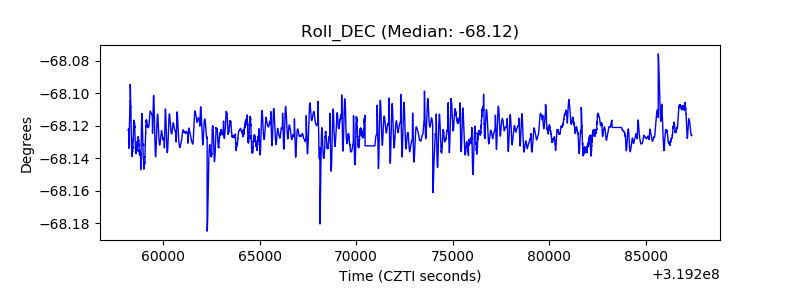 |
| _Roll_RA |  |
| Veto Counter | 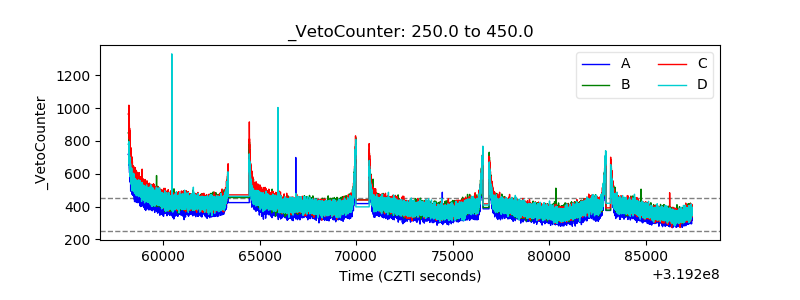 |