| Param | Original file | Final file |
|---|---|---|
| Filename | modeM0/AS1A08_004T02_9000003496_23676cztM0_level2.evt | modeM0/AS1A08_004T02_9000003496_23676cztM0_level2_quad_clean.evt |
| Size (bytes) | 240,598,080 | 61,511,040 |
| Size | 229.5 MB | 58.7 MB |
| Events in quadrant A | 1,540,141 | 413,332 |
| Events in quadrant B | 1,920,146 | 411,870 |
| Events in quadrant C | 1,494,532 | 404,202 |
| Events in quadrant D | 2,098,202 | 391,247 |
| Mode M0 | |||
|---|---|---|---|
| Quadrant | BADHDUFLAG | Total packets | Discarded packets |
| A | 0 | 7008 | 0 |
| B | 0 | 7905 | 0 |
| C | 0 | 6858 | 0 |
| D | 0 | 8477 | 0 |
| Mode SS | |||
|---|---|---|---|
| Quadrant | BADHDUFLAG | Total packets | Discarded packets |
| A | 0 | 68 | 0 |
| B | 0 | 68 | 0 |
| C | 0 | 68 | 0 |
| D | 0 | 68 | 0 |
| Quadrant | Total seconds | Saturated seconds | Saturation percentage |
|---|---|---|---|
| A | 3411 | 10 | 0.293169% |
| B | 3412 | 70 | 2.051583% |
| C | 3412 | 7 | 0.205158% |
| D | 3412 | 81 | 2.373974% |
Noise dominated data is calculated using 1-second bins in cleaned event files. If a bin has >2000 counts, and if more than 50% of those come from <1% of pixels, then it is considered to be noise-dominated and hence unusable.
| Quadrant | # 1 sec bins | Bins with >0 counts | Bins with >2000 counts | High rate bins dominated by noise | Noise dominated (total time) | Noise dominated (detector-on time) | Marked lightcurve |
|---|---|---|---|---|---|---|---|
| A | 3411 | 3411 | 5 | 5 | 0.15% | 0.15% | 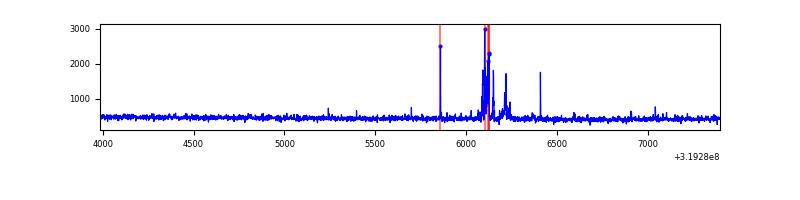 |
| B | 3412 | 3412 | 50 | 50 | 1.47% | 1.47% | 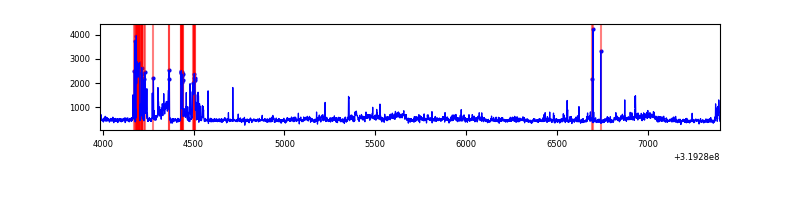 |
| C | 3412 | 3412 | 0 | 0 | 0.00% | 0.00% | 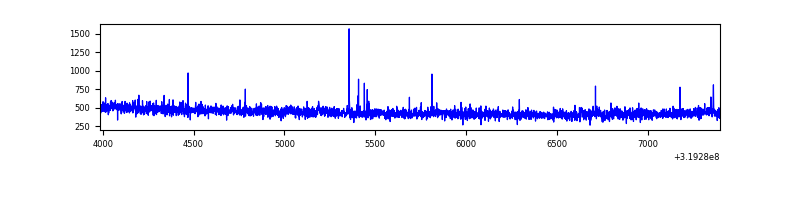 |
| D | 3412 | 3412 | 72 | 72 | 2.11% | 2.11% | 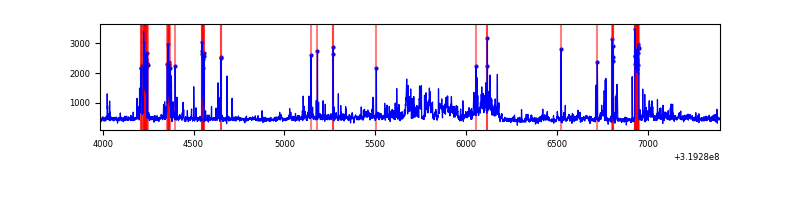 |
Top three noisy pixels from each quadrant. If the there are fewer than three noisy pixels in the level2.evt file, extra rows are filled as -1
| Pixel properties | Quadrant properties | ||||||
|---|---|---|---|---|---|---|---|
| Quadrant | DetID | PixID | Counts | Sigma | Mean | Median | Sigma |
| A | 12 | 96 | 68648 | 867.85 | 381 | 372 | 78.7 |
| A | 13 | 254 | 6902 | 83.0 | 381 | 372 | 78.7 |
| A | 0 | 226 | 3382 | 38.26 | 381 | 372 | 78.7 |
| B | 3 | 64 | 229666 | 3172.91 | 374 | 366 | 72.3 |
| B | 0 | 189 | 116954 | 1613.27 | 374 | 366 | 72.3 |
| B | 15 | 32 | 28900 | 394.84 | 374 | 366 | 72.3 |
| C | 14 | 238 | 57457 | 667.5 | 359 | 360 | 85.5 |
| C | 8 | 208 | 8159 | 91.18 | 359 | 360 | 85.5 |
| C | 7 | 247 | 7499 | 83.46 | 359 | 360 | 85.5 |
| D | 7 | 238 | 184764 | 2061.0 | 362 | 350 | 89.5 |
| D | 12 | 235 | 160168 | 1786.12 | 362 | 350 | 89.5 |
| D | 12 | 233 | 145632 | 1623.66 | 362 | 350 | 89.5 |
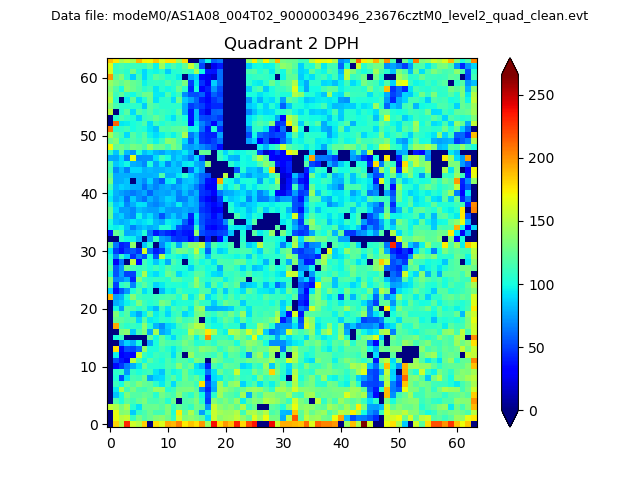
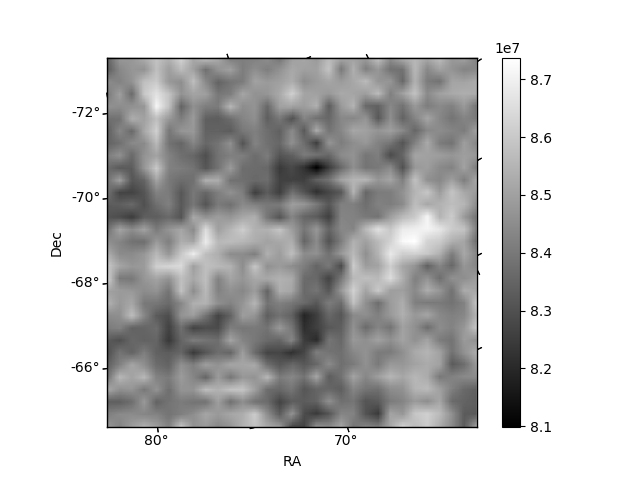
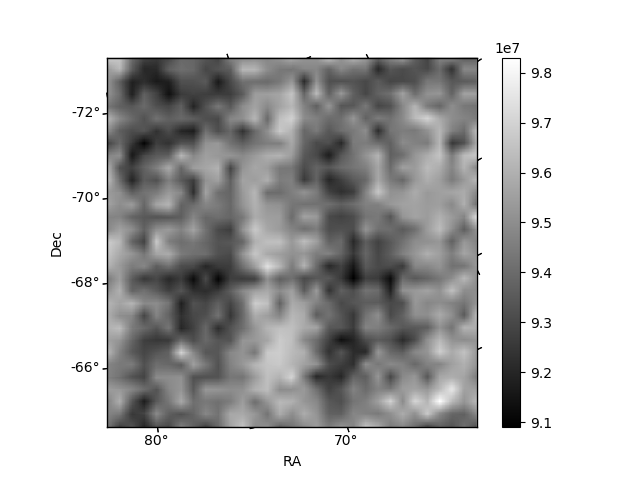
Histogram calculated using DETX and DETY for each event in the final _common_clean file
| Quadrant A | 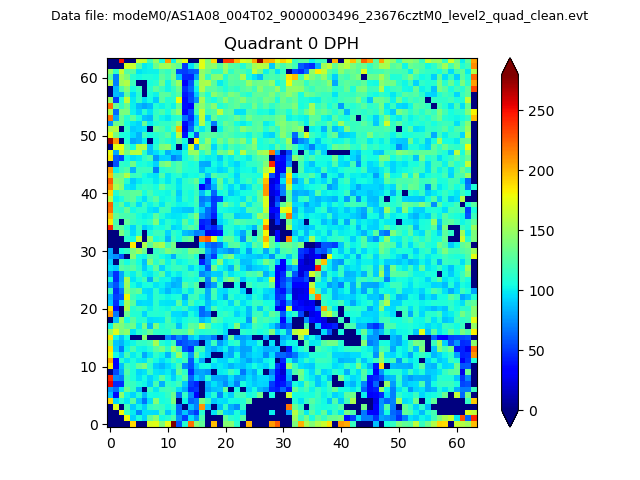 |
 |
Quadrant B |
|---|---|---|---|
| Quadrant D |  |
 |
Quadrant C |
| Plot type | Count rate plots | Images |
|---|---|---|
| Comparison with Poisson distribution Blue bars denote a histogram of data divided into 1 sec bins. Red curve is a Poisson curve with rate = median count rate of data. |
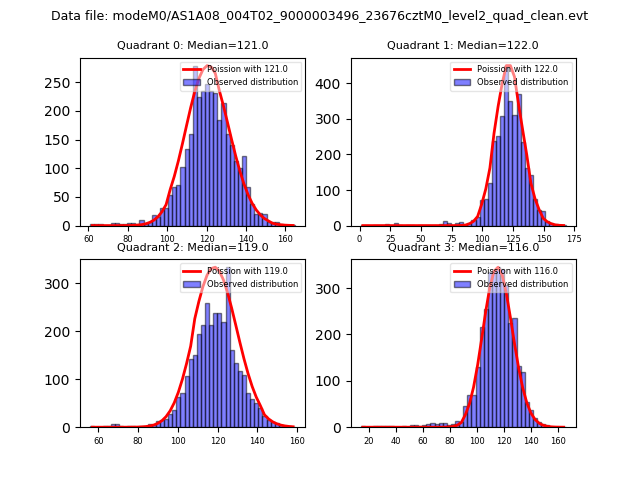 |
 |
| Quadrant-wise count rates Data is divided into 100 sec bins |
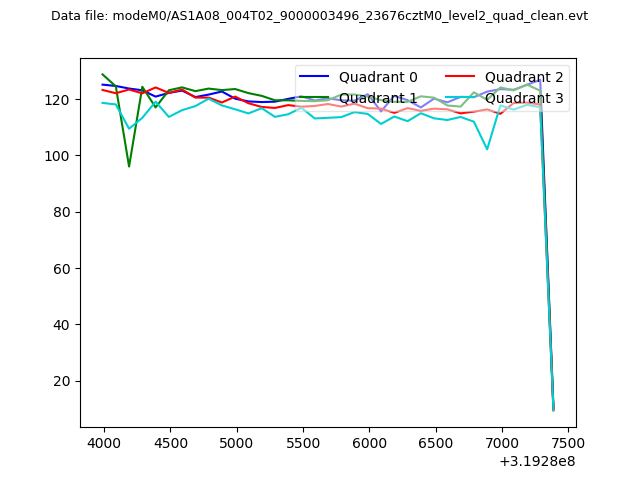 |
|
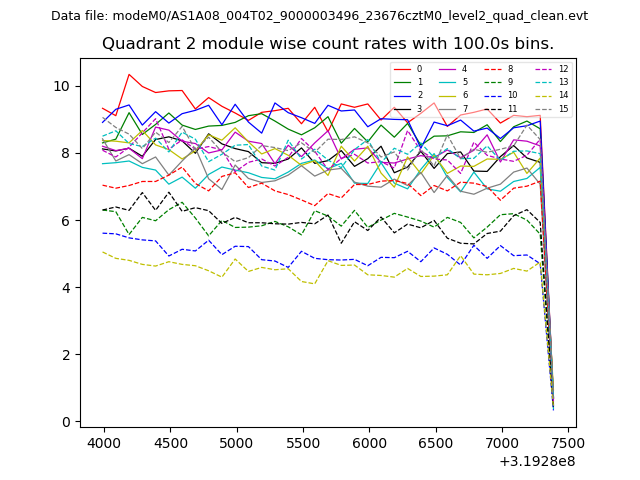
| Module-wise count rates for Quadrant A Data is divided into 100 sec bins |
 |
 |
| Module-wise count rates for Quadrant B Data is divided into 100 sec bins |
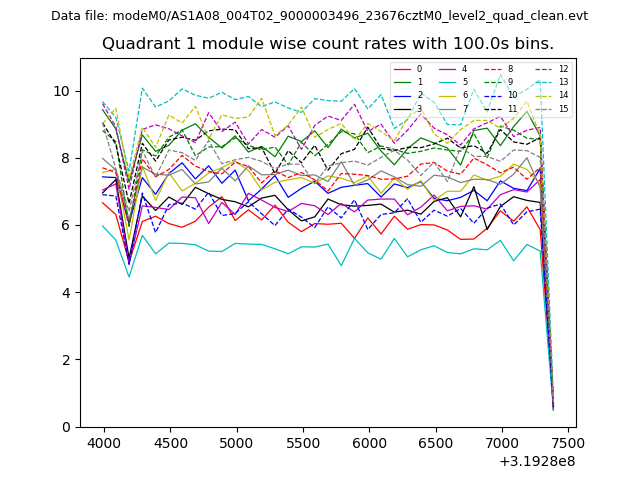 |
 |
| Module-wise count rates for Quadrant C Data is divided into 100 sec bins |
 |
 |
| Module-wise count rates for Quadrant D Data is divided into 100 sec bins |
 |
 |
| Parameter | Plot |
|---|---|
| CZT HV Monitor | 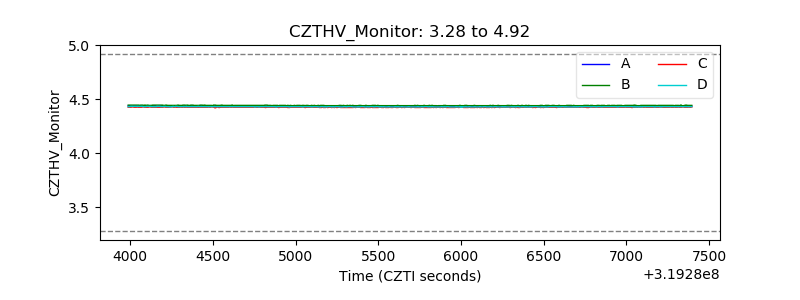 |
| D_VDD | 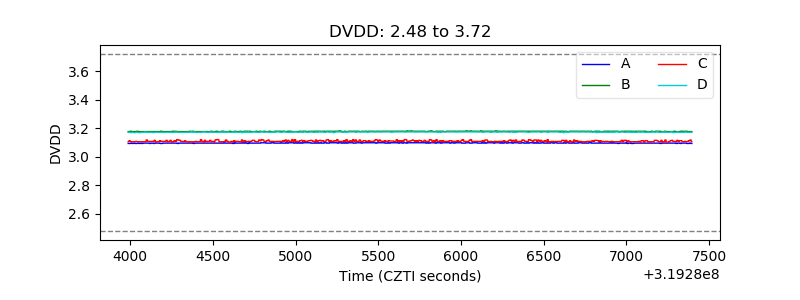 |
| Temperature 1 | 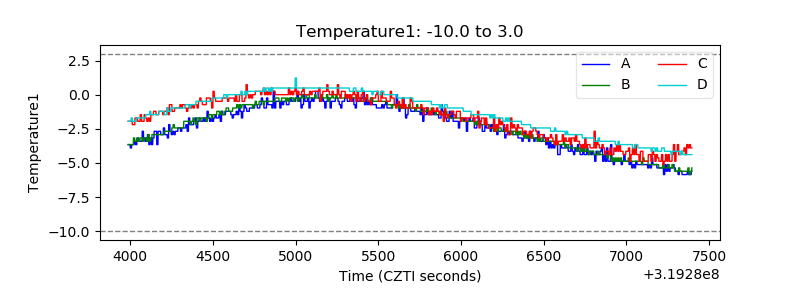 |
| Veto HV Monitor | 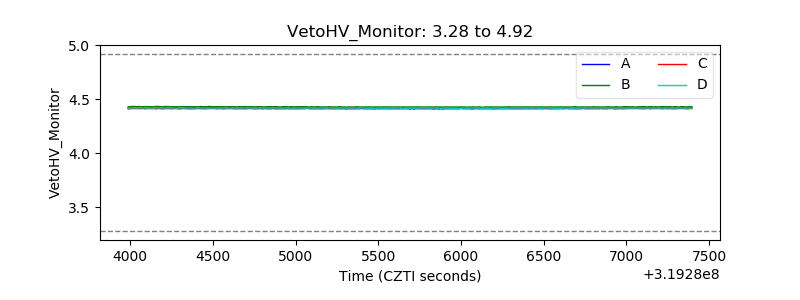 |
| Veto LLD | 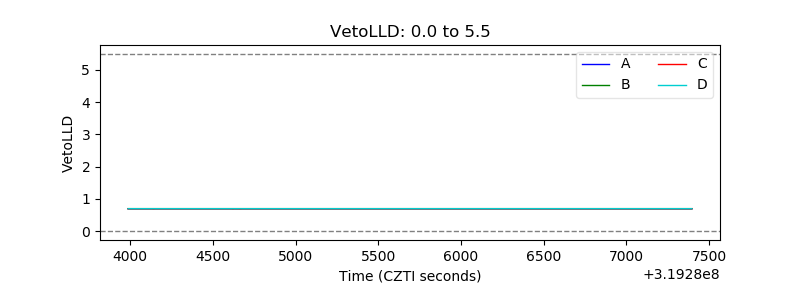 |
| Alpha Counter | 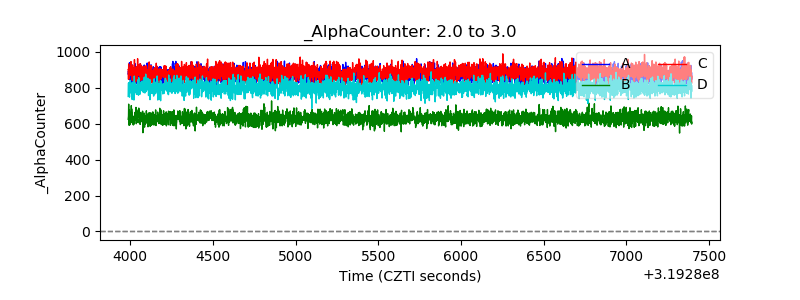 |
| _CPM_Rate | 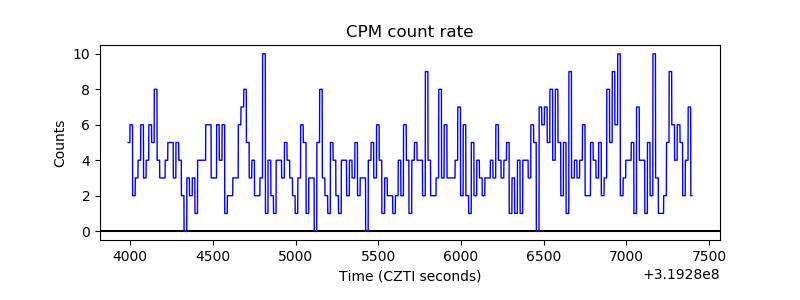 |
| CZT Counter | 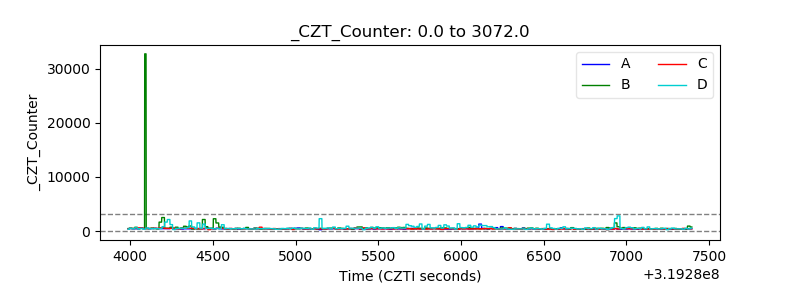 |
| +2.5 Volts monitor |  |
| +5 Volts monitor |  |
| _ROLL_ROT | 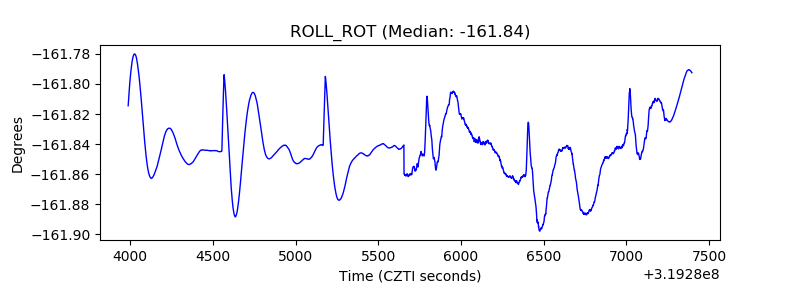 |
| _Roll_DEC | 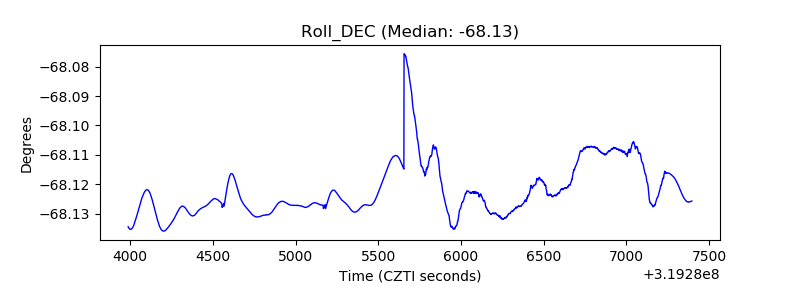 |
| _Roll_RA | 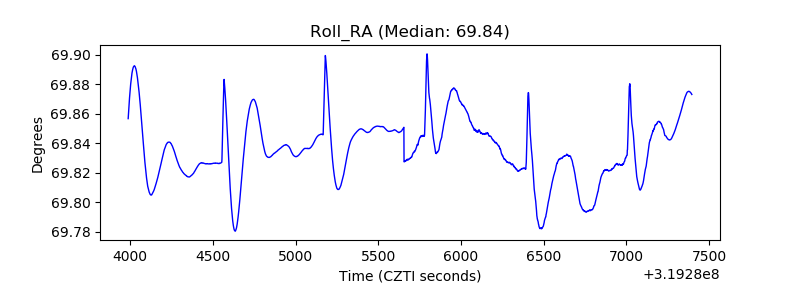 |
| Veto Counter | 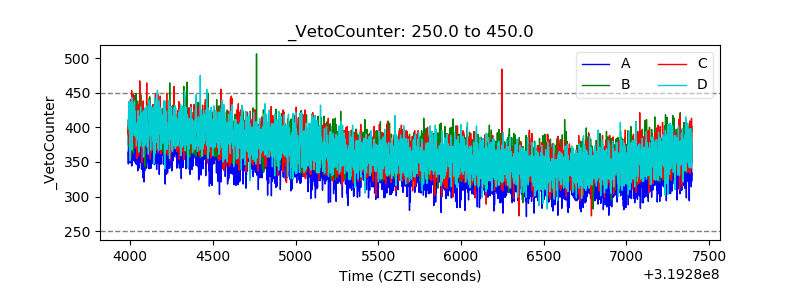 |