| Param | Original file | Final file |
|---|---|---|
| Filename | modeM0/AS1A07_046T01_9000003498cztM0_level2.fits | modeM0/AS1A07_046T01_9000003498cztM0_level2_quad_clean.evt |
| Size (bytes) | 290,350,080 | 275,935,680 |
| Size | 276.9 MB | 263.2 MB |
| Events in quadrant A | 1,793,278 | 1,644,718 |
| Events in quadrant B | 1,720,660 | 1,656,387 |
| Events in quadrant C | 1,751,326 | 1,590,909 |
| Events in quadrant D | 1,513,124 | 1,449,470 |
| Mode M0 | |||
|---|---|---|---|
| Quadrant | BADHDUFLAG | Total packets | Discarded packets |
| A | 0 | 60988 | 0 |
| B | 0 | 65094 | 0 |
| C | 0 | 62210 | 0 |
| D | 0 | 77173 | 0 |
| Mode SS | |||
|---|---|---|---|
| Quadrant | BADHDUFLAG | Total packets | Discarded packets |
| A | 0 | 602 | 0 |
| B | 0 | 602 | 0 |
| C | 0 | 602 | 0 |
| D | 0 | 602 | 0 |
| Mode M9 | |||
|---|---|---|---|
| Quadrant | BADHDUFLAG | Total packets | Discarded packets |
| A | 0 | 62 | 0 |
| B | 0 | 62 | 0 |
| C | 0 | 62 | 0 |
| D | 0 | 62 | 0 |
| Quadrant | Total seconds | Saturated seconds | Saturation percentage |
|---|---|---|---|
| A | 29305 | 243 | 0.829210% |
| B | 29305 | 567 | 1.934823% |
| C | 29305 | 452 | 1.542399% |
| D | 29304 | 1336 | 4.559105% |
Noise dominated data is calculated using 1-second bins in cleaned event files. If a bin has >2000 counts, and if more than 50% of those come from <1% of pixels, then it is considered to be noise-dominated and hence unusable.
| Quadrant | # 1 sec bins | Bins with >0 counts | Bins with >2000 counts | High rate bins dominated by noise | Noise dominated (total time) | Noise dominated (detector-on time) | Marked lightcurve |
|---|---|---|---|---|---|---|---|
| A | 39463 | 29301 | 0 | 0 | 0.00% | 0.00% |  |
| B | 39463 | 29299 | 0 | 0 | 0.00% | 0.00% |  |
| C | 39463 | 29301 | 0 | 0 | 0.00% | 0.00% |  |
| D | 39463 | 29288 | 0 | 0 | 0.00% | 0.00% |  |
Top three noisy pixels from each quadrant. If the there are fewer than three noisy pixels in the level2.evt file, extra rows are filled as -1
| Pixel properties | Quadrant properties | ||||||
|---|---|---|---|---|---|---|---|
| Quadrant | DetID | PixID | Counts | Sigma | Mean | Median | Sigma |
| A | 0 | 29 | 1693 | 10.82 | 465 | 434 | 116.4 |
| A | 7 | 110 | 1407 | 8.36 | 465 | 434 | 116.4 |
| A | 0 | 30 | 1341 | 7.79 | 465 | 434 | 116.4 |
| B | 2 | 9 | 1348 | 10.12 | 454 | 432 | 90.5 |
| B | 5 | 128 | 1164 | 8.09 | 454 | 432 | 90.5 |
| B | 5 | 232 | 1127 | 7.68 | 454 | 432 | 90.5 |
| C | 12 | 241 | 1208 | 6.49 | 463 | 432 | 119.6 |
| C | 3 | 126 | 1207 | 6.48 | 463 | 432 | 119.6 |
| C | 9 | 233 | 1170 | 6.17 | 463 | 432 | 119.6 |
| D | 4 | 246 | 1141 | 6.44 | 431 | 393 | 116.2 |
| D | 10 | 189 | 1100 | 6.09 | 431 | 393 | 116.2 |
| D | 6 | 67 | 1080 | 5.91 | 431 | 393 | 116.2 |
Histogram calculated using DETX and DETY for each event in the final _common_clean file
| Quadrant A |  |
 |
Quadrant B |
|---|---|---|---|
| Quadrant D | 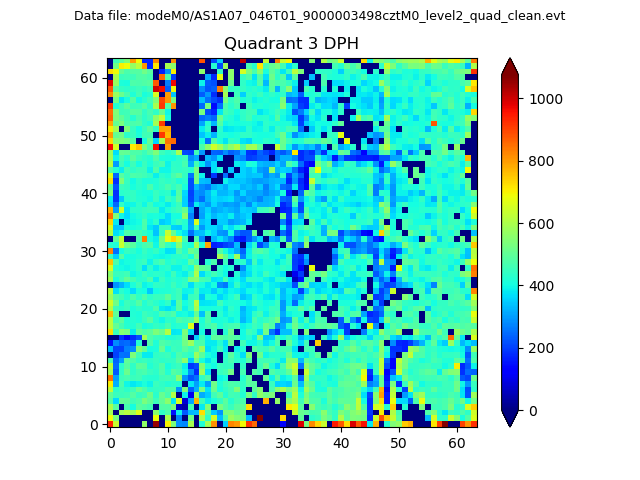 |
 |
Quadrant C |
| Plot type | Count rate plots | Images |
|---|---|---|
| Comparison with Poisson distribution Blue bars denote a histogram of data divided into 1 sec bins. Red curve is a Poisson curve with rate = median count rate of data. |
 |
 |
| Quadrant-wise count rates Data is divided into 100 sec bins |
 |
|
| Module-wise count rates for Quadrant A Data is divided into 100 sec bins |
 |
 |
| Module-wise count rates for Quadrant B Data is divided into 100 sec bins |
 |
 |
| Module-wise count rates for Quadrant C Data is divided into 100 sec bins |
 |
 |
| Module-wise count rates for Quadrant D Data is divided into 100 sec bins |
 |
 |
| Parameter | Plot |
|---|---|
| CZT HV Monitor |  |
| D_VDD | 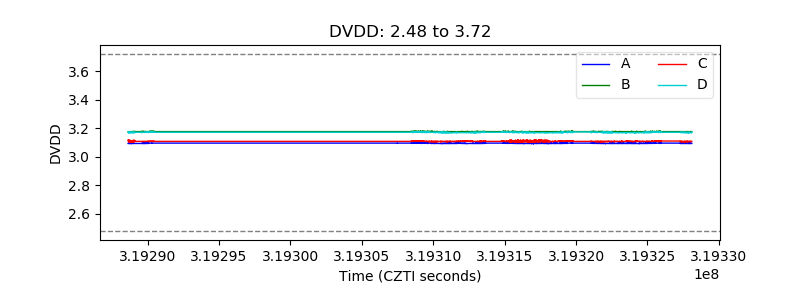 |
| Temperature 1 |  |
| Veto HV Monitor |  |
| Veto LLD |  |
| Alpha Counter |  |
| _CPM_Rate |  |
| CZT Counter |  |
| +2.5 Volts monitor |  |
| +5 Volts monitor |  |
| _ROLL_ROT |  |
| _Roll_DEC |  |
| _Roll_RA |  |
| Veto Counter |  |