| Param | Original file | Final file |
|---|---|---|
| Filename | modeM0/AS1A07_046T01_9000003498_23674cztM0_level2.evt | modeM0/AS1A07_046T01_9000003498_23674cztM0_level2_quad_clean.evt |
| Size (bytes) | 959,371,200 | 150,978,240 |
| Size | 914.9 MB | 144.0 MB |
| Events in quadrant A | 6,283,034 | 926,881 |
| Events in quadrant B | 7,373,108 | 935,732 |
| Events in quadrant C | 6,461,572 | 907,459 |
| Events in quadrant D | 8,043,657 | 889,945 |
| Mode M0 | |||
|---|---|---|---|
| Quadrant | BADHDUFLAG | Total packets | Discarded packets |
| A | 0 | 27104 | 3 |
| B | 0 | 30083 | 3 |
| C | 0 | 27414 | 3 |
| D | 0 | 32699 | 3 |
| Mode SS | |||
|---|---|---|---|
| Quadrant | BADHDUFLAG | Total packets | Discarded packets |
| A | 0 | 272 | 0 |
| B | 0 | 272 | 0 |
| C | 0 | 272 | 0 |
| D | 0 | 272 | 0 |
| Mode M9 | |||
|---|---|---|---|
| Quadrant | BADHDUFLAG | Total packets | Discarded packets |
| A | 0 | 17 | 0 |
| B | 0 | 17 | 0 |
| C | 0 | 17 | 0 |
| D | 0 | 17 | 0 |
| Quadrant | Total seconds | Saturated seconds | Saturation percentage |
|---|---|---|---|
| A | 13196 | 152 | 1.151864% |
| B | 13196 | 417 | 3.160048% |
| C | 13196 | 239 | 1.811155% |
| D | 13195 | 398 | 3.016294% |
Noise dominated data is calculated using 1-second bins in cleaned event files. If a bin has >2000 counts, and if more than 50% of those come from <1% of pixels, then it is considered to be noise-dominated and hence unusable.
| Quadrant | # 1 sec bins | Bins with >0 counts | Bins with >2000 counts | High rate bins dominated by noise | Noise dominated (total time) | Noise dominated (detector-on time) | Marked lightcurve |
|---|---|---|---|---|---|---|---|
| A | 15031 | 13196 | 0 | 0 | 0.00% | 0.00% | 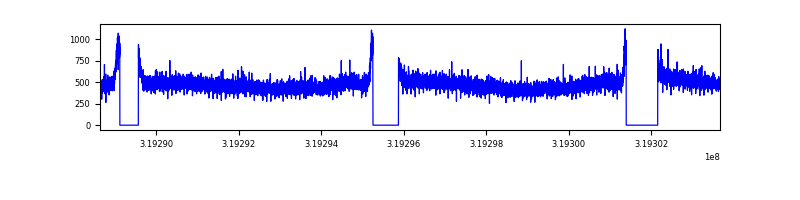 |
| B | 15031 | 13196 | 177 | 177 | 1.18% | 1.34% | 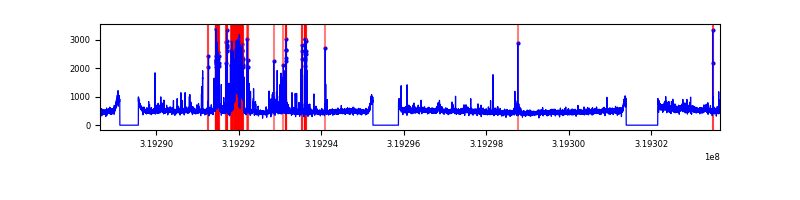 |
| C | 15031 | 13196 | 6 | 6 | 0.04% | 0.05% | 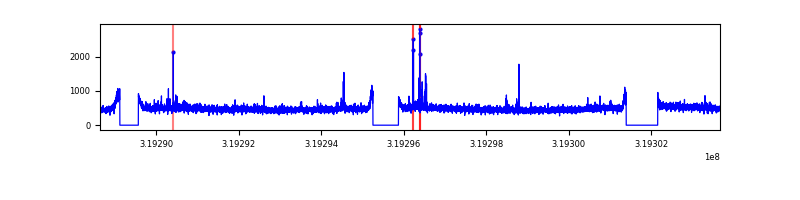 |
| D | 15030 | 13195 | 179 | 179 | 1.19% | 1.36% | 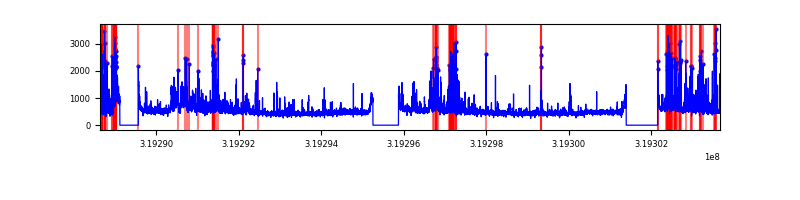 |
Top three noisy pixels from each quadrant. If the there are fewer than three noisy pixels in the level2.evt file, extra rows are filled as -1
| Pixel properties | Quadrant properties | ||||||
|---|---|---|---|---|---|---|---|
| Quadrant | DetID | PixID | Counts | Sigma | Mean | Median | Sigma |
| A | 13 | 254 | 24266 | 68.86 | 1629 | 1594 | 329.2 |
| A | 3 | 137 | 14381 | 38.84 | 1629 | 1594 | 329.2 |
| A | 0 | 226 | 14117 | 38.04 | 1629 | 1594 | 329.2 |
| B | 3 | 64 | 818867 | 2649.87 | 1608 | 1570 | 308.4 |
| B | 0 | 189 | 99823 | 318.56 | 1608 | 1570 | 308.4 |
| B | 0 | 230 | 54878 | 172.84 | 1608 | 1570 | 308.4 |
| C | 14 | 238 | 244751 | 655.18 | 1566 | 1576 | 371.2 |
| C | 7 | 247 | 101645 | 269.61 | 1566 | 1576 | 371.2 |
| C | 8 | 208 | 11141 | 25.77 | 1566 | 1576 | 371.2 |
| D | 12 | 233 | 793247 | 2053.95 | 1581 | 1537 | 385.5 |
| D | 1 | 52 | 790559 | 2046.97 | 1581 | 1537 | 385.5 |
| D | 12 | 235 | 289063 | 745.93 | 1581 | 1537 | 385.5 |
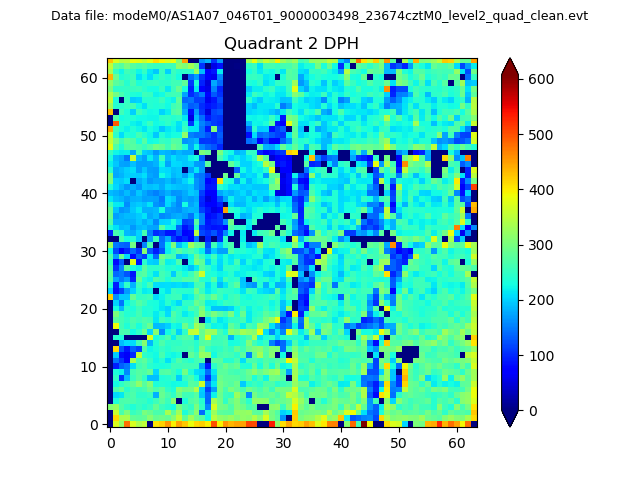
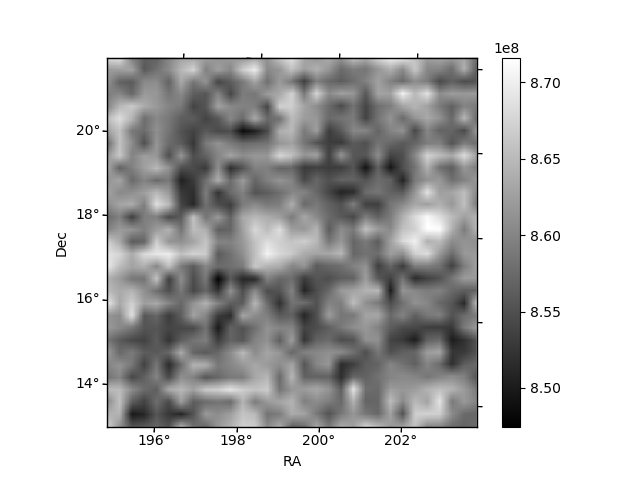
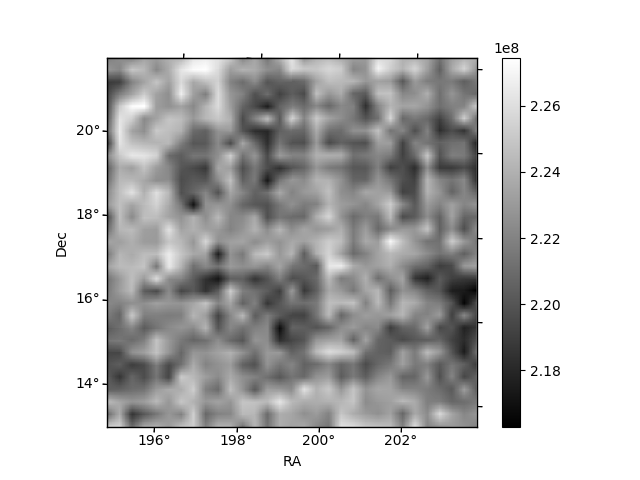
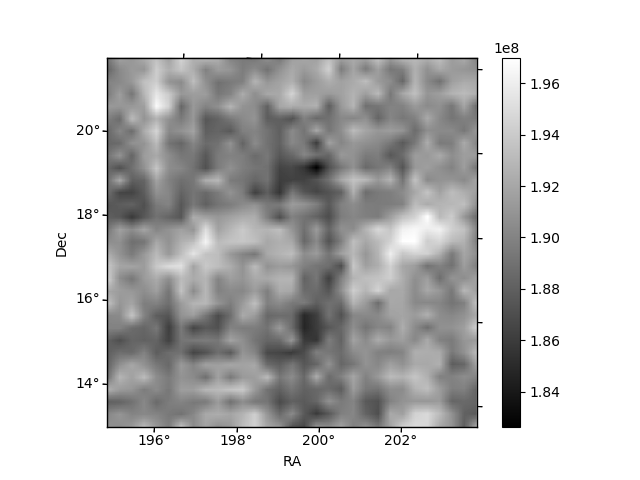
Histogram calculated using DETX and DETY for each event in the final _common_clean file
| Quadrant A | 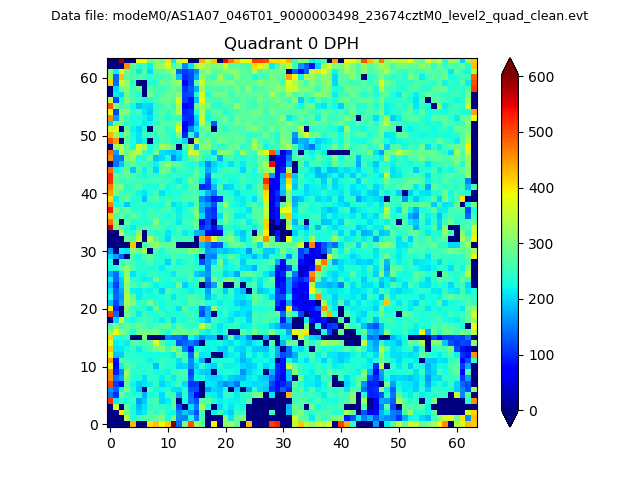 |
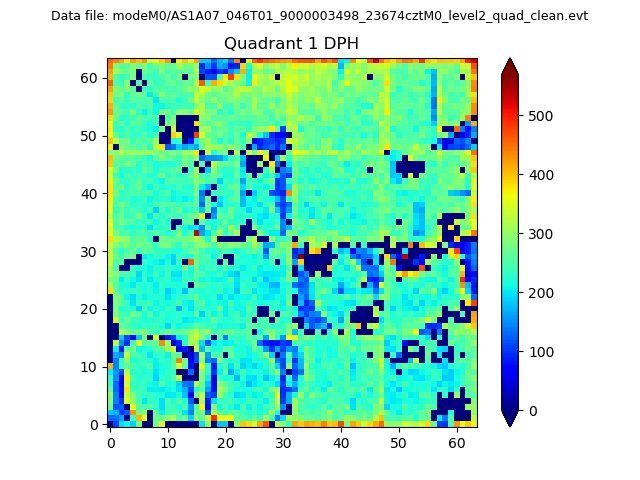 |
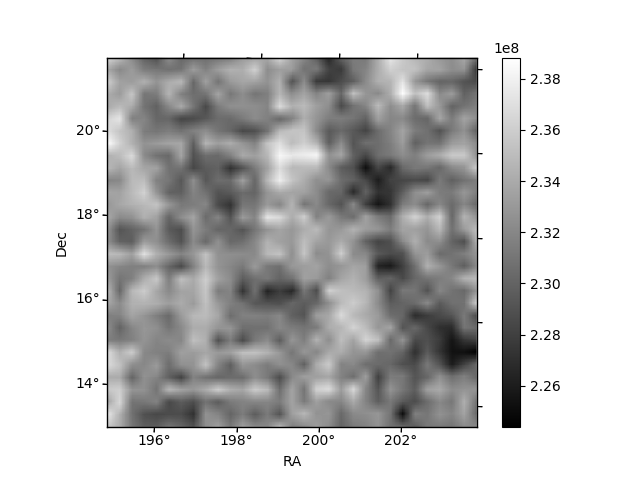
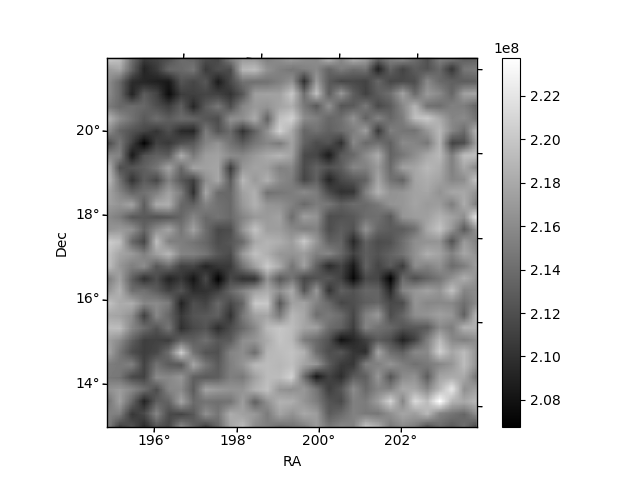
Quadrant B |
|---|---|---|---|
| Quadrant D | 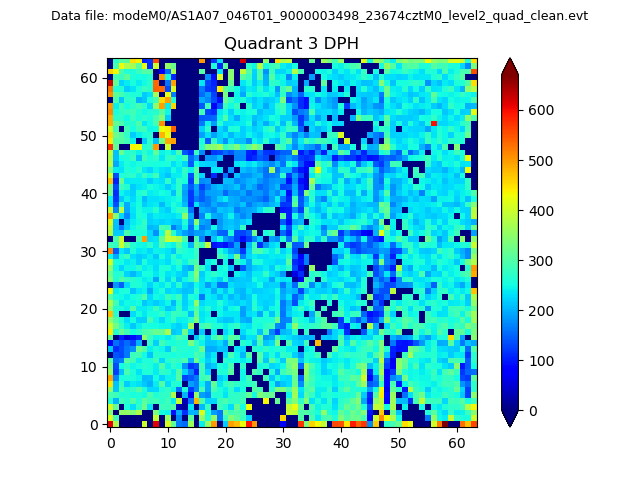 |
 |
Quadrant C |
| Plot type | Count rate plots | Images |
|---|---|---|
| Comparison with Poisson distribution Blue bars denote a histogram of data divided into 1 sec bins. Red curve is a Poisson curve with rate = median count rate of data. |
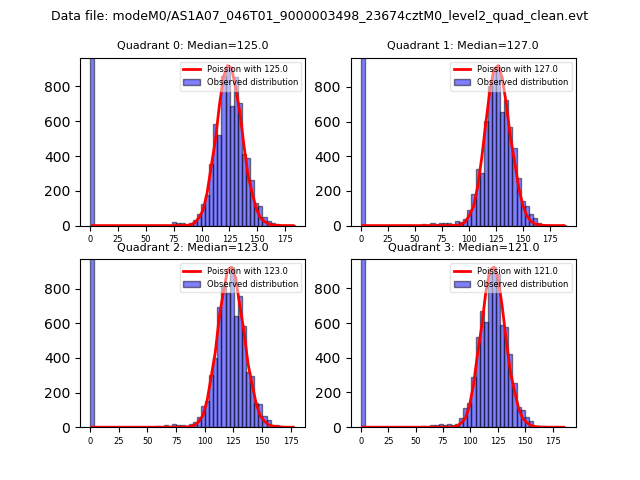 |
 |
| Quadrant-wise count rates Data is divided into 100 sec bins |
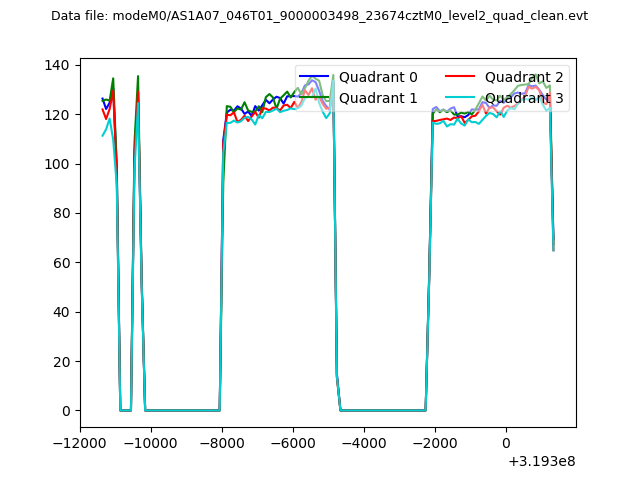 |
|
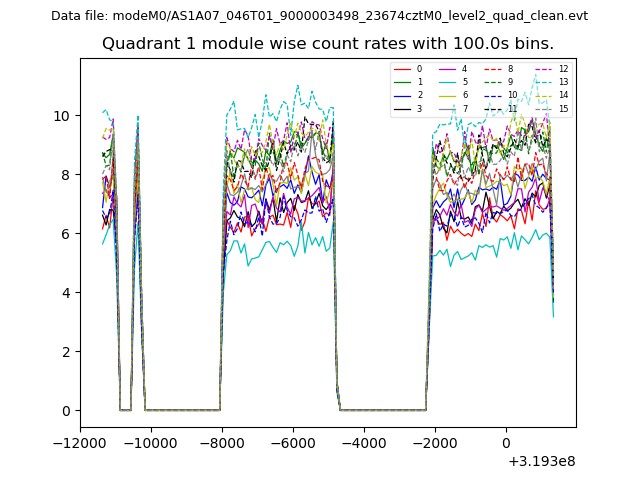
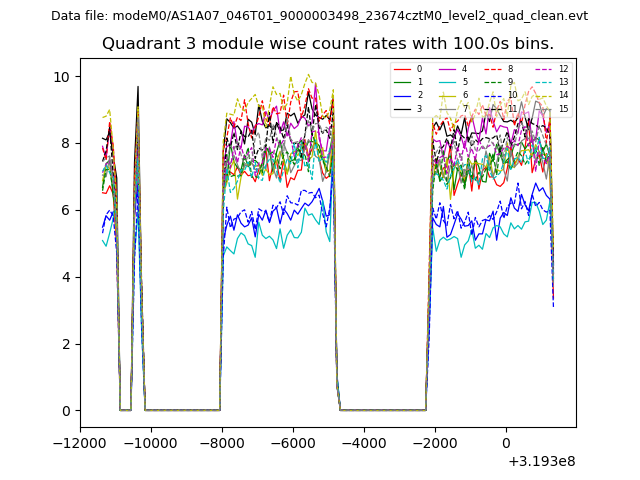
| Module-wise count rates for Quadrant A Data is divided into 100 sec bins |
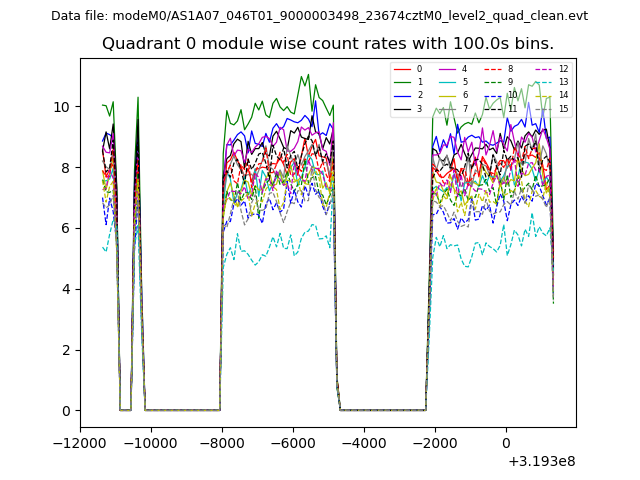 |
 |
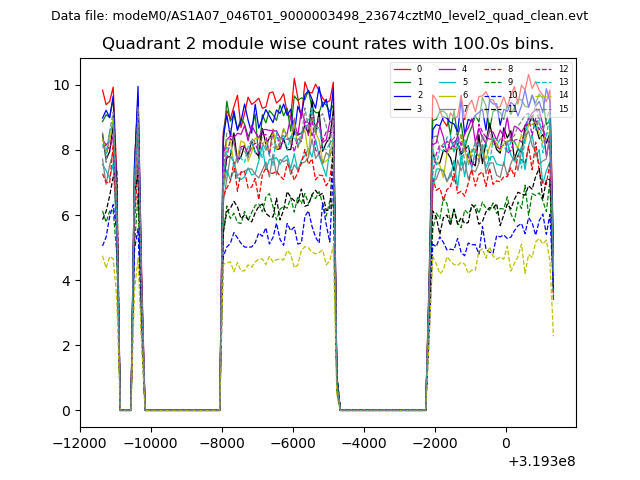
| Module-wise count rates for Quadrant B Data is divided into 100 sec bins |
 |
 |
| Module-wise count rates for Quadrant C Data is divided into 100 sec bins |
 |
 |
| Module-wise count rates for Quadrant D Data is divided into 100 sec bins |
 |
 |
| Parameter | Plot |
|---|---|
| CZT HV Monitor | 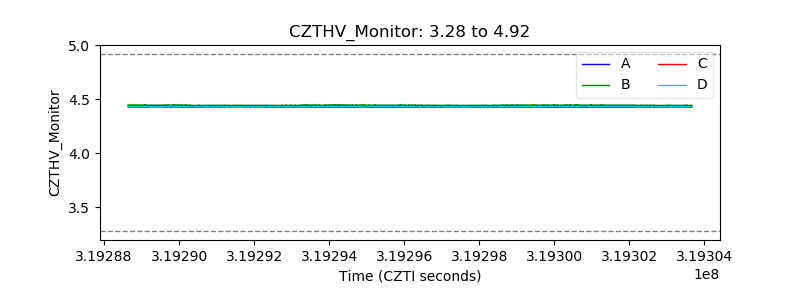 |
| D_VDD | 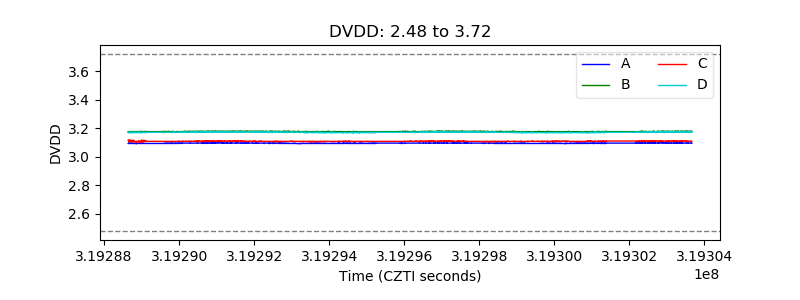 |
| Temperature 1 | 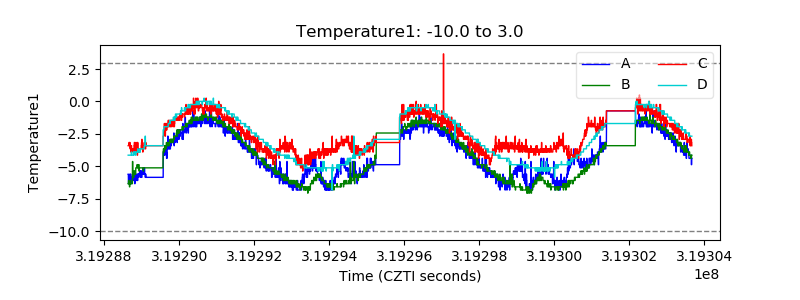 |
| Veto HV Monitor | 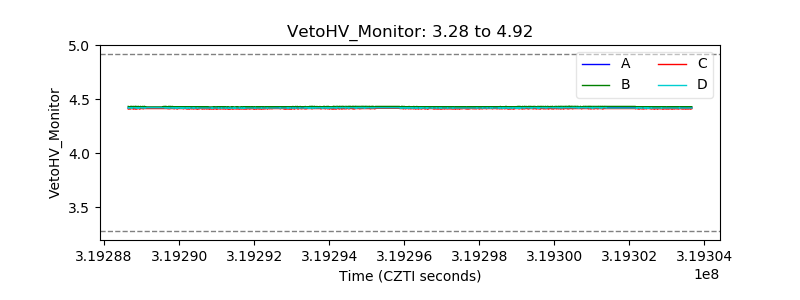 |
| Veto LLD | 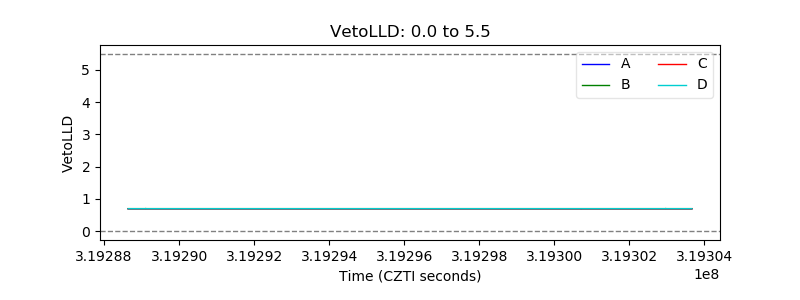 |
| Alpha Counter | 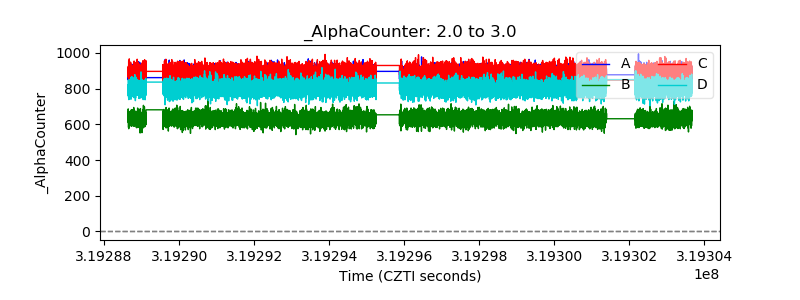 |
| _CPM_Rate | 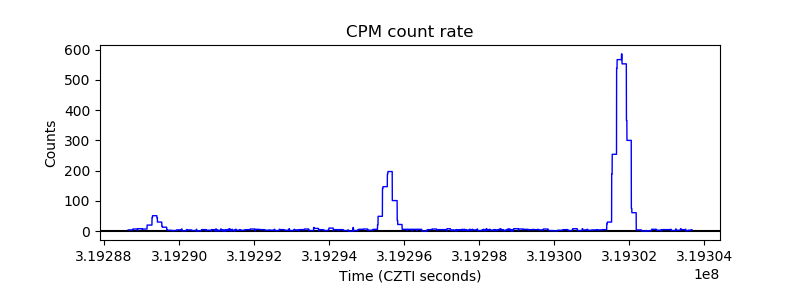 |
| CZT Counter | 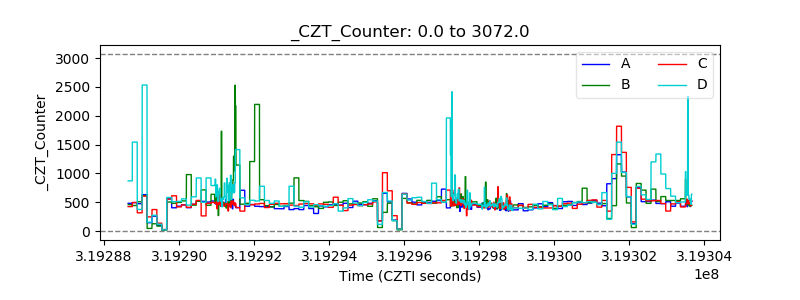 |
| +2.5 Volts monitor |  |
| +5 Volts monitor |  |
| _ROLL_ROT | 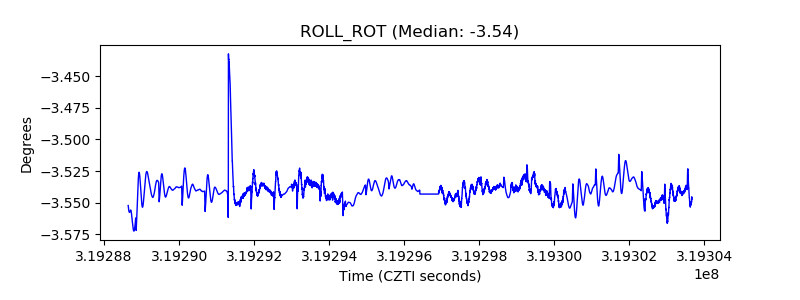 |
| _Roll_DEC | 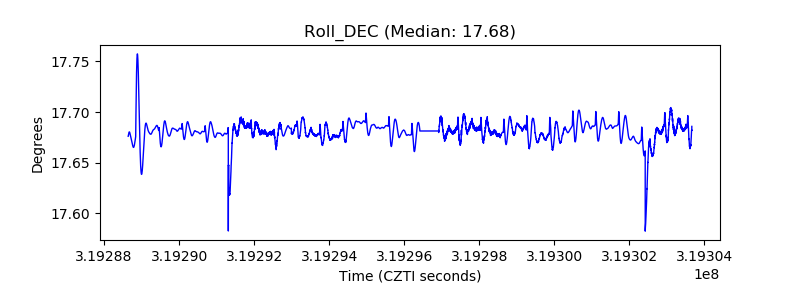 |
| _Roll_RA | 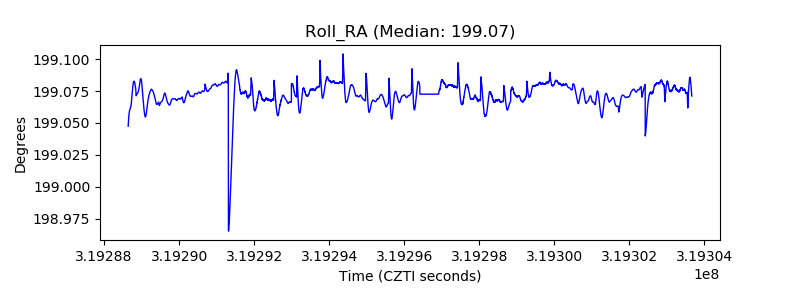 |
| Veto Counter | 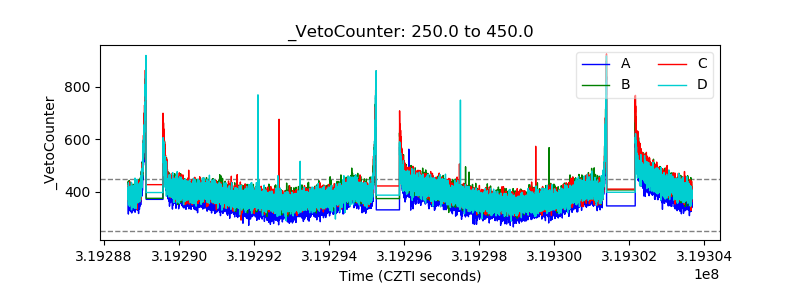 |