| Param | Original file | Final file |
|---|---|---|
| Filename | modeM0/AS1A07_046T01_9000003498_23675cztM0_level2.evt | modeM0/AS1A07_046T01_9000003498_23675cztM0_level2_quad_clean.evt |
| Size (bytes) | 527,541,120 | 84,810,240 |
| Size | 503.1 MB | 80.9 MB |
| Events in quadrant A | 3,466,164 | 524,506 |
| Events in quadrant B | 3,648,418 | 532,301 |
| Events in quadrant C | 3,525,718 | 514,450 |
| Events in quadrant D | 4,853,024 | 500,973 |
| Mode M0 | |||
|---|---|---|---|
| Quadrant | BADHDUFLAG | Total packets | Discarded packets |
| A | 0 | 14835 | 2 |
| B | 0 | 15431 | 3 |
| C | 0 | 14962 | 2 |
| D | 0 | 19269 | 2 |
| Mode SS | |||
|---|---|---|---|
| Quadrant | BADHDUFLAG | Total packets | Discarded packets |
| A | 0 | 148 | 0 |
| B | 0 | 148 | 0 |
| C | 0 | 148 | 0 |
| D | 0 | 148 | 0 |
| Mode M9 | |||
|---|---|---|---|
| Quadrant | BADHDUFLAG | Total packets | Discarded packets |
| A | 0 | 16 | 0 |
| B | 0 | 16 | 0 |
| C | 0 | 16 | 0 |
| D | 0 | 16 | 0 |
| Quadrant | Total seconds | Saturated seconds | Saturation percentage |
|---|---|---|---|
| A | 7116 | 69 | 0.969646% |
| B | 7116 | 92 | 1.292861% |
| C | 7116 | 127 | 1.784711% |
| D | 7116 | 320 | 4.496908% |
Noise dominated data is calculated using 1-second bins in cleaned event files. If a bin has >2000 counts, and if more than 50% of those come from <1% of pixels, then it is considered to be noise-dominated and hence unusable.
| Quadrant | # 1 sec bins | Bins with >0 counts | Bins with >2000 counts | High rate bins dominated by noise | Noise dominated (total time) | Noise dominated (detector-on time) | Marked lightcurve |
|---|---|---|---|---|---|---|---|
| A | 8811 | 7116 | 0 | 0 | 0.00% | 0.00% | 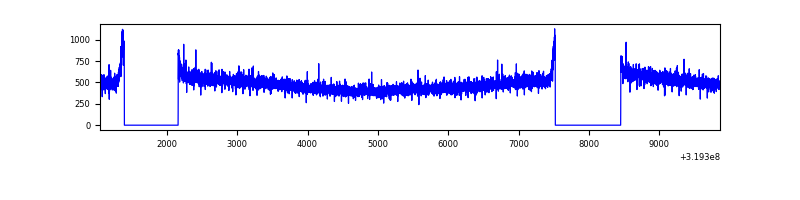 |
| B | 8811 | 7116 | 7 | 7 | 0.08% | 0.10% | 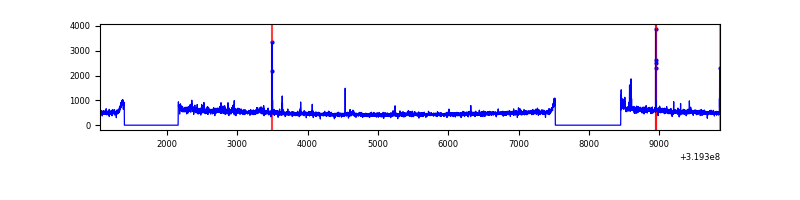 |
| C | 8811 | 7116 | 0 | 0 | 0.00% | 0.00% | 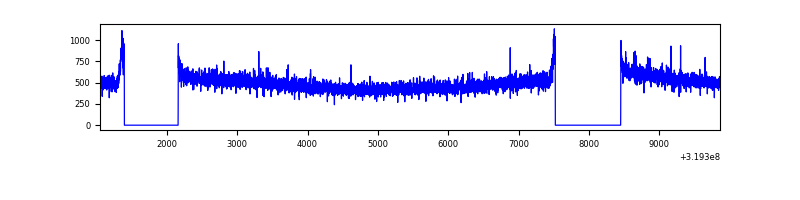 |
| D | 8811 | 7116 | 188 | 188 | 2.13% | 2.64% | 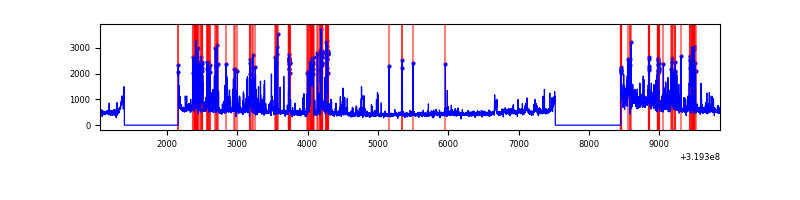 |
Top three noisy pixels from each quadrant. If the there are fewer than three noisy pixels in the level2.evt file, extra rows are filled as -1
| Pixel properties | Quadrant properties | ||||||
|---|---|---|---|---|---|---|---|
| Quadrant | DetID | PixID | Counts | Sigma | Mean | Median | Sigma |
| A | 13 | 254 | 12751 | 64.69 | 899 | 879 | 183.5 |
| A | 3 | 137 | 7967 | 38.62 | 899 | 879 | 183.5 |
| A | 0 | 226 | 7811 | 37.77 | 899 | 879 | 183.5 |
| B | 0 | 189 | 56817 | 321.67 | 893 | 871 | 173.9 |
| B | 15 | 33 | 34392 | 192.73 | 893 | 871 | 173.9 |
| B | 12 | 111 | 20857 | 114.91 | 893 | 871 | 173.9 |
| C | 14 | 238 | 135604 | 659.86 | 866 | 871 | 204.2 |
| C | 10 | 9 | 7662 | 33.26 | 866 | 871 | 204.2 |
| C | 13 | 61 | 6033 | 25.28 | 866 | 871 | 204.2 |
| D | 1 | 52 | 541724 | 2561.1 | 868 | 845 | 211.2 |
| D | 12 | 233 | 539147 | 2548.9 | 868 | 845 | 211.2 |
| D | 15 | 0 | 272997 | 1288.66 | 868 | 845 | 211.2 |
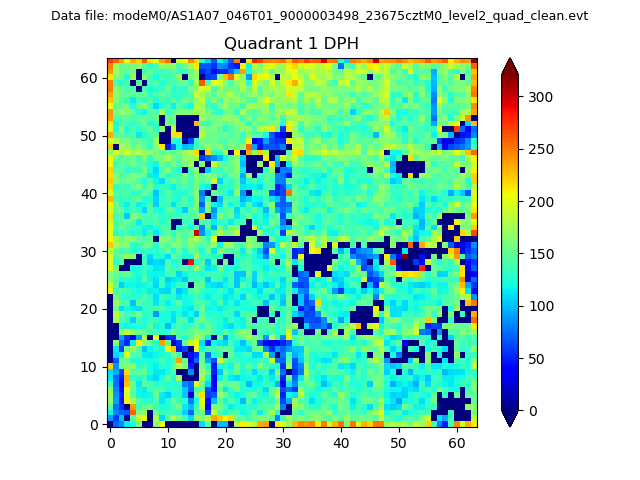
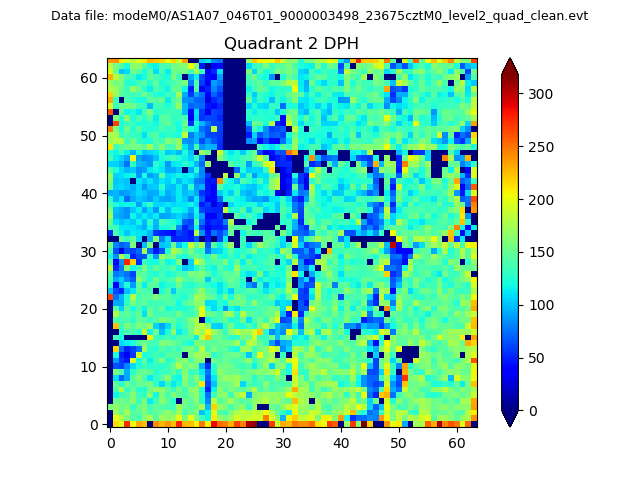
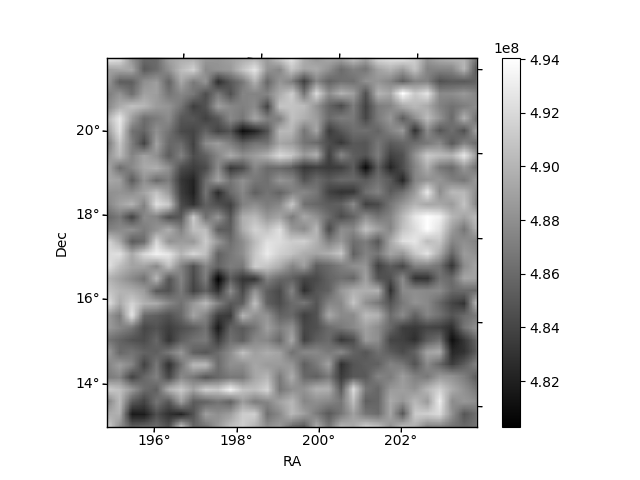
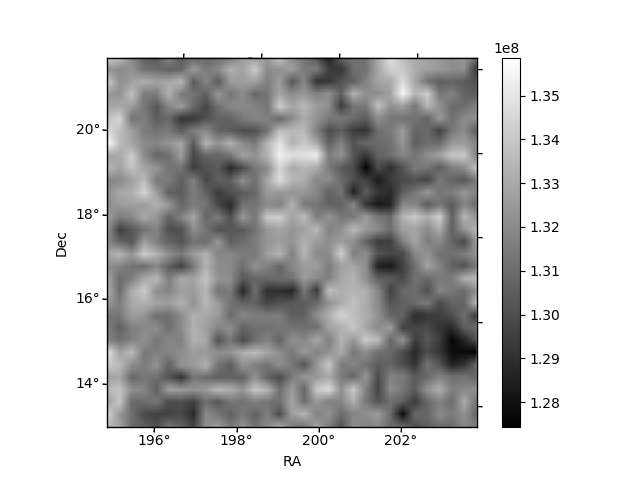
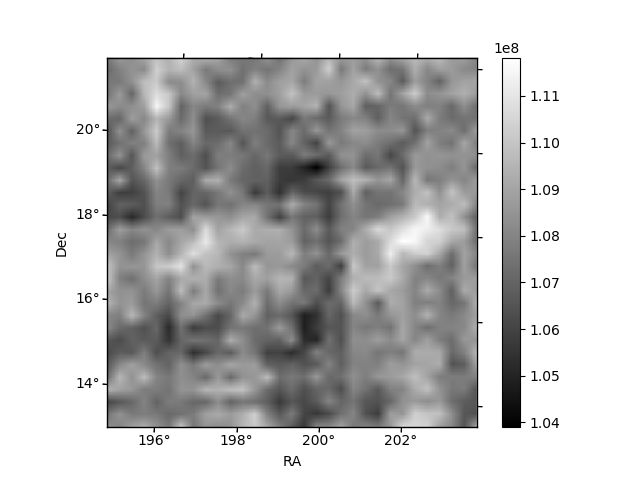
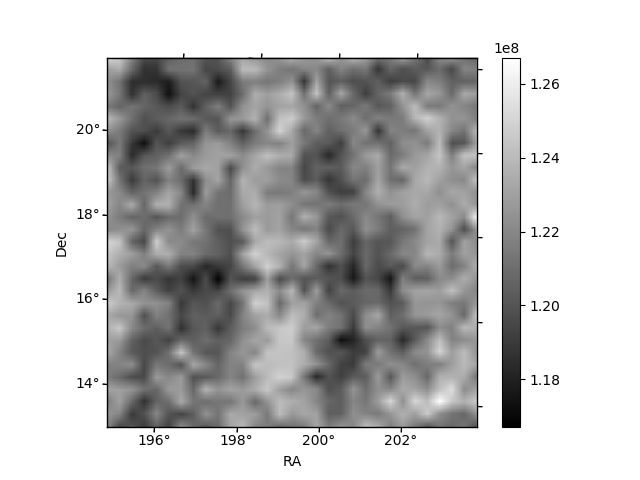
Histogram calculated using DETX and DETY for each event in the final _common_clean file
| Quadrant A |  |
 |
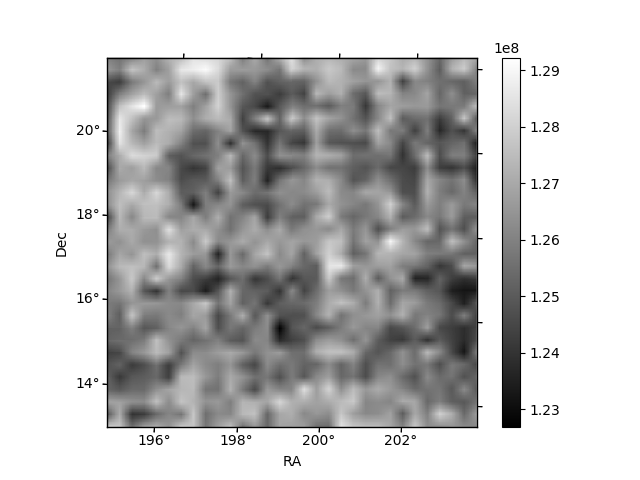
Quadrant B |
|---|---|---|---|
| Quadrant D | 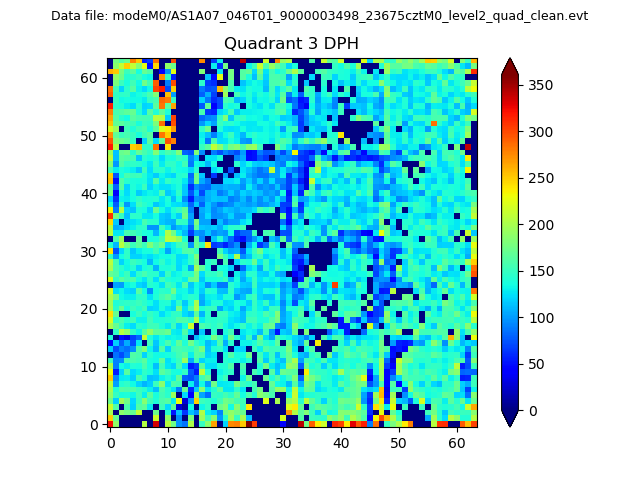 |
 |
Quadrant C |
| Plot type | Count rate plots | Images |
|---|---|---|
| Comparison with Poisson distribution Blue bars denote a histogram of data divided into 1 sec bins. Red curve is a Poisson curve with rate = median count rate of data. |
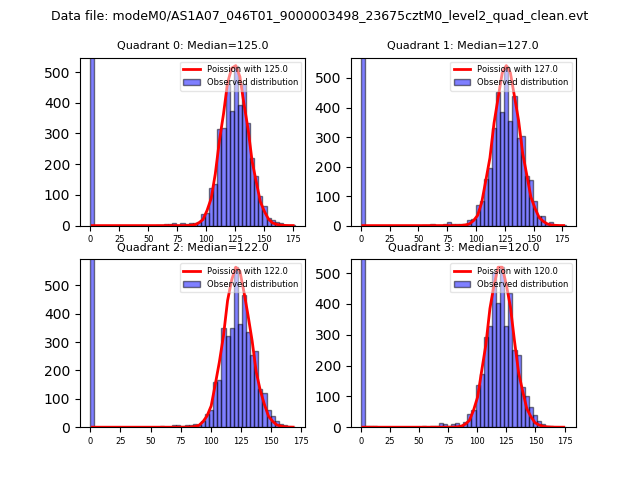 |
 |
| Quadrant-wise count rates Data is divided into 100 sec bins |
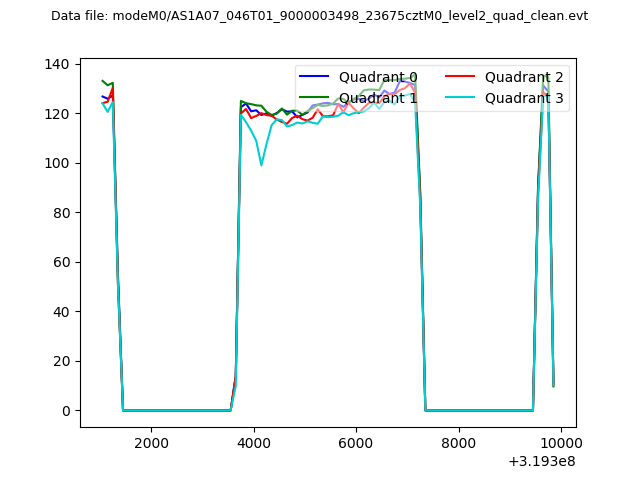 |
|
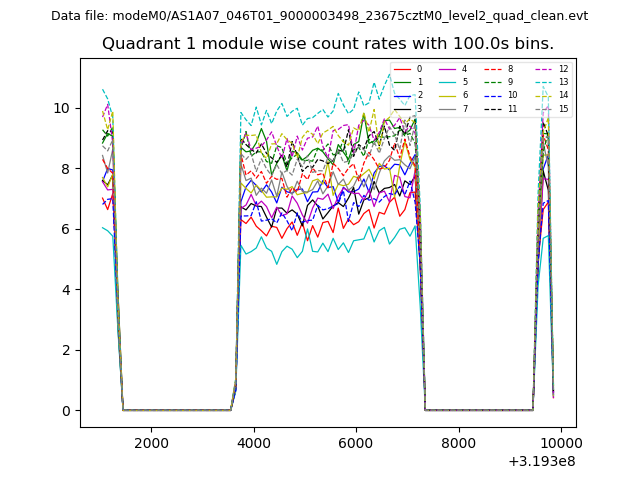
| Module-wise count rates for Quadrant A Data is divided into 100 sec bins |
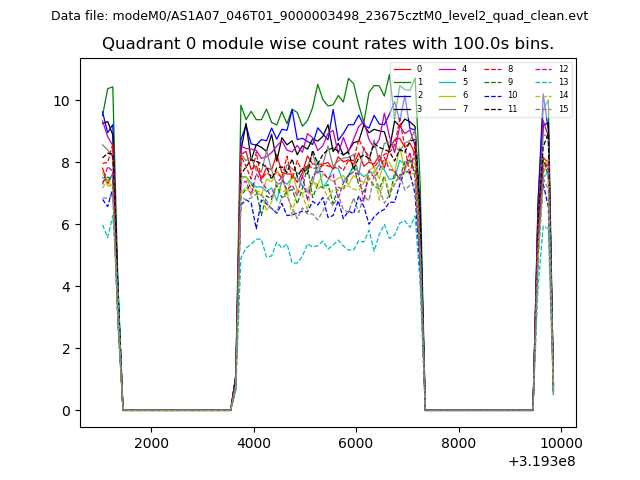 |
 |
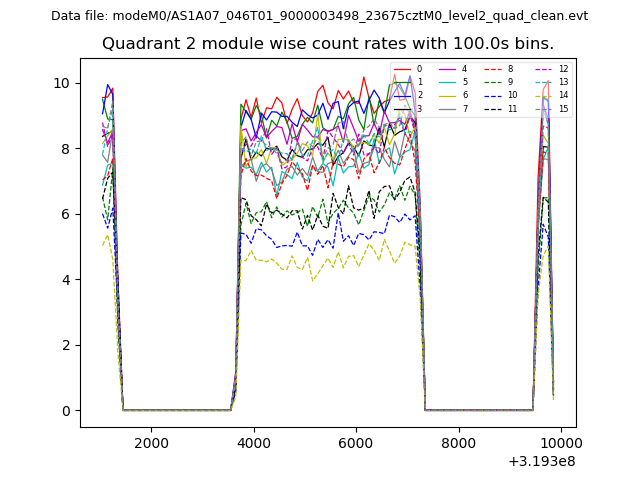
| Module-wise count rates for Quadrant B Data is divided into 100 sec bins |
 |
 |
| Module-wise count rates for Quadrant C Data is divided into 100 sec bins |
 |
 |
| Module-wise count rates for Quadrant D Data is divided into 100 sec bins |
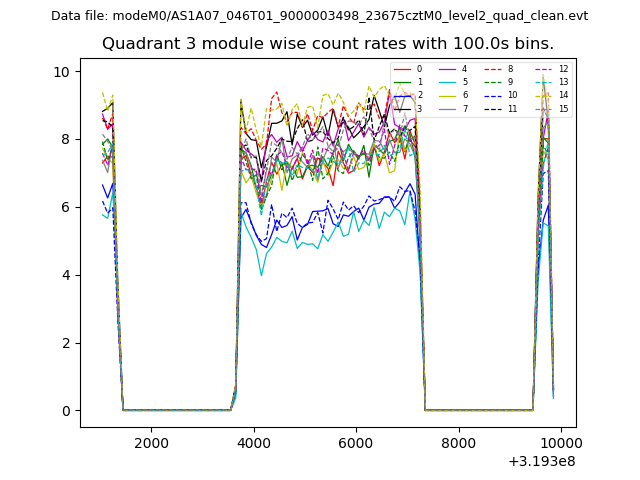 |
 |
| Parameter | Plot |
|---|---|
| CZT HV Monitor | 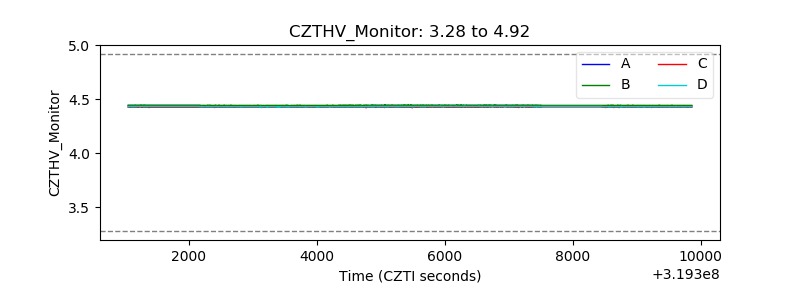 |
| D_VDD | 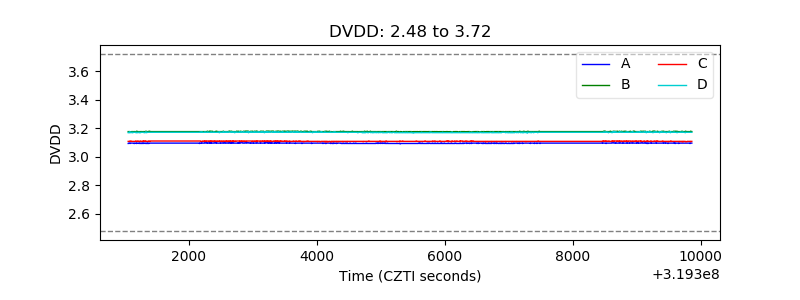 |
| Temperature 1 | 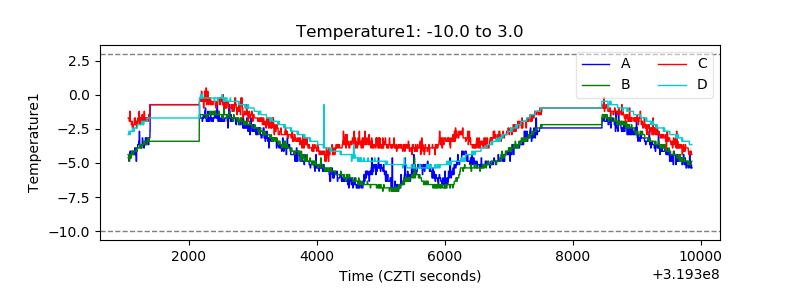 |
| Veto HV Monitor | 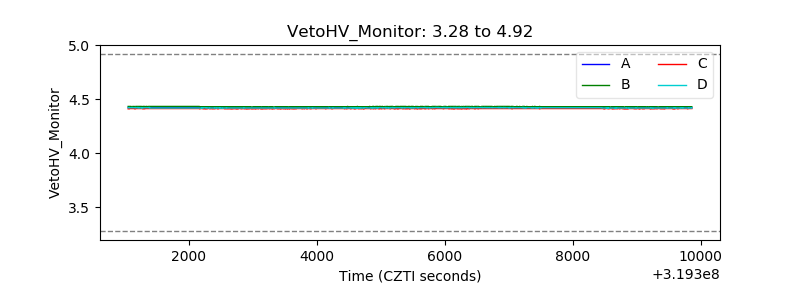 |
| Veto LLD | 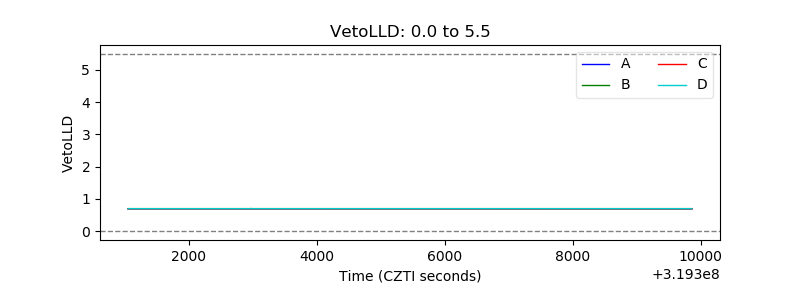 |
| Alpha Counter | 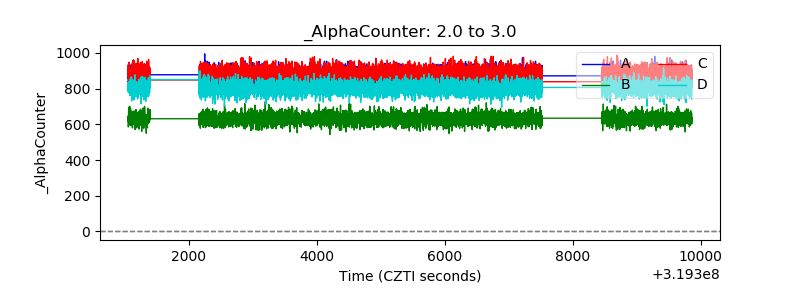 |
| _CPM_Rate | 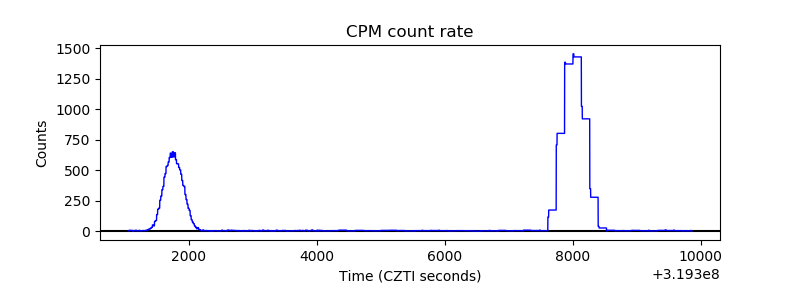 |
| CZT Counter | 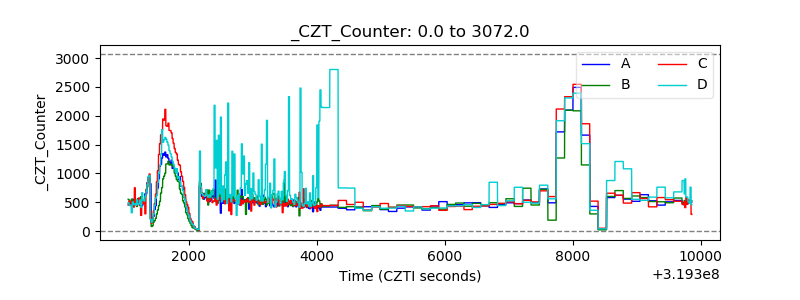 |
| +2.5 Volts monitor |  |
| +5 Volts monitor |  |
| _ROLL_ROT | 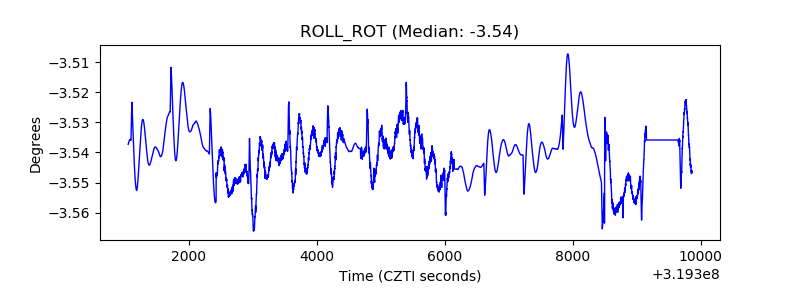 |
| _Roll_DEC | 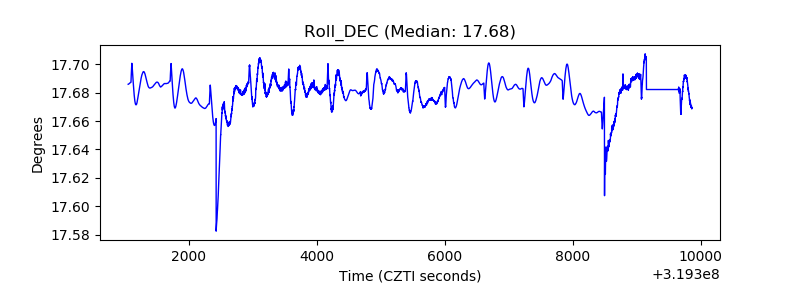 |
| _Roll_RA | 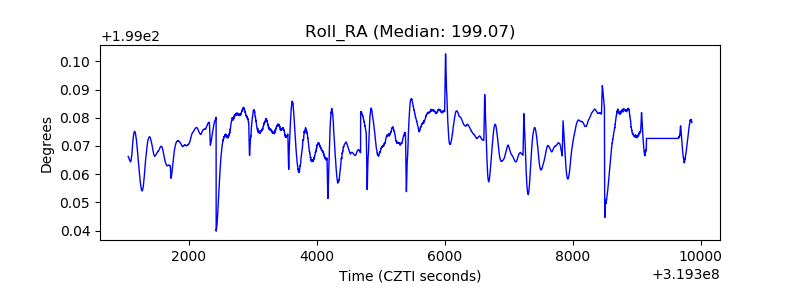 |
| Veto Counter | 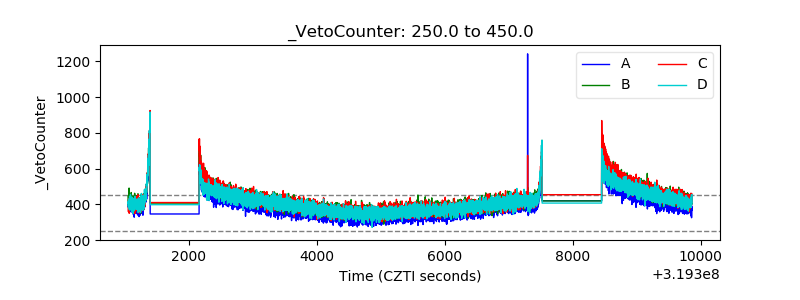 |